

Show Key Metrics with Number Charts
Not every insight needs a chart. Sometimes the most powerful thing you can show is a single, prominent number. Number charts highlight your most critical figures—no axes, no legends, just the data that matters most. Use a number chart when a figure, like your total outstanding debt or current collection rate, is important enough to stand alone.
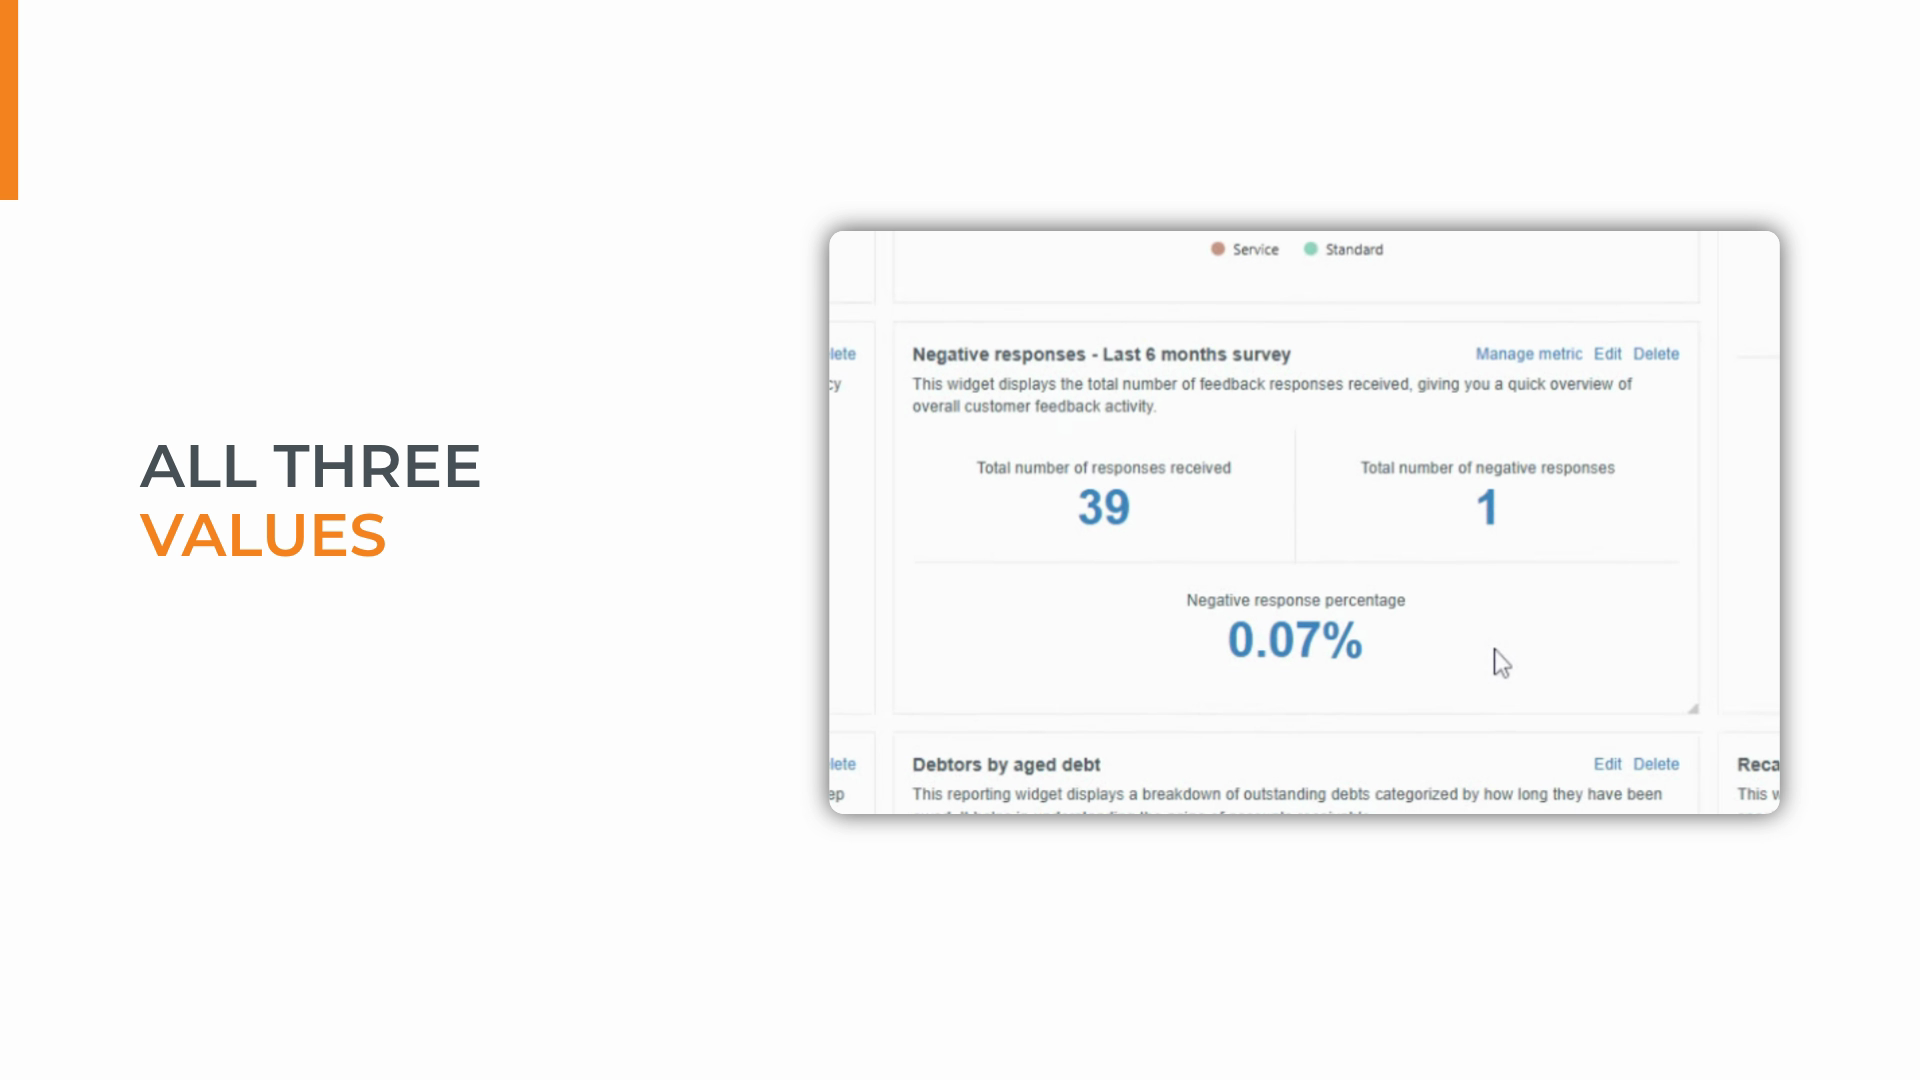
This tutorial walks you through building a feedback snapshot using three metrics displayed in one widget: total responses, negative responses, and negative response percentage.
Step 1: Click Add Custom Widget and give your widget a name.
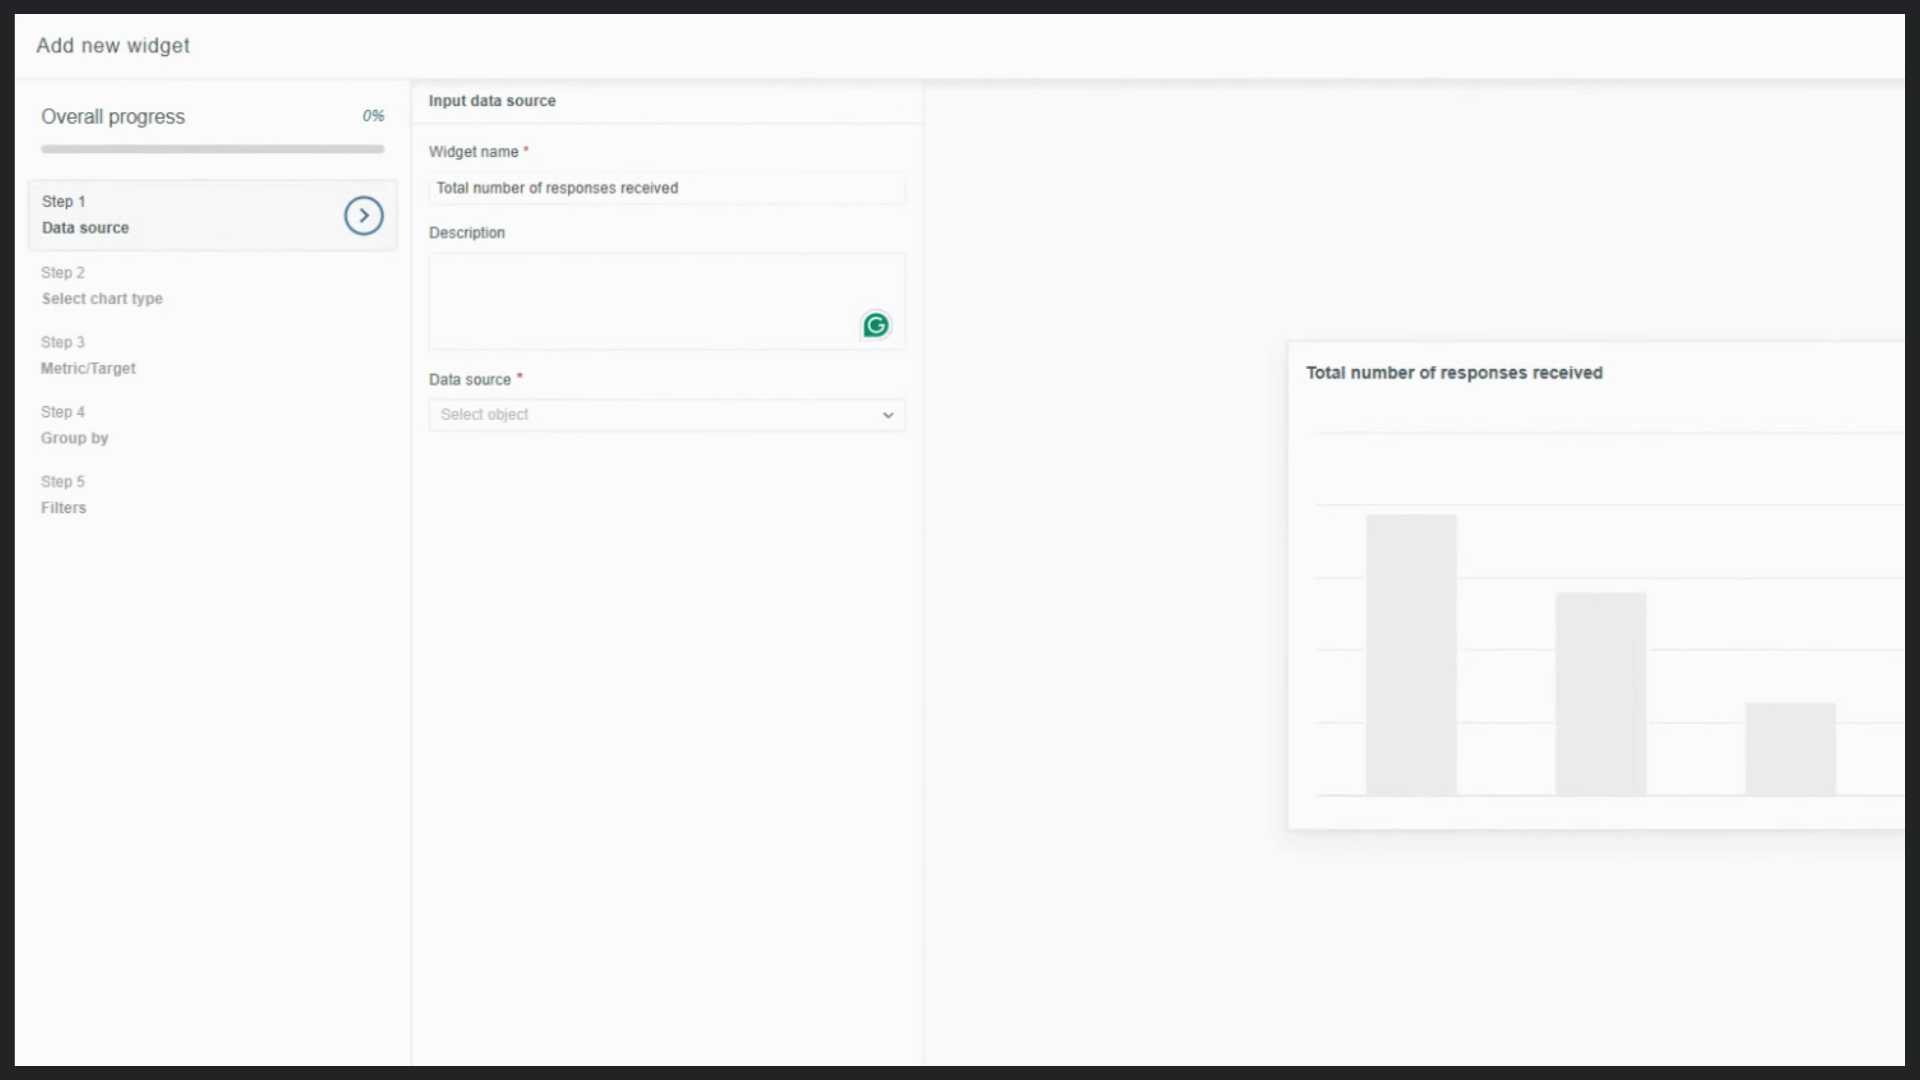
Step 2: Select Jobs as your data source. This links feedback to completed work and ensures accurate reporting.
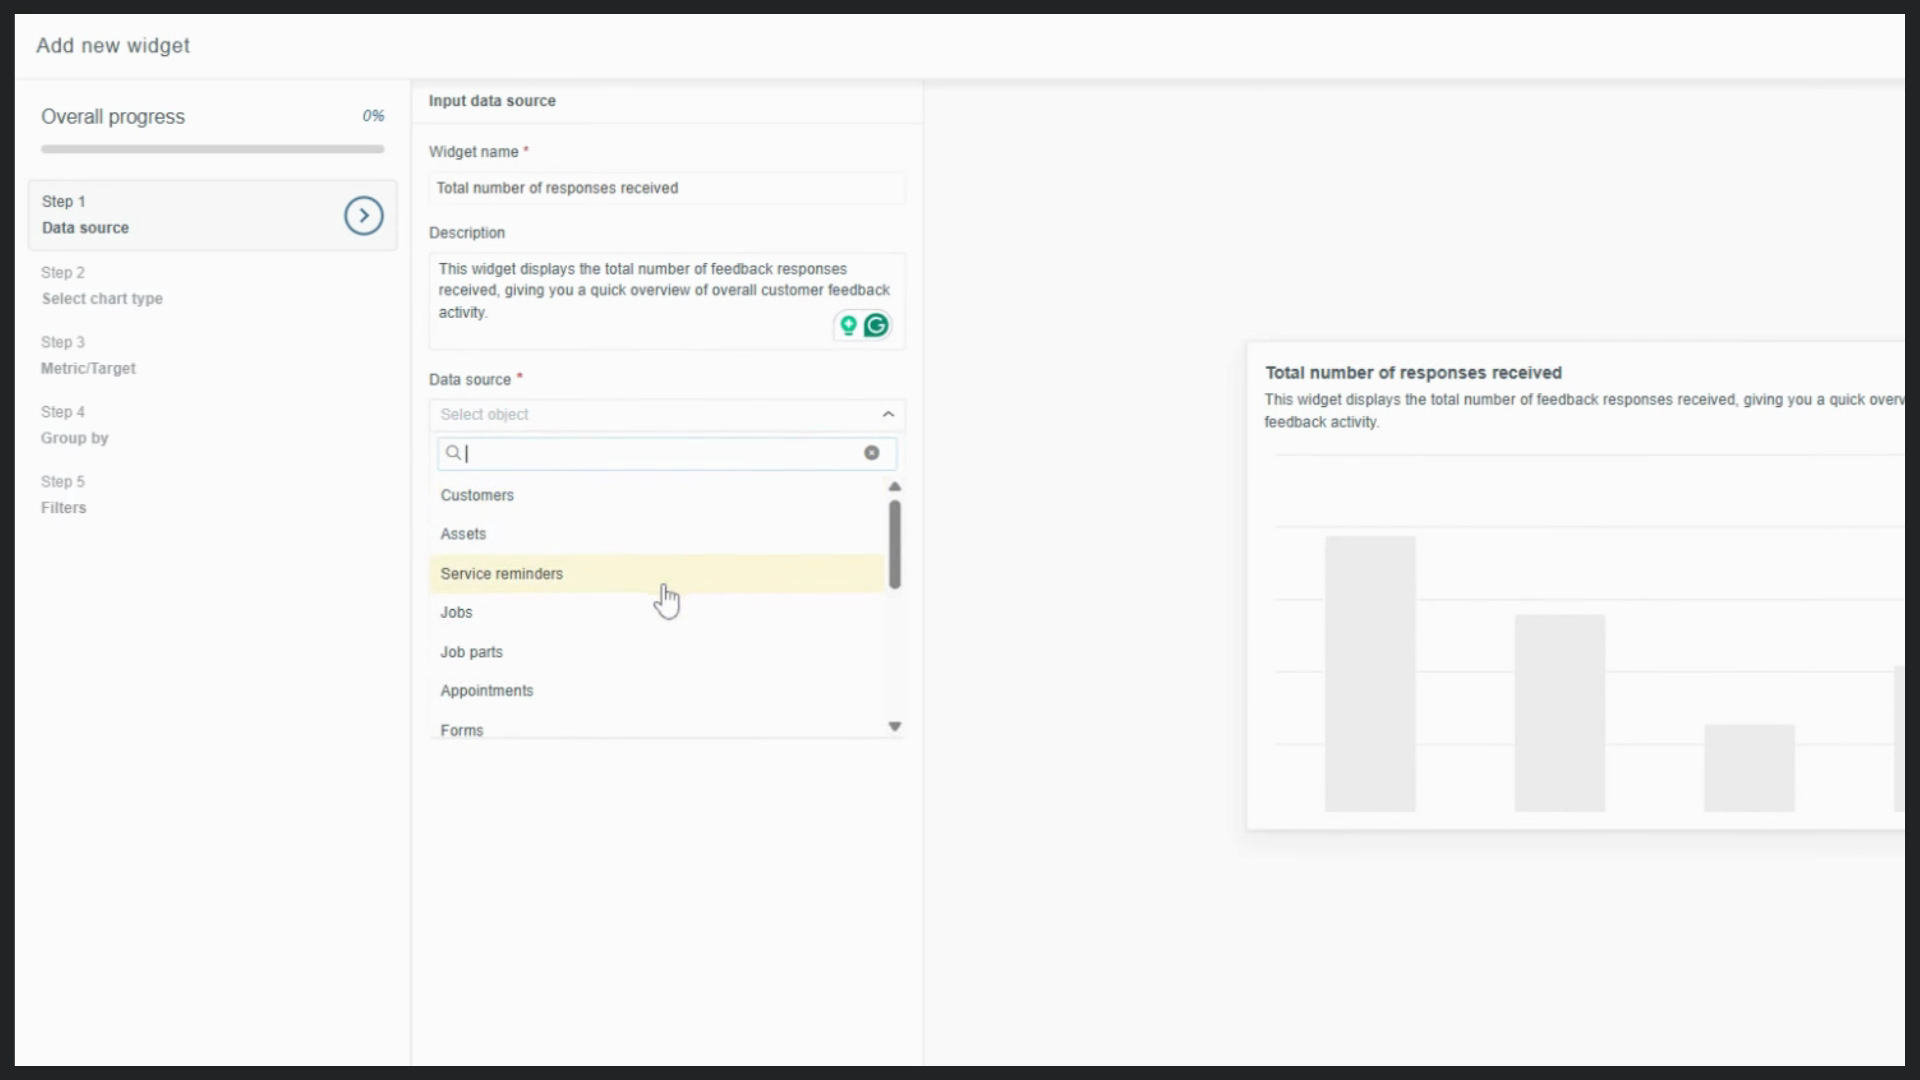
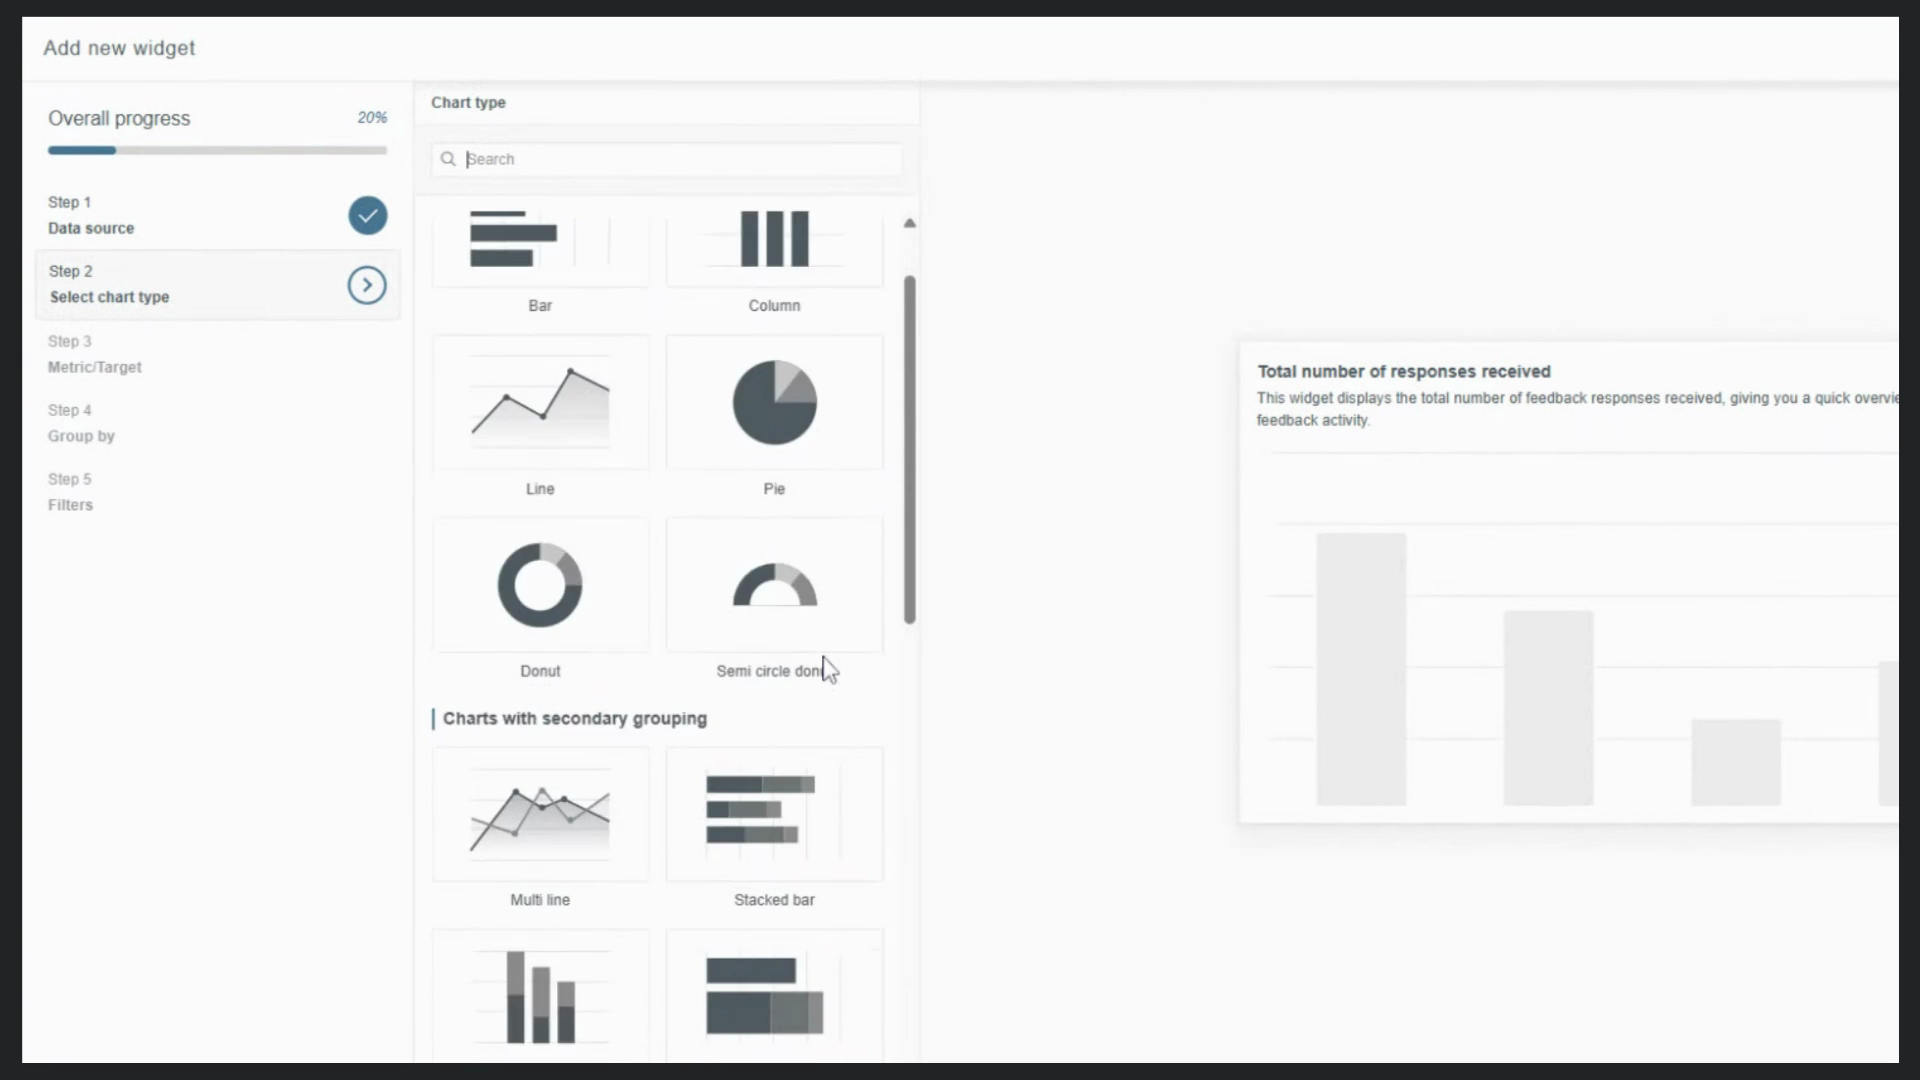
Step 3: Set the Chart Type to Number chart to keep the focus on the numbers.
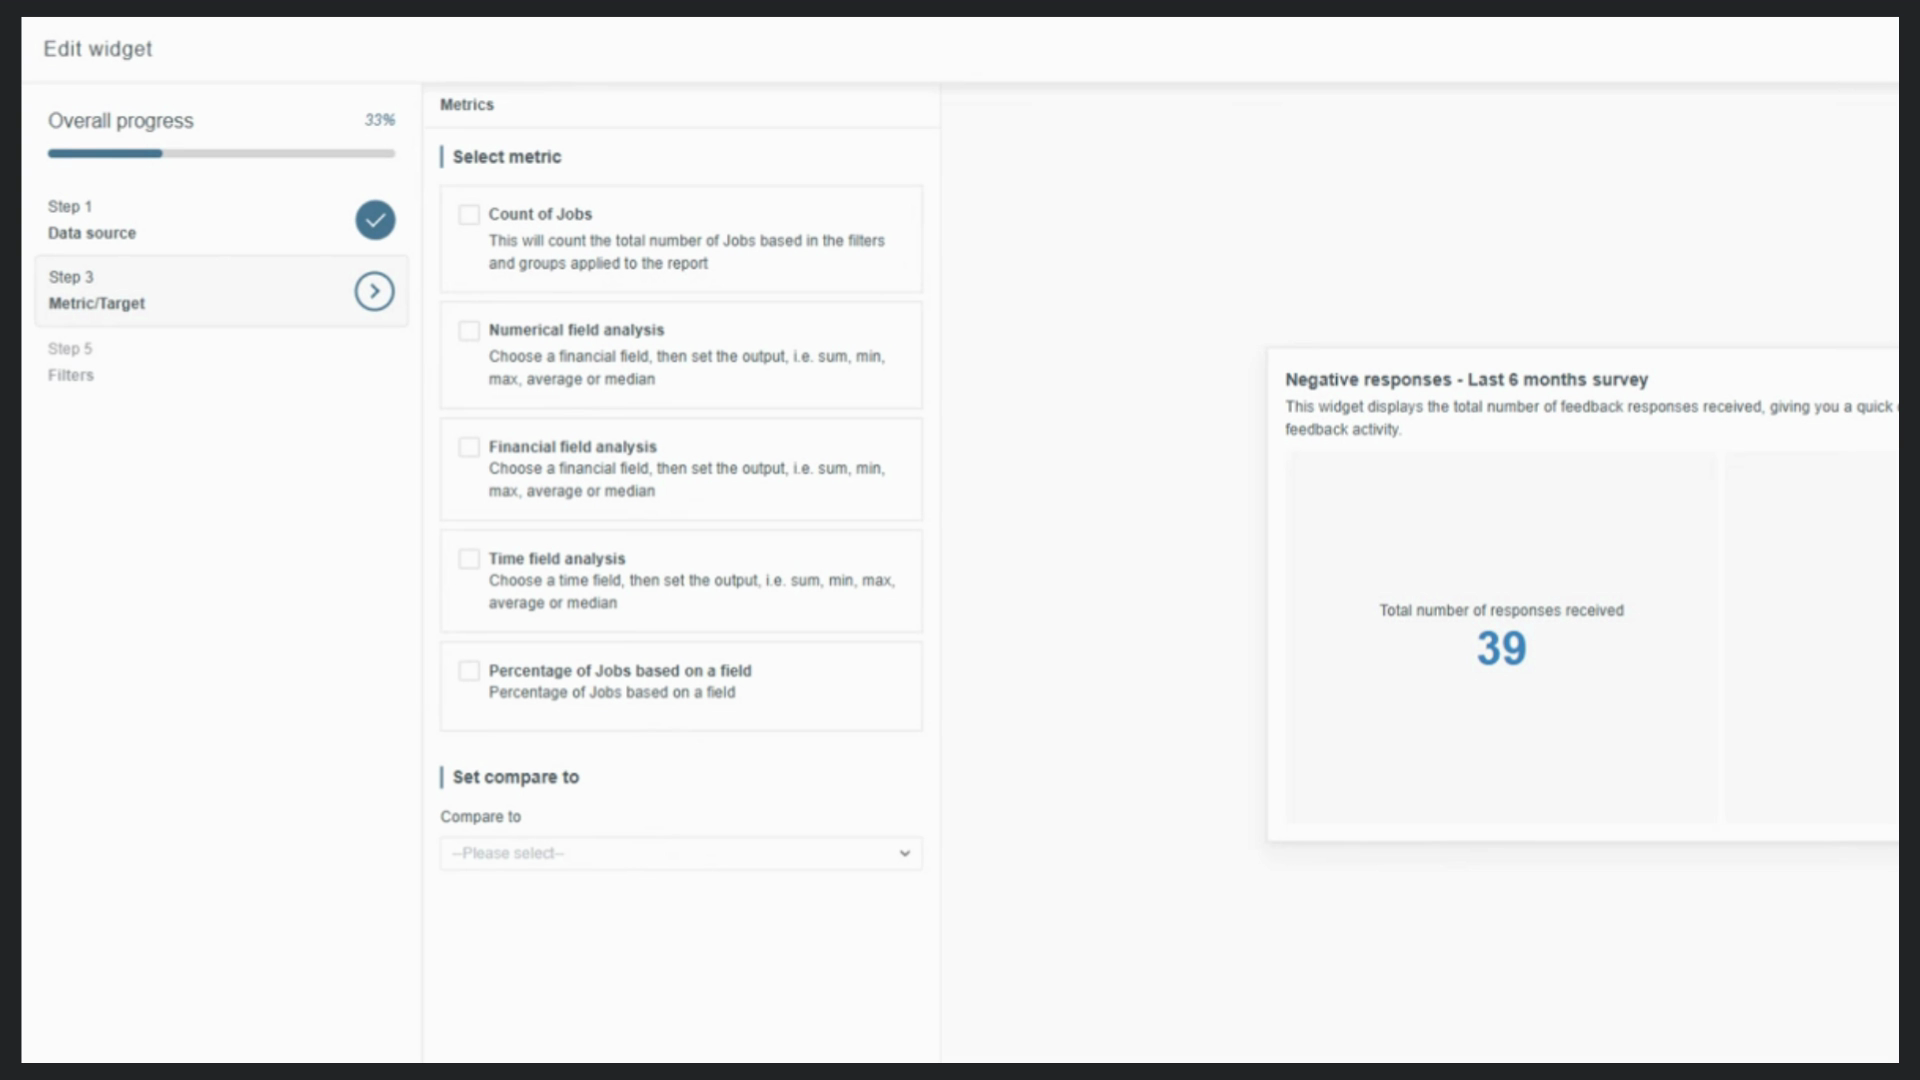
Step 4: In Metric and Target, select Count of Jobs. This sets your baseline—the total number of responses received.
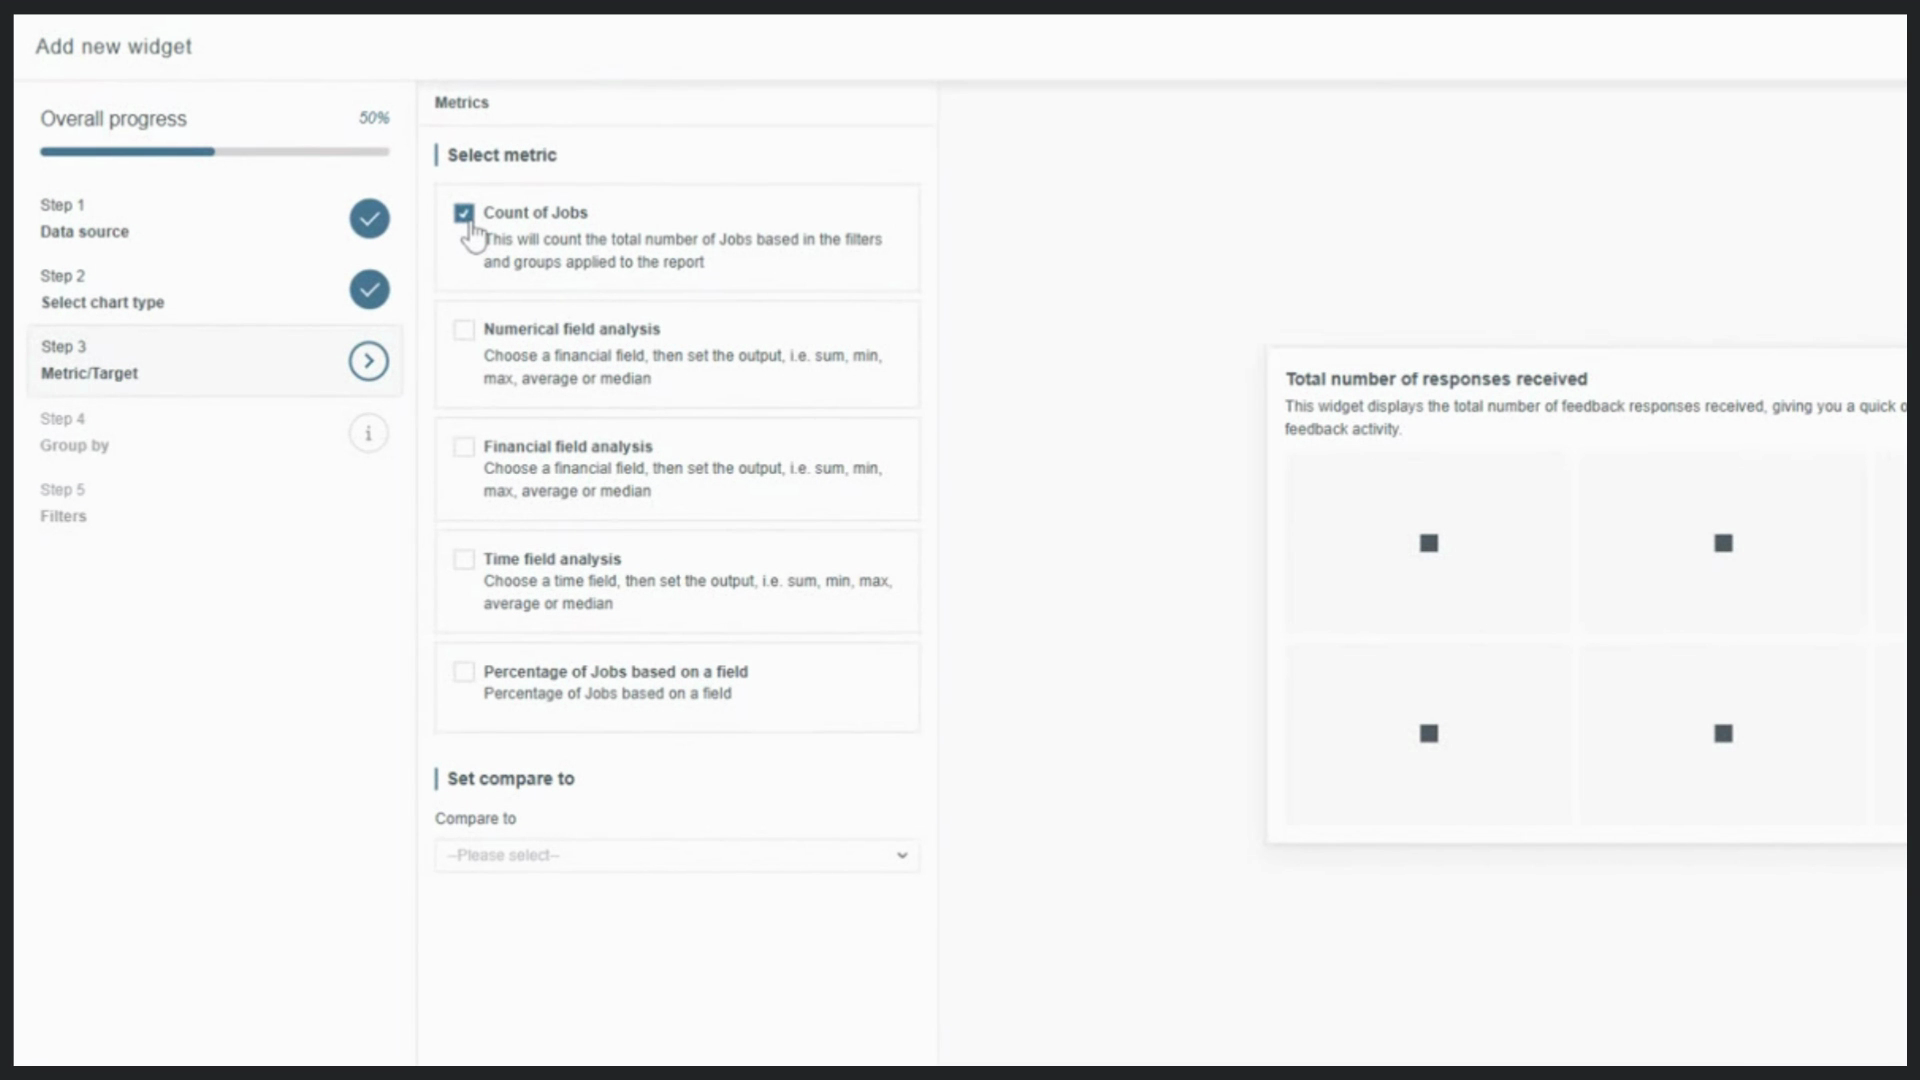
Step 5: Skip the Group by step. You’re displaying a single number, so there’s no need to split results by date or category.
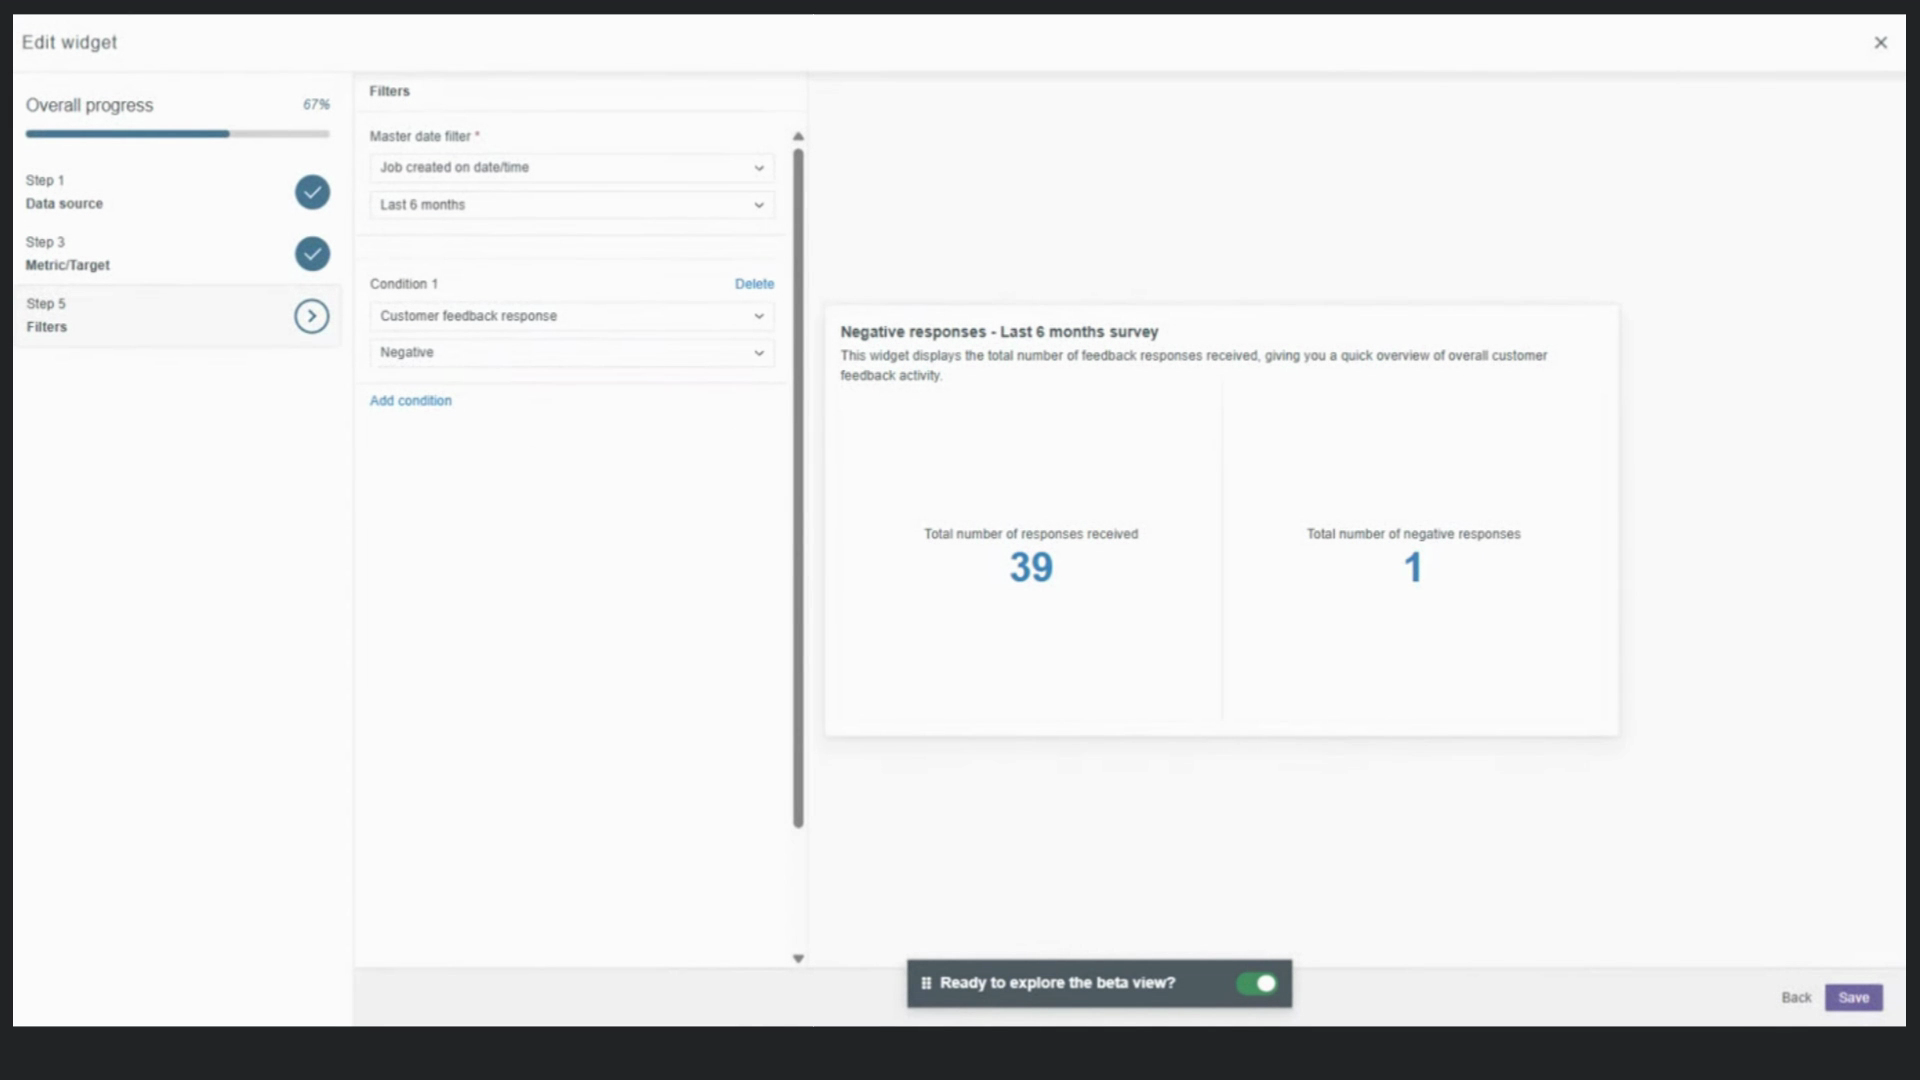
Step 6: In Filters, set the Master Date filter to the last six months, and add a filter for jobs where Feedback Received is equal to Yes. This keeps your baseline relevant to recent engagement.
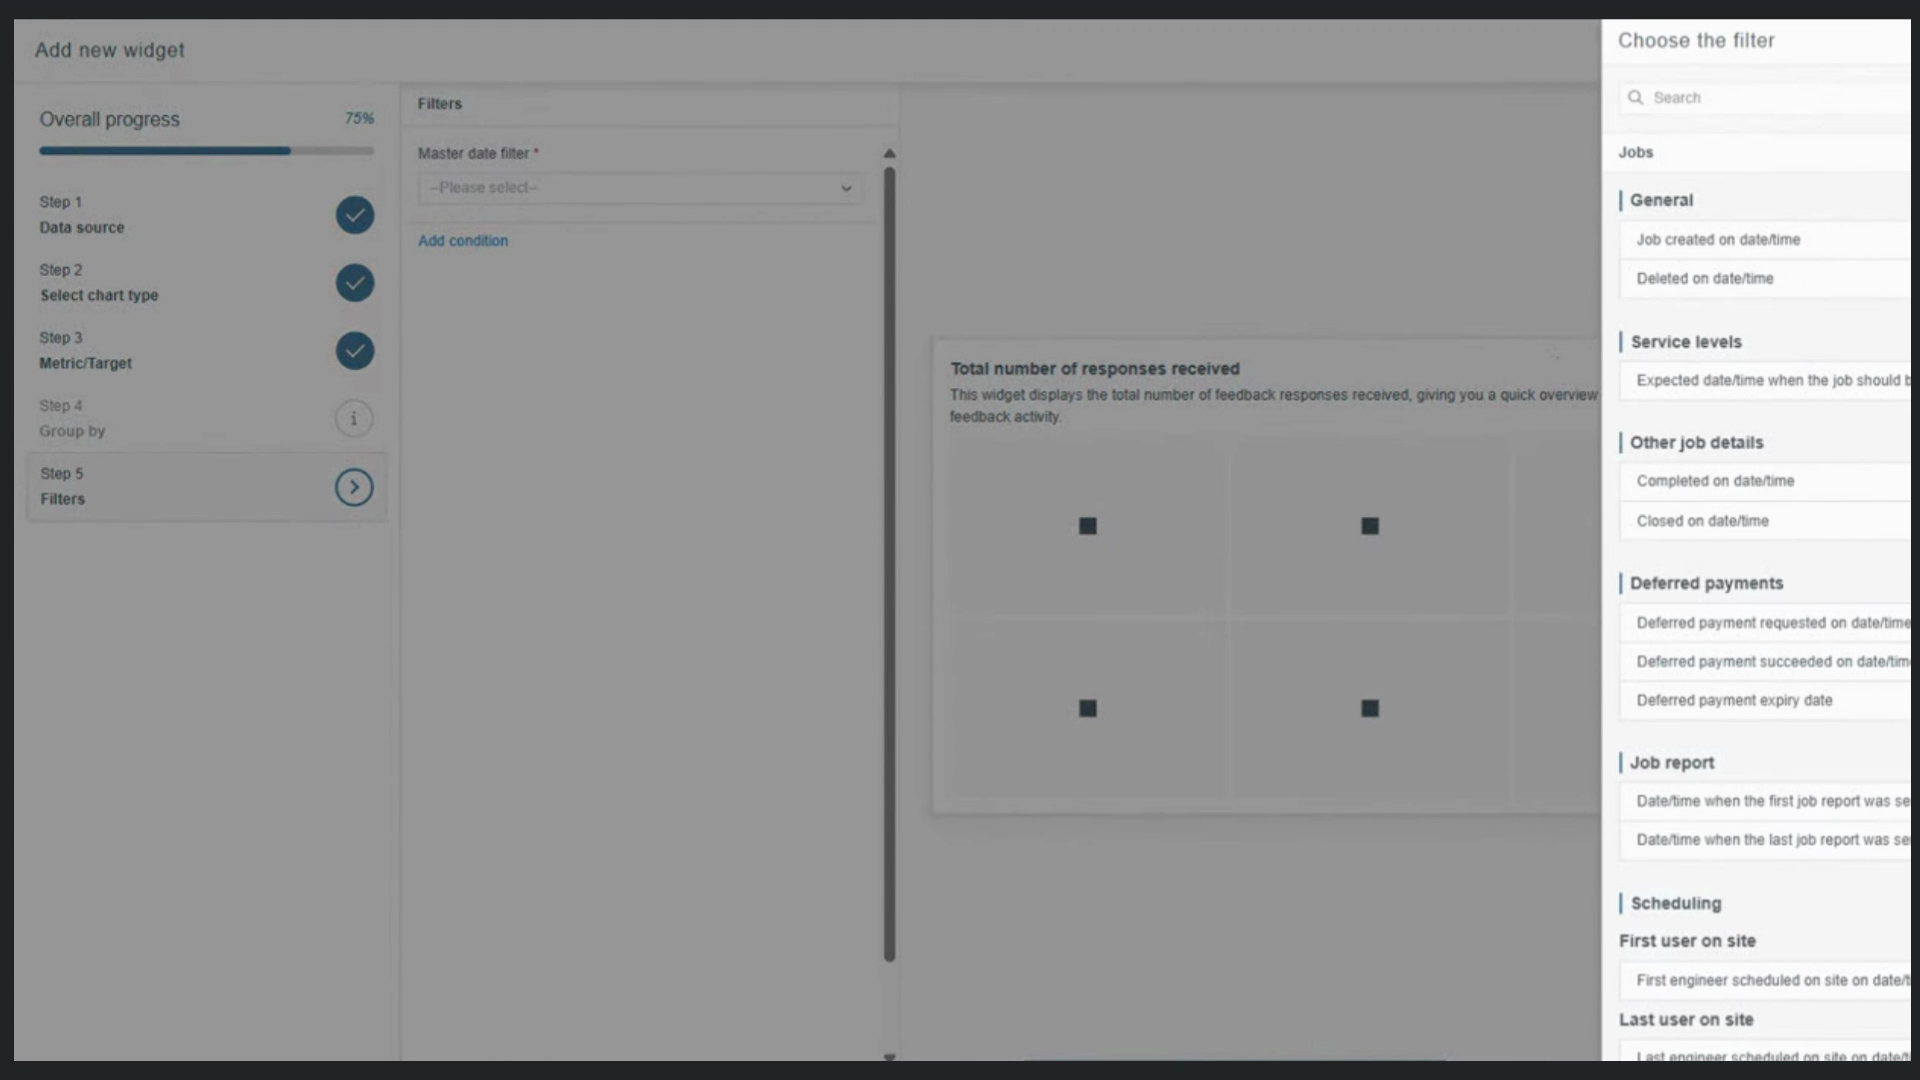
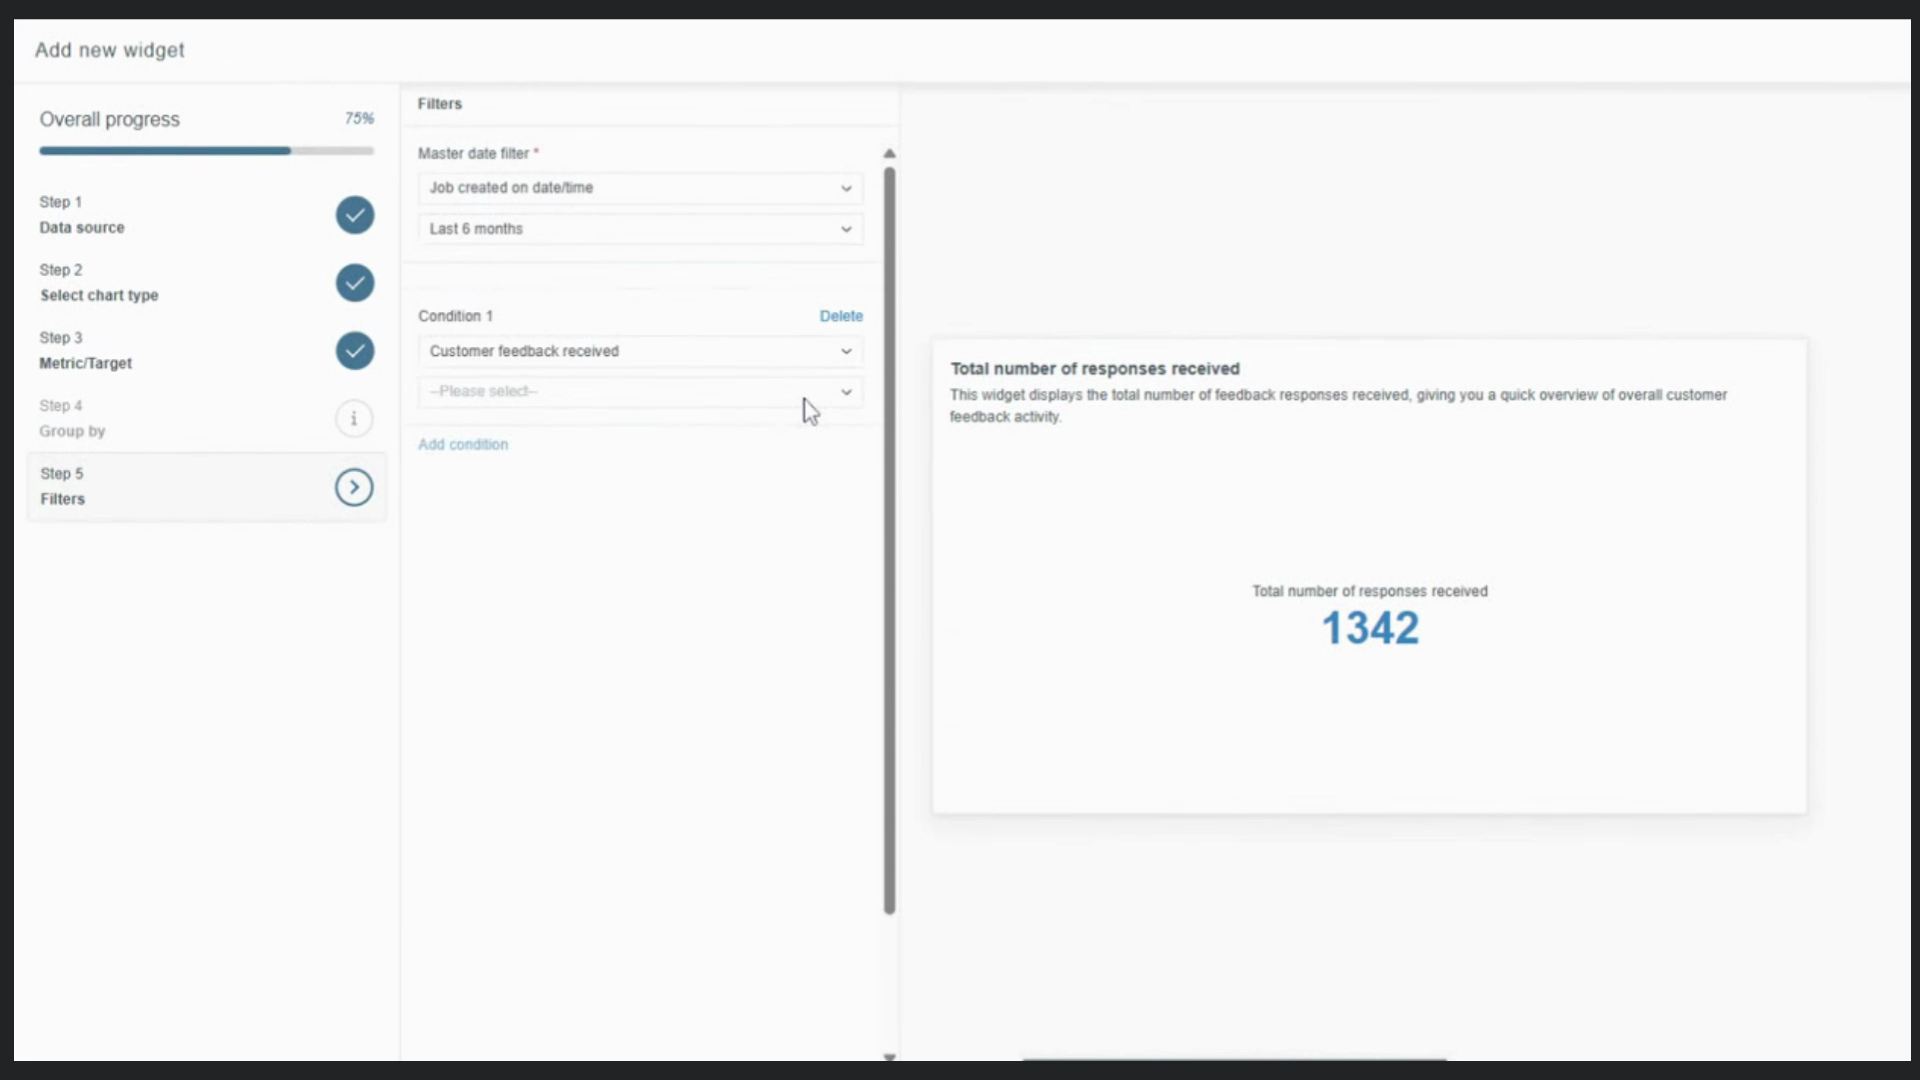
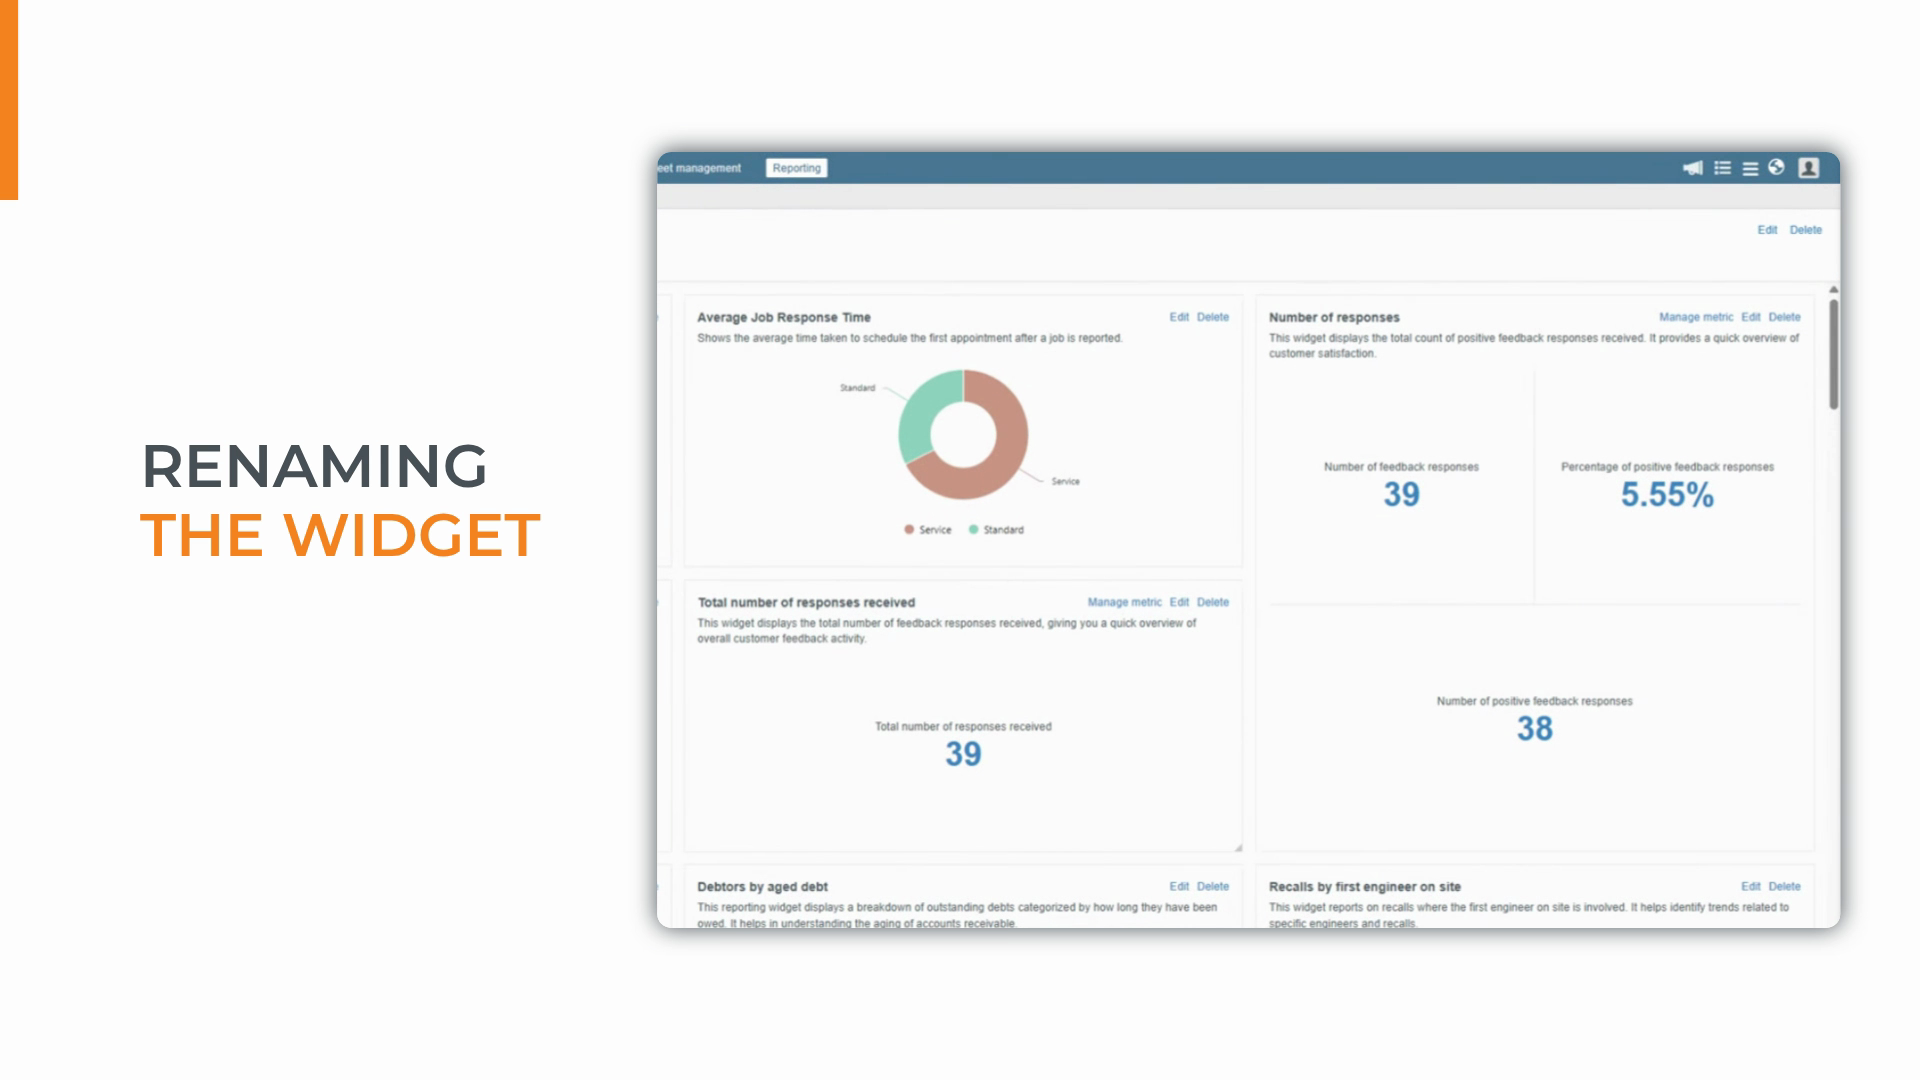
Step 7: Click Save. After saving, click Edit and update the widget name to make its purpose clear—like "Negative responses last six months."
Add Negative Responses and Percentage Metrics
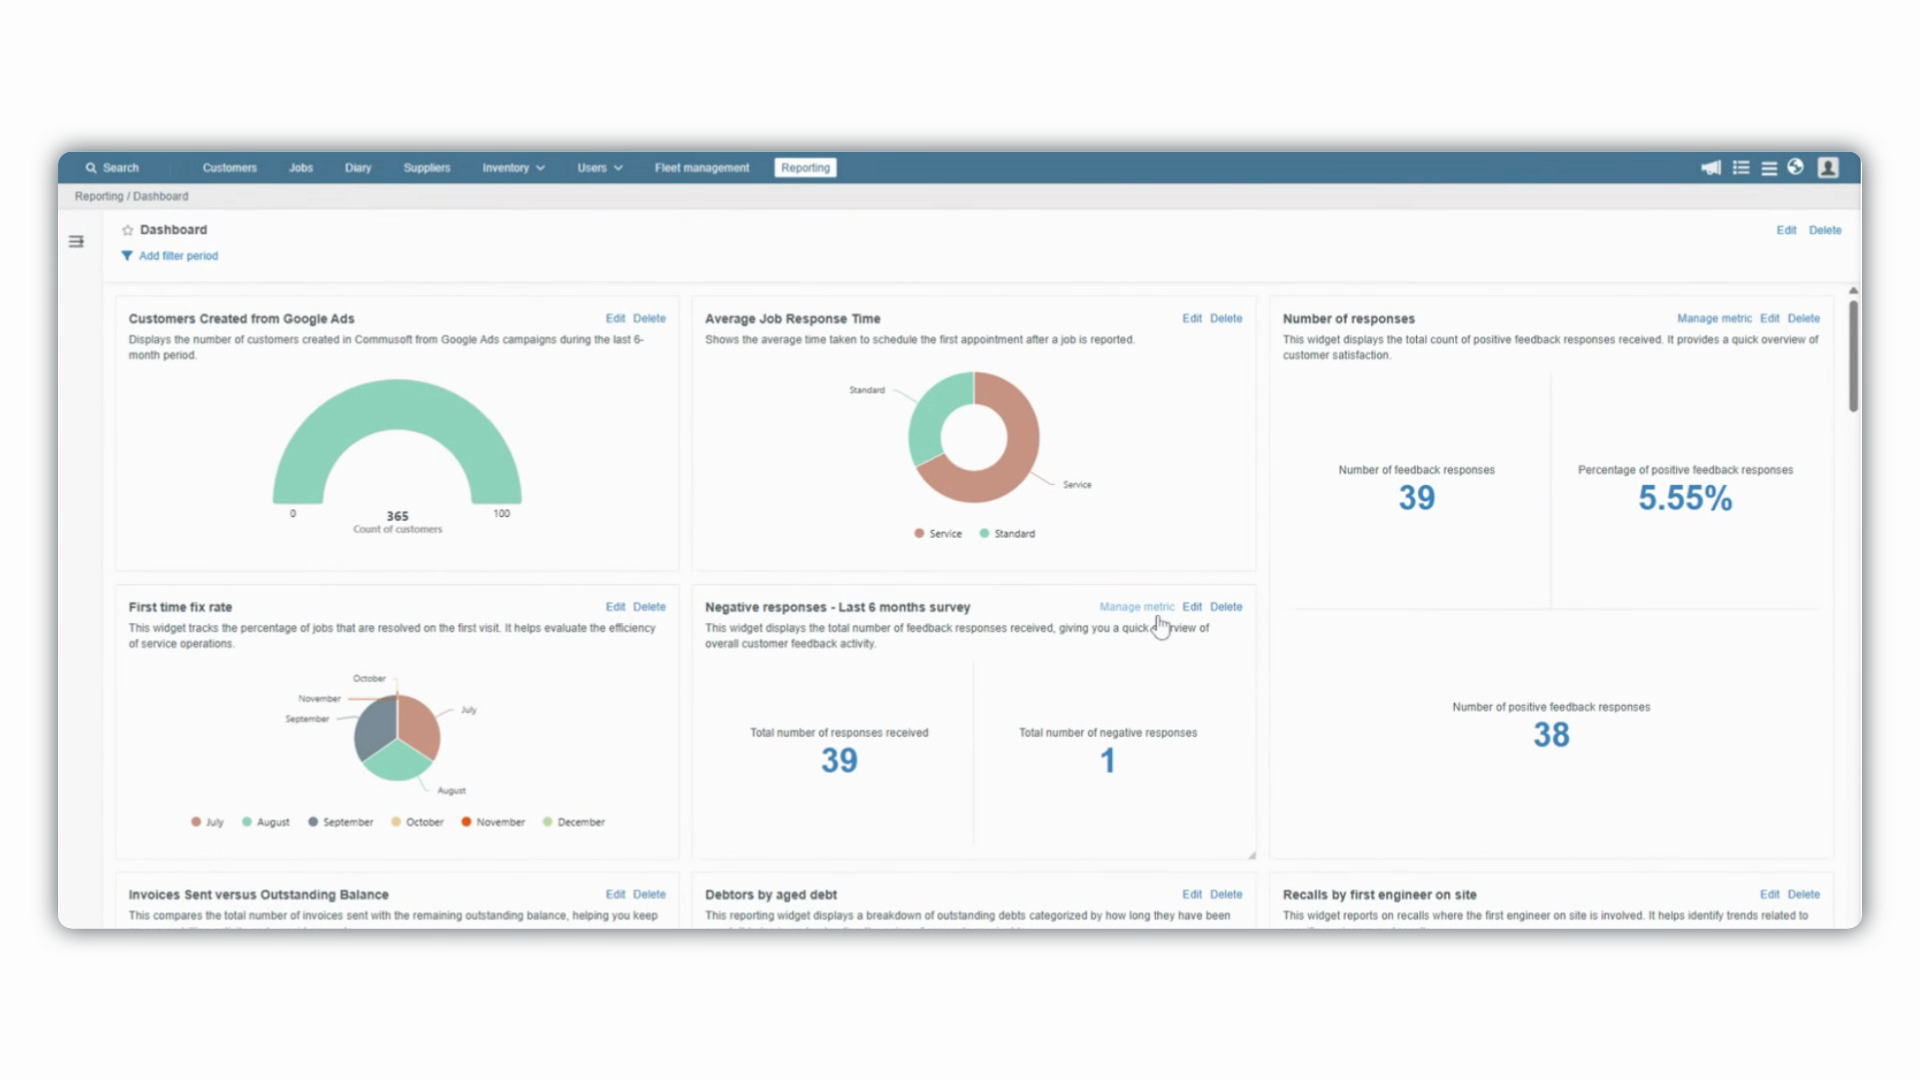
Step 1: At the top of the widget, click Manage Metrics.
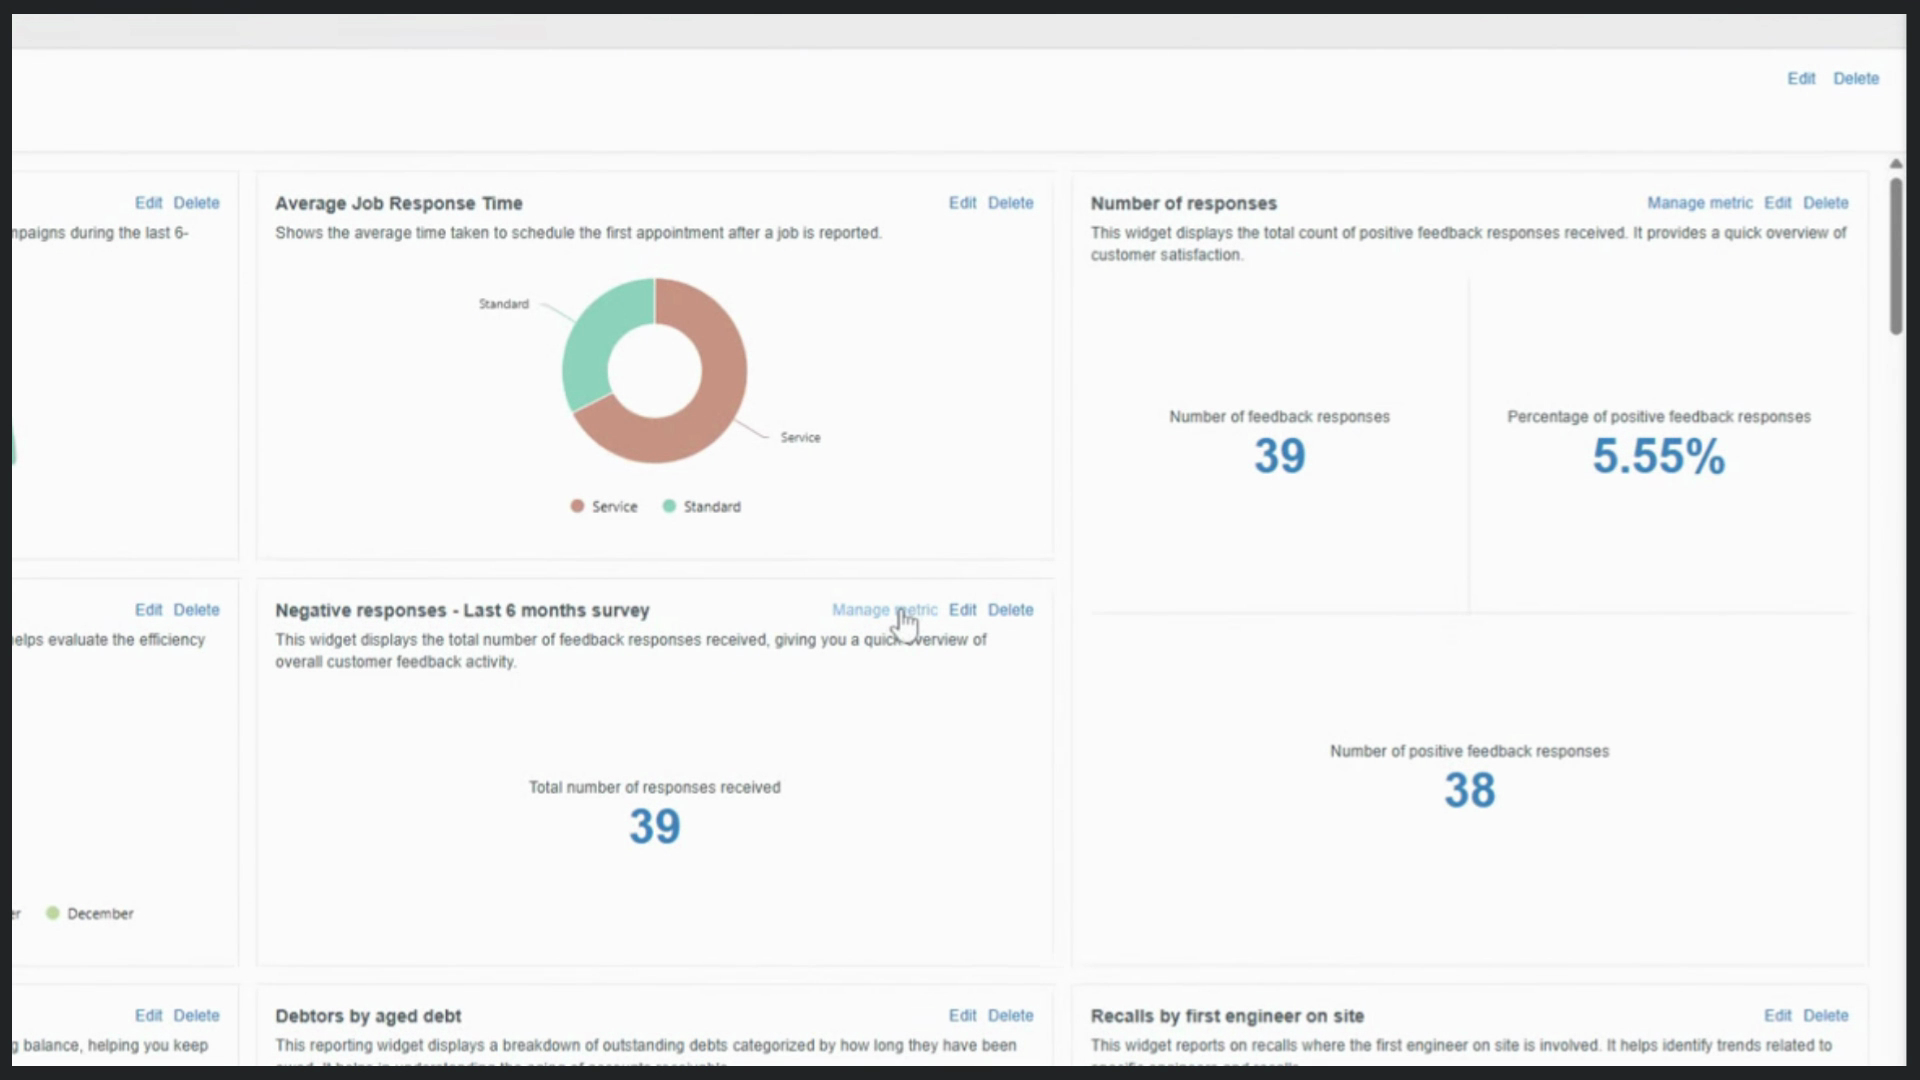
Step 2: Click Add New Metric in the side panel. Name this metric (for example, "Total number of Negative Responses"). Choose Jobs as the data source.
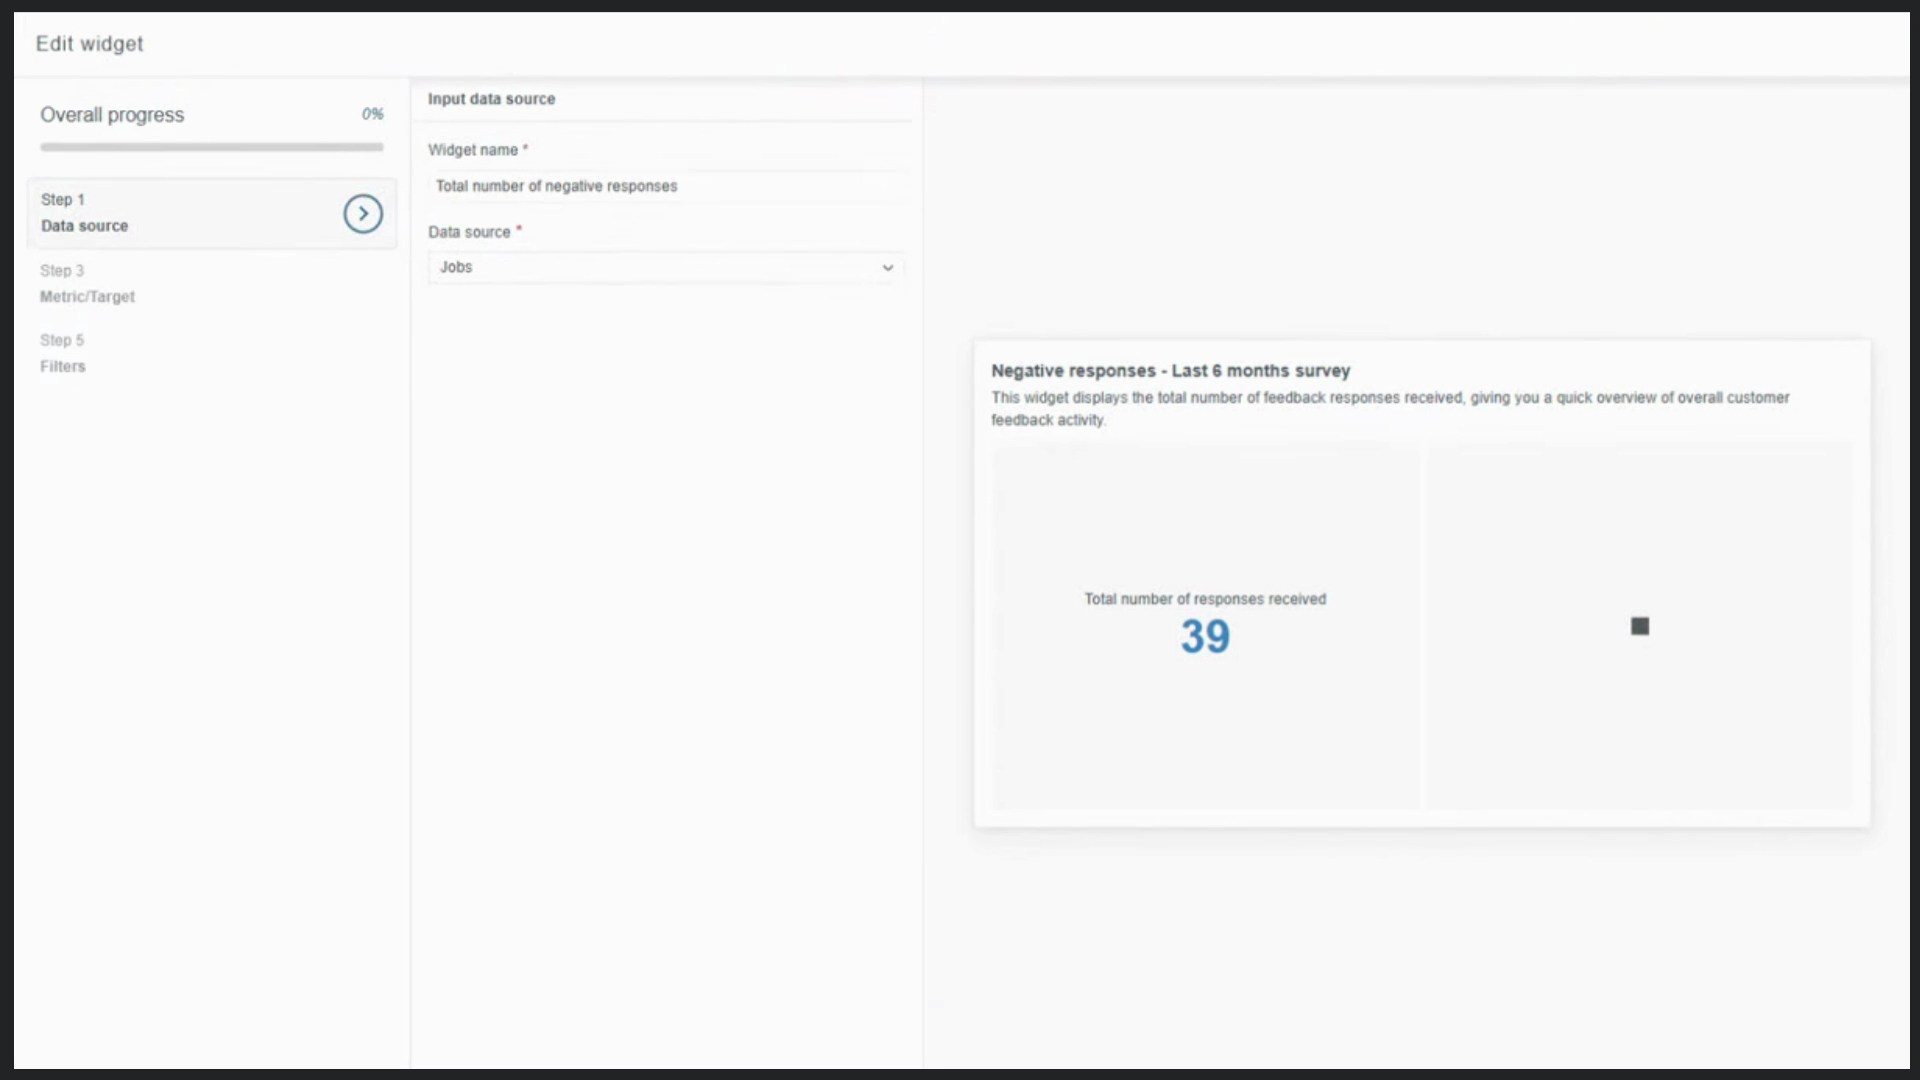
Step 3: For the metric, select Count of Jobs again.
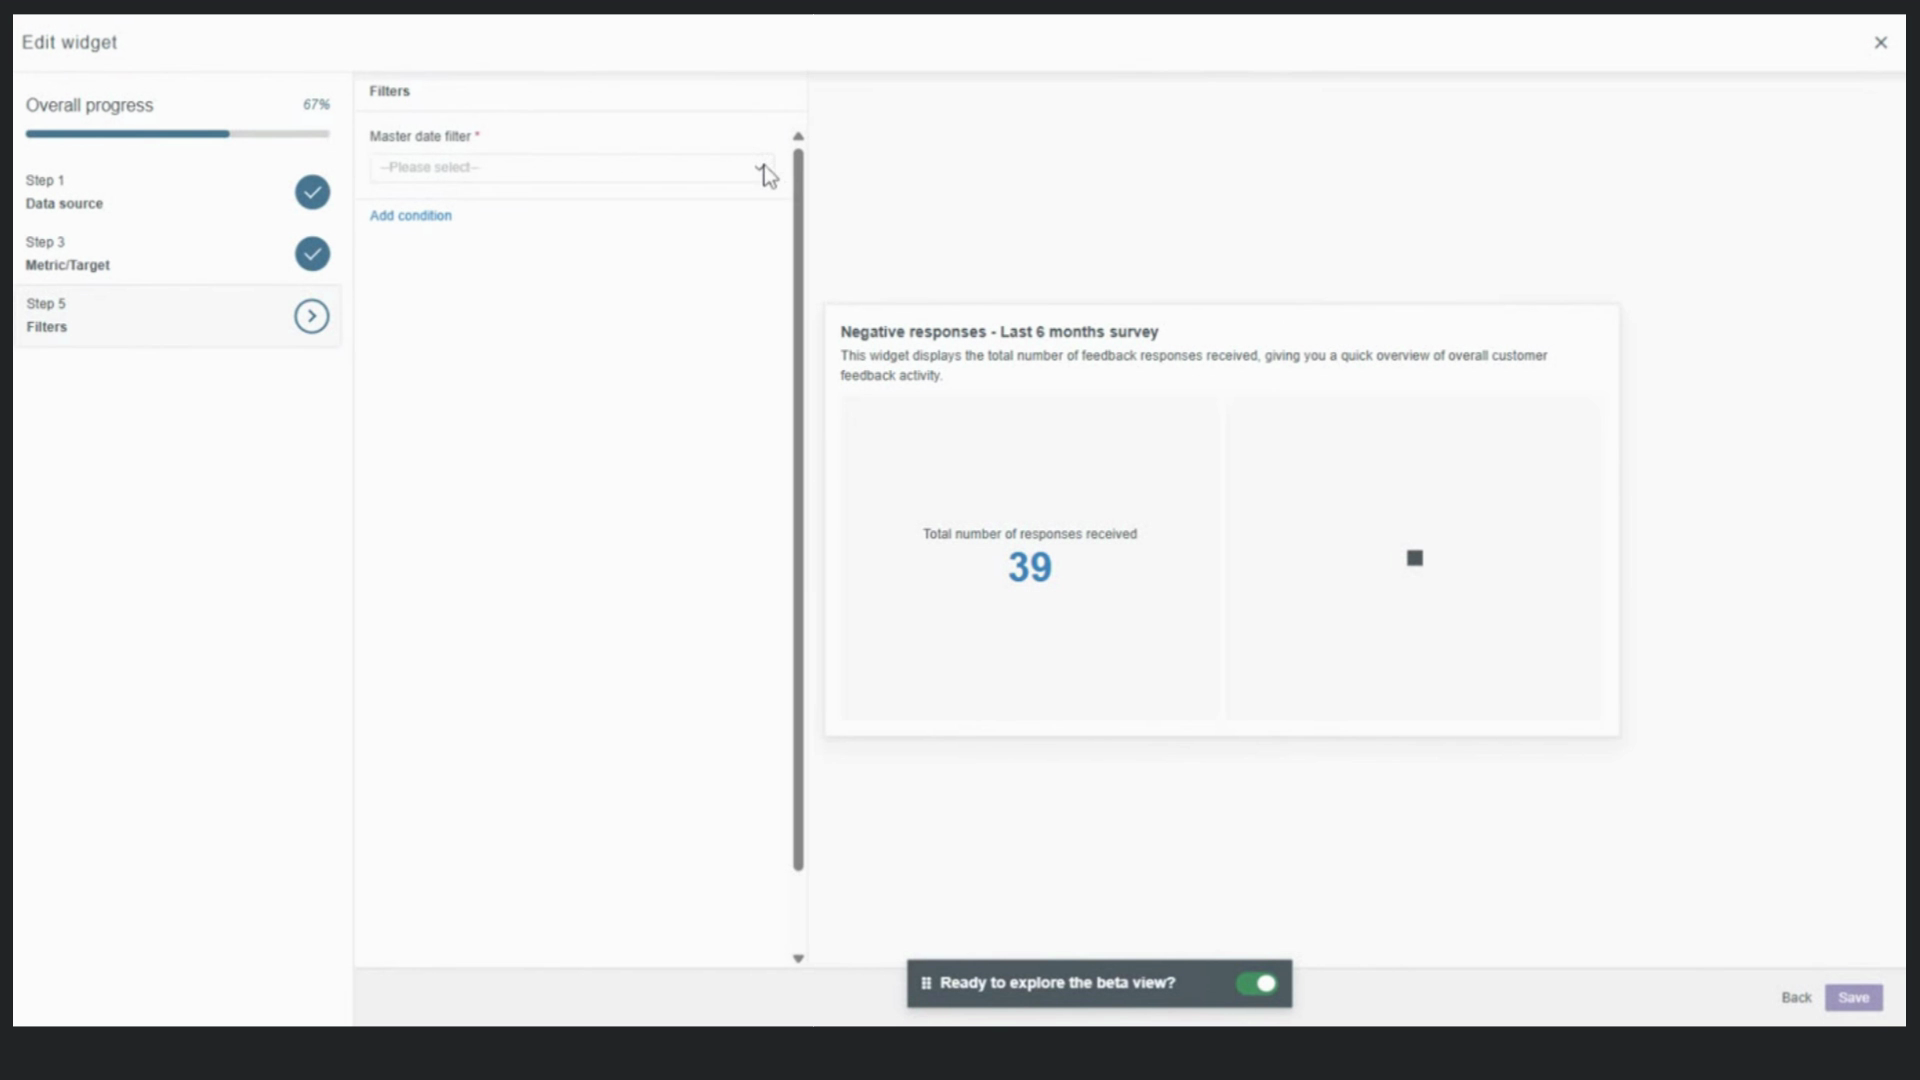
Step 4: Keep the Master Date filter set to the last six months. Add a new filter where Customer Feedback Response is equal to Negative to isolate only the negative responses.
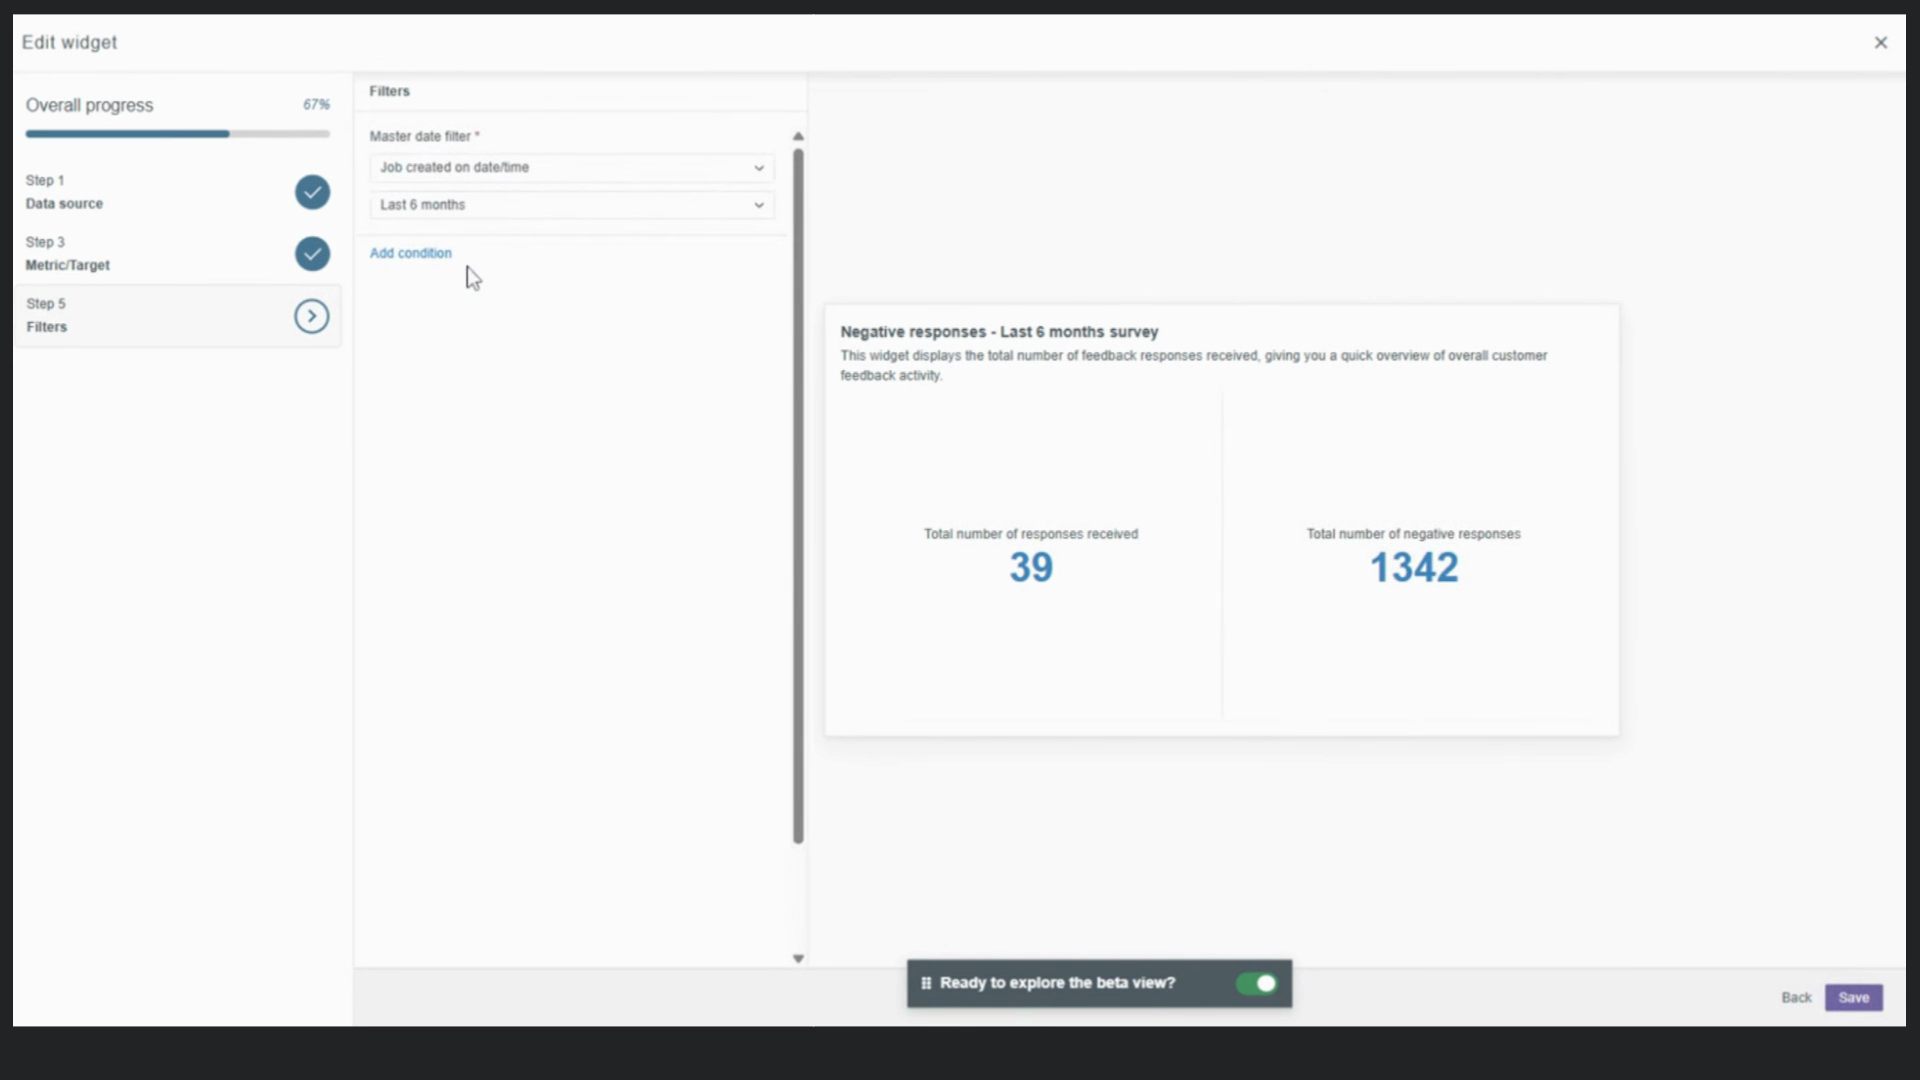
Step 5: Click Save to add this metric to your widget.
Display Negative Response Percentage
Step 1: Still in Manage Metrics, add another new metric called "Negative response percentage."
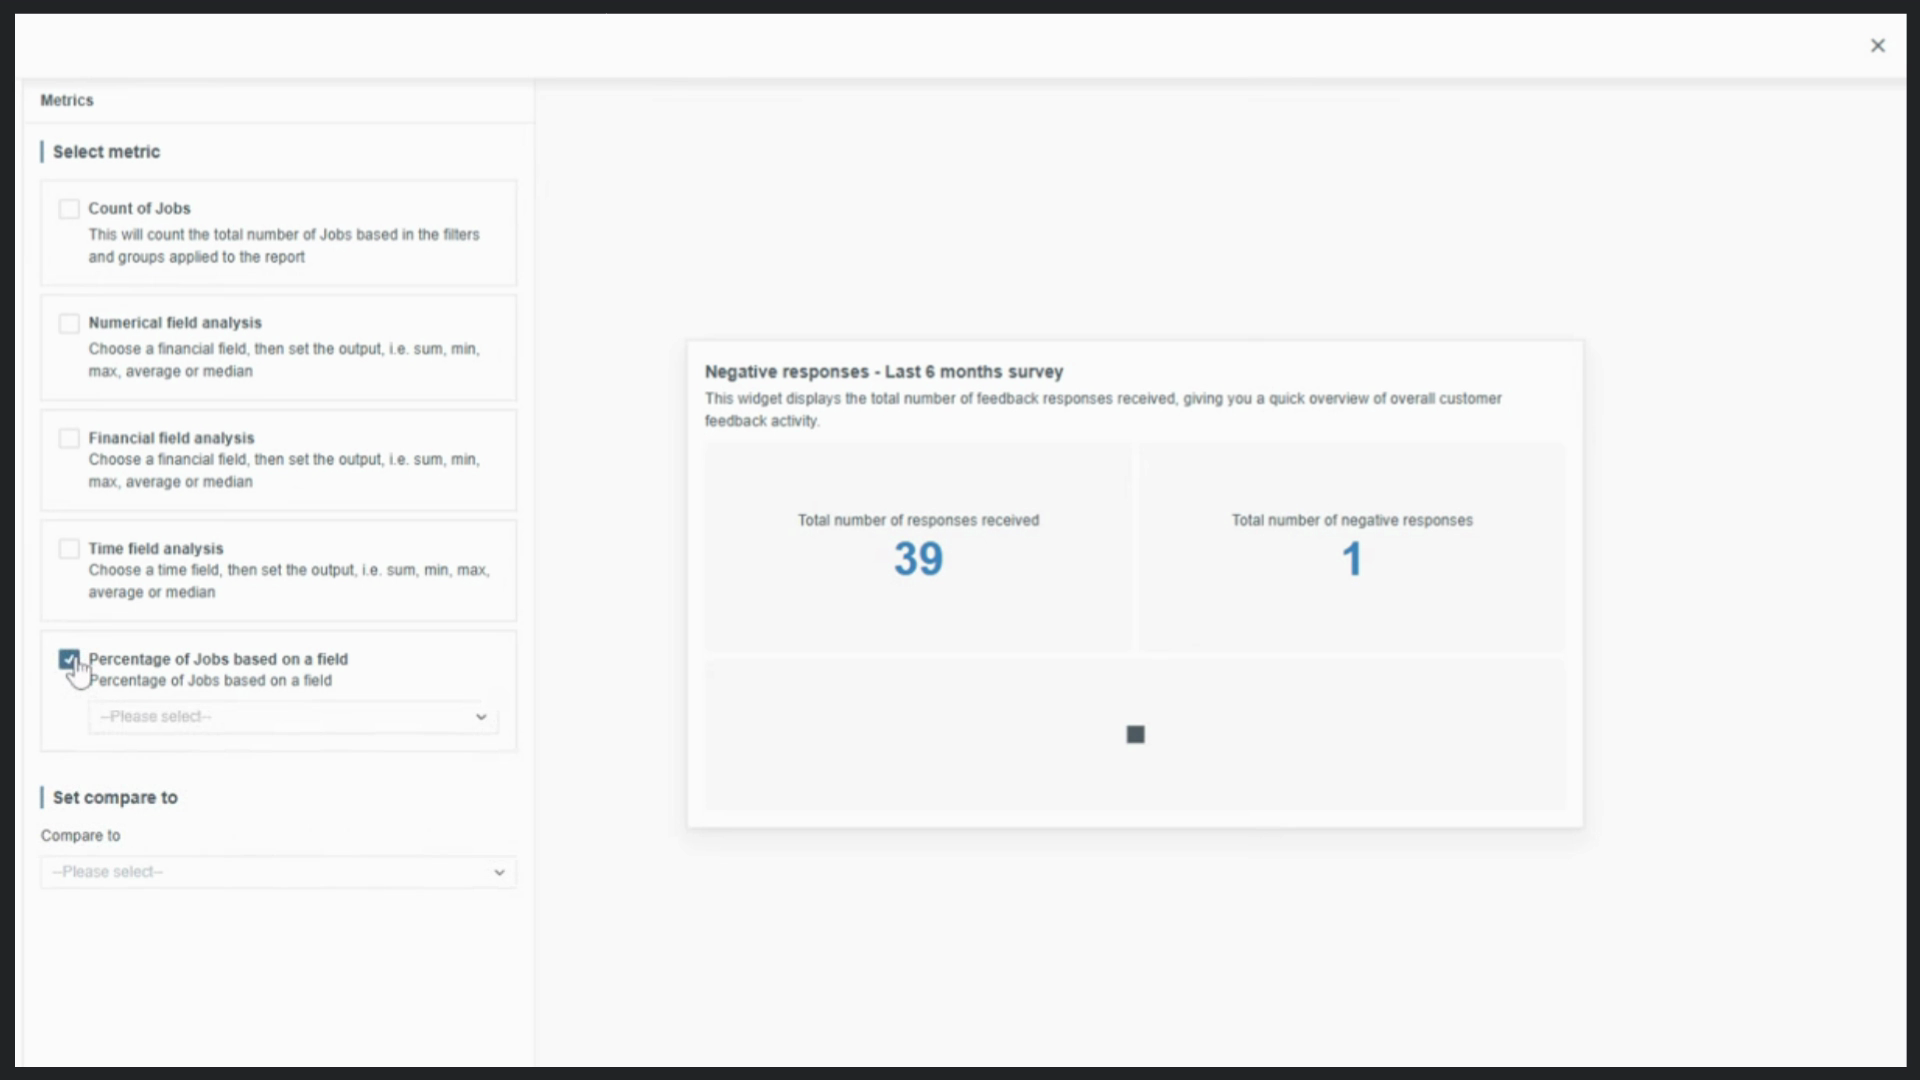
Step 2: In metric options, select Percentage of Jobs based on a field. Set the field to Customer Feedback Response and the value to Negative.
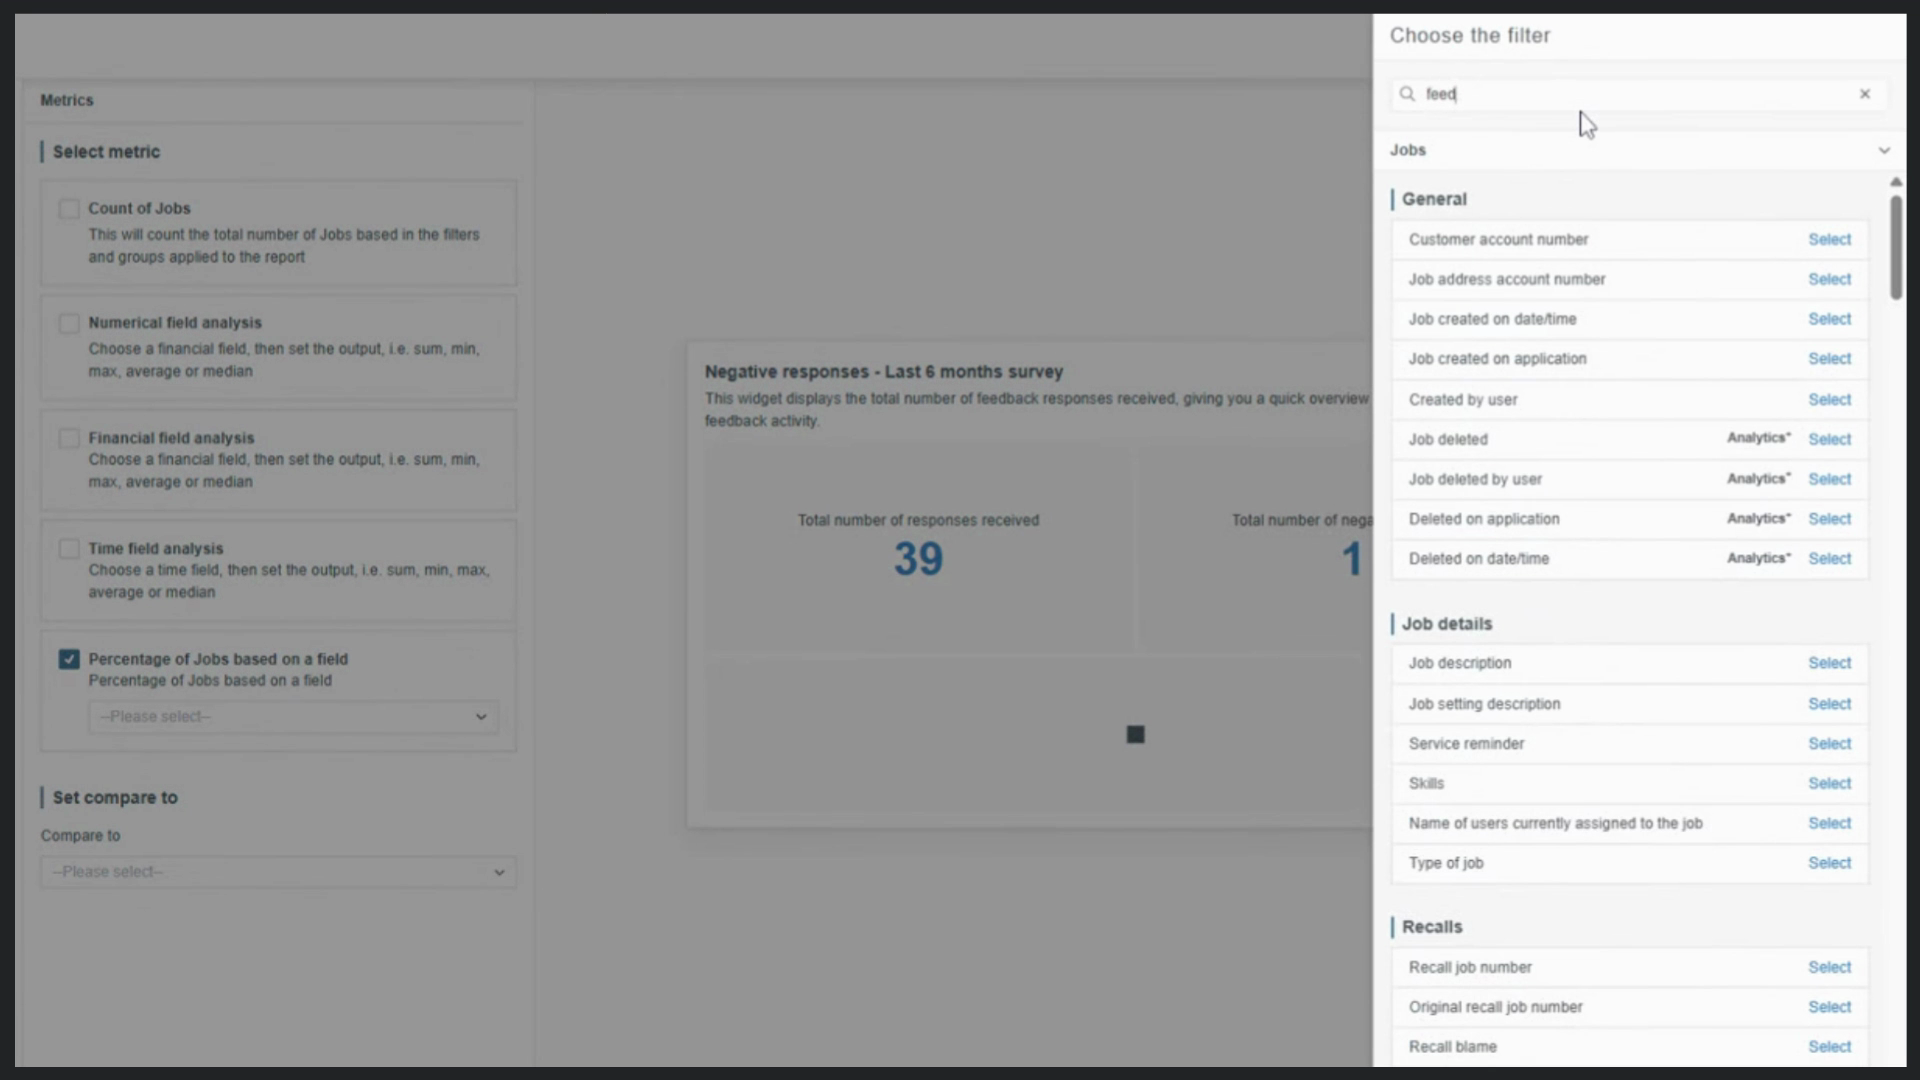
Step 3: Skip Group by for this metric, keeping the presentation simple.
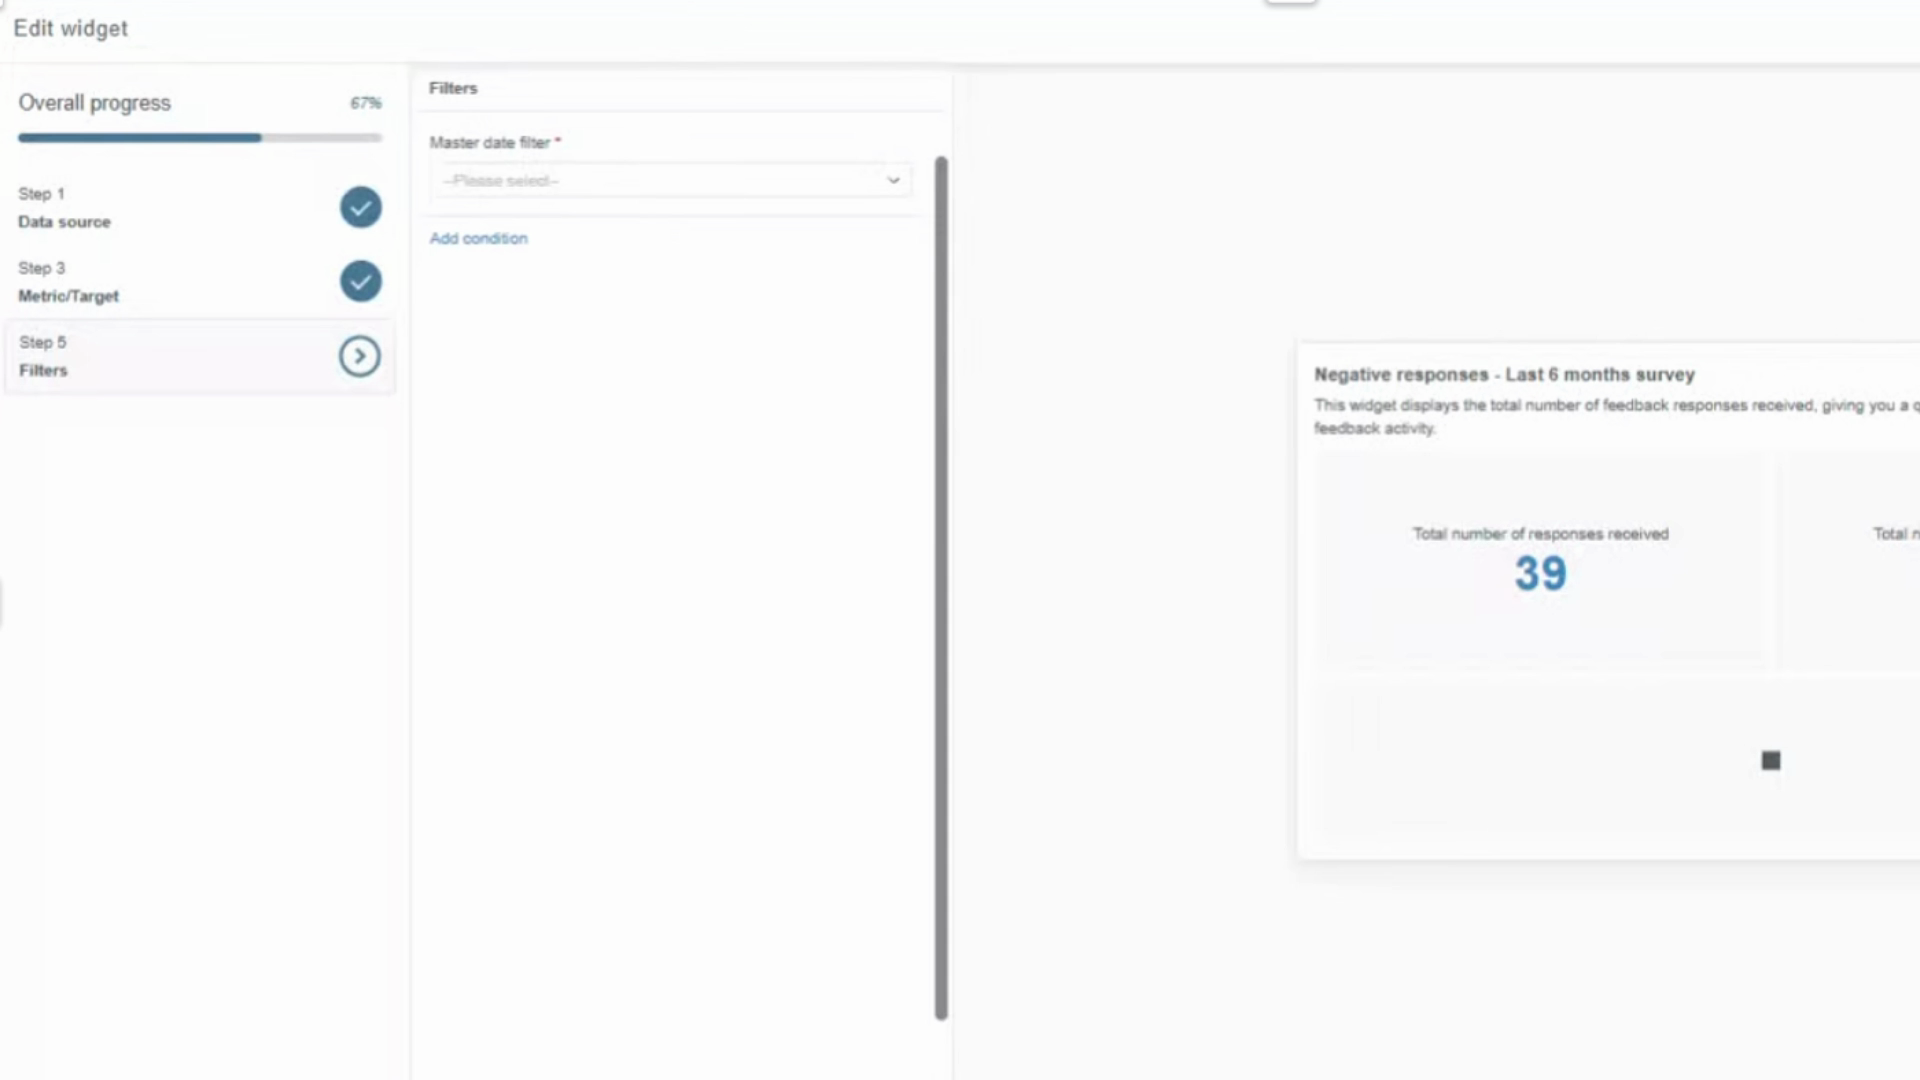
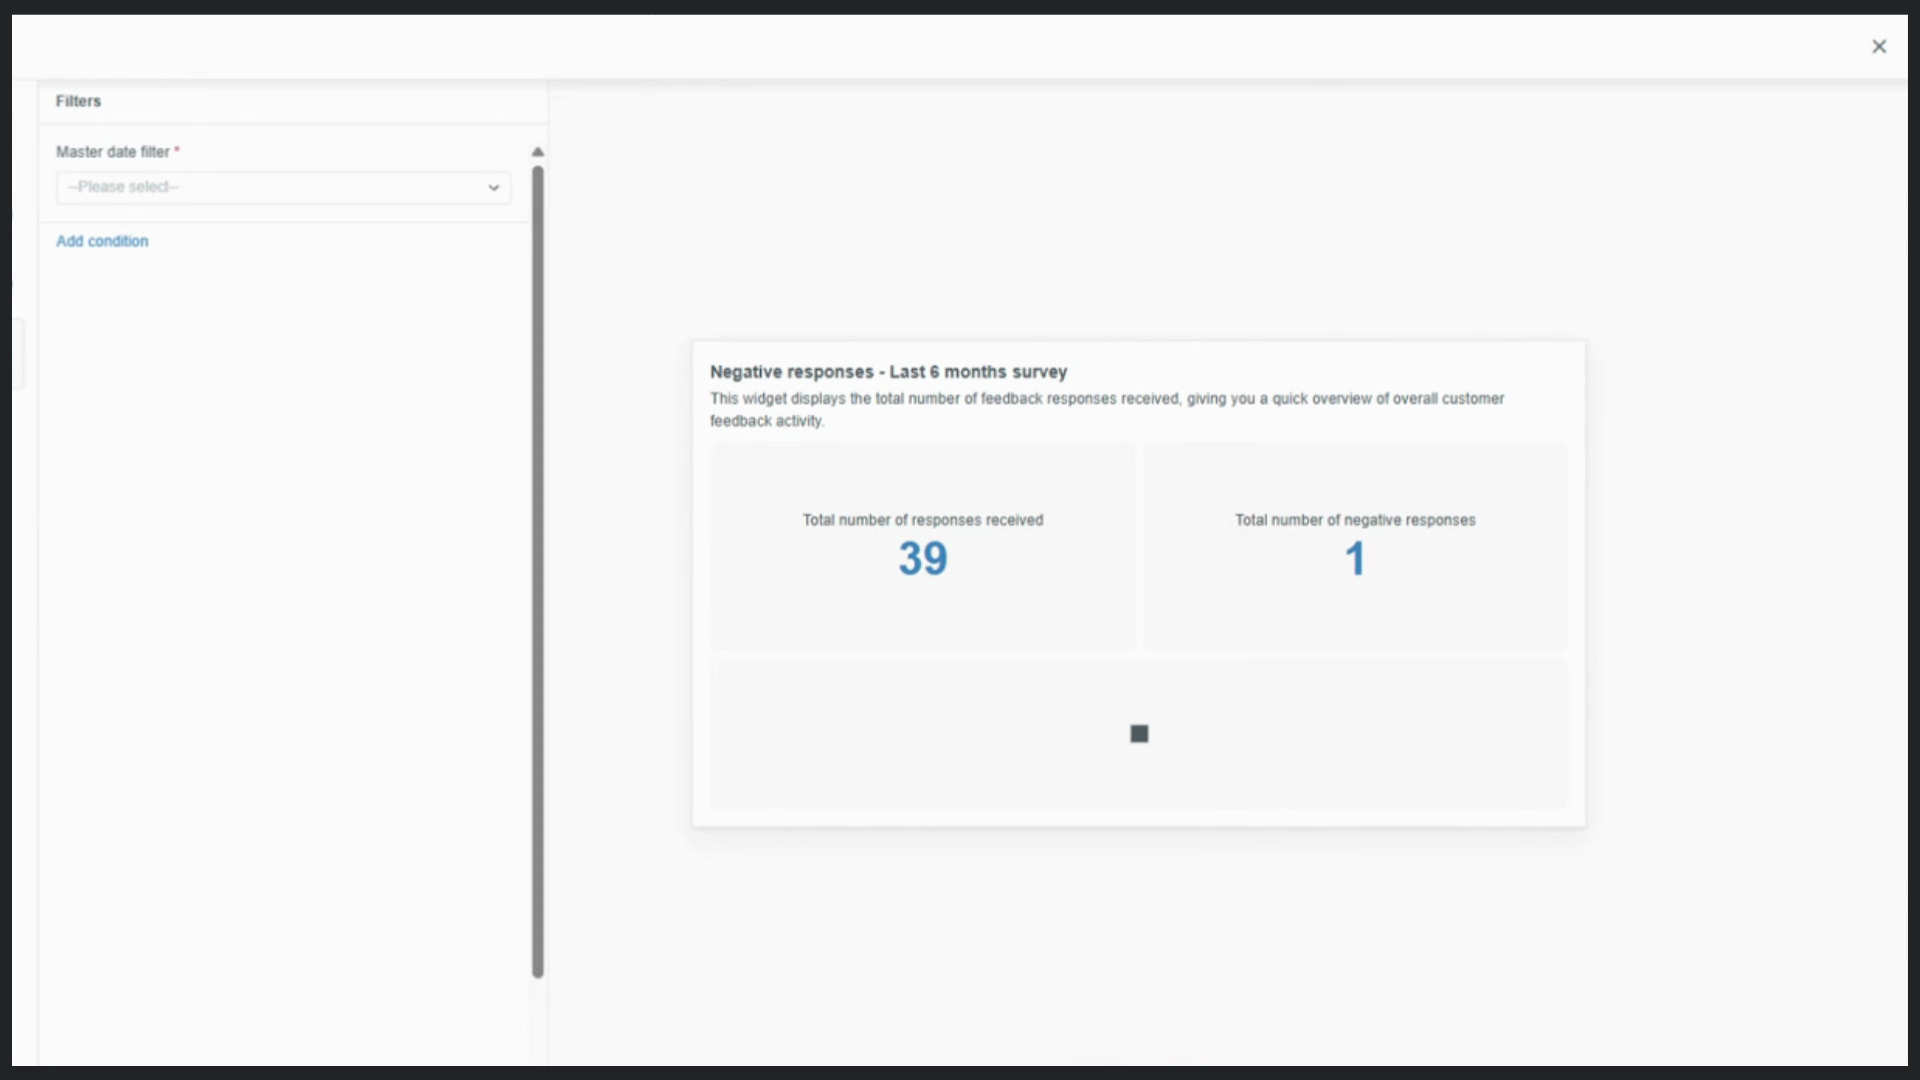
Step 4: Match the filter to the last six months to align your time frames.
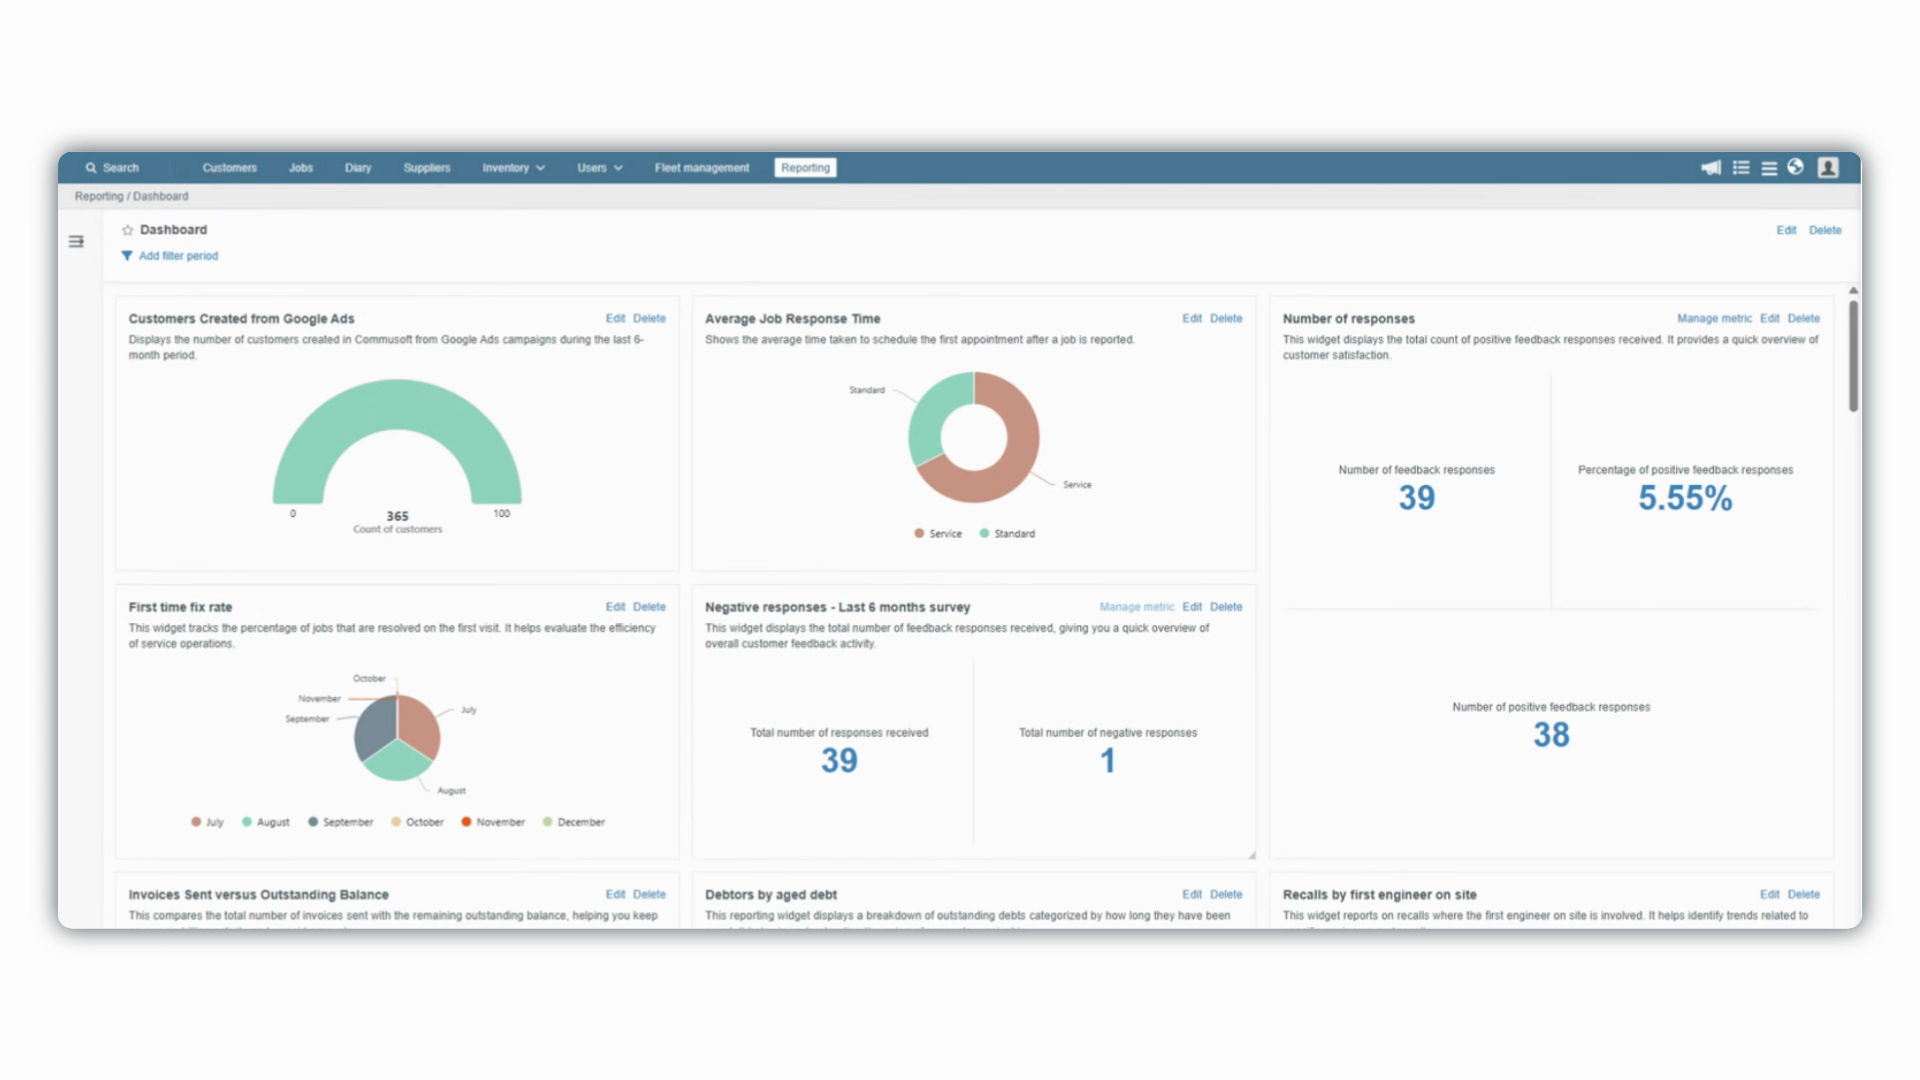
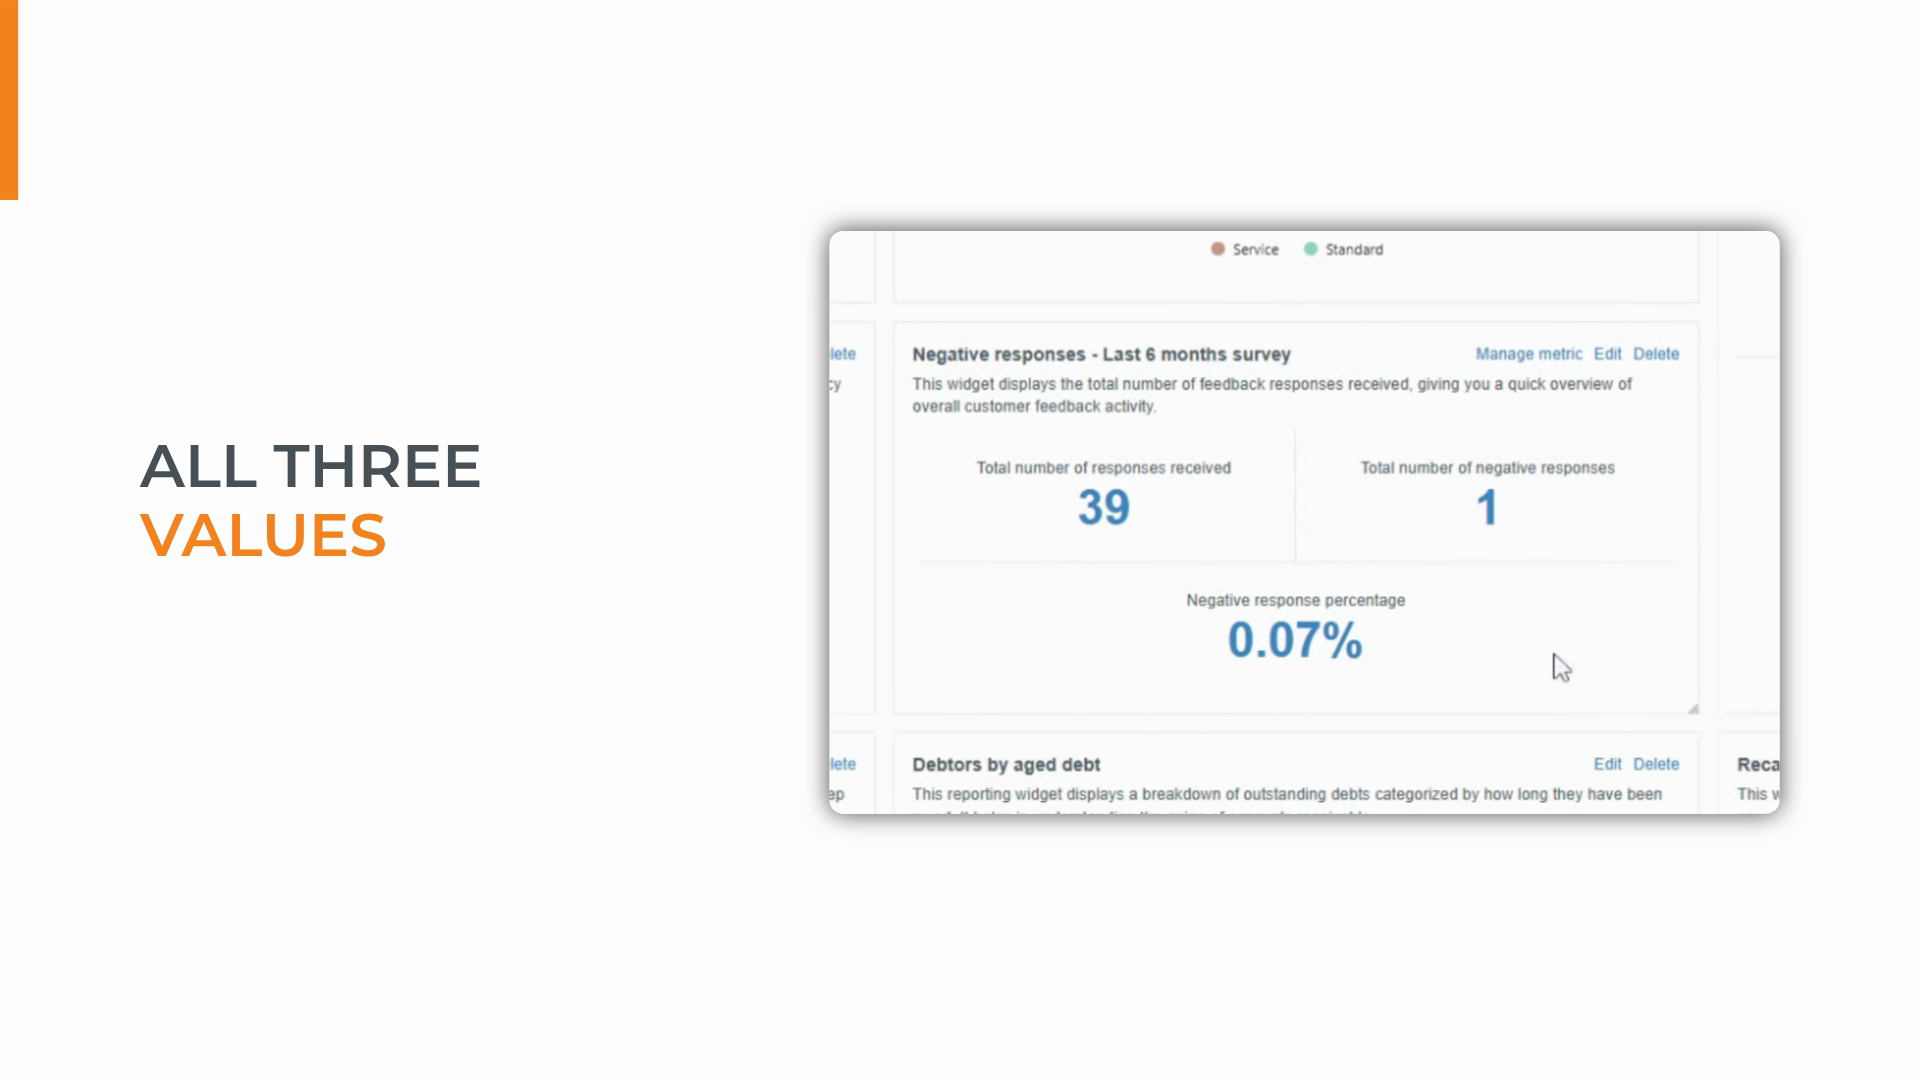
With all three metrics displayed side by side, your widget provides instant clarity—a complete snapshot requiring zero interpretation. Quickly spot issues, monitor trends, and see the impact of improvements at a glance.
Keep your number widgets focused and minimal. Let the data speak for itself—so you and your team can focus on what matters most.
Created on
Did you find this article helpful?