

Key Terms in Analytics: Dashboards, Objects, and Reports
Understanding the core terms of your analytics platform makes it easier to navigate, build reports, and extract value from your data. Here’s a quick guide to the concepts you’ll use every day.
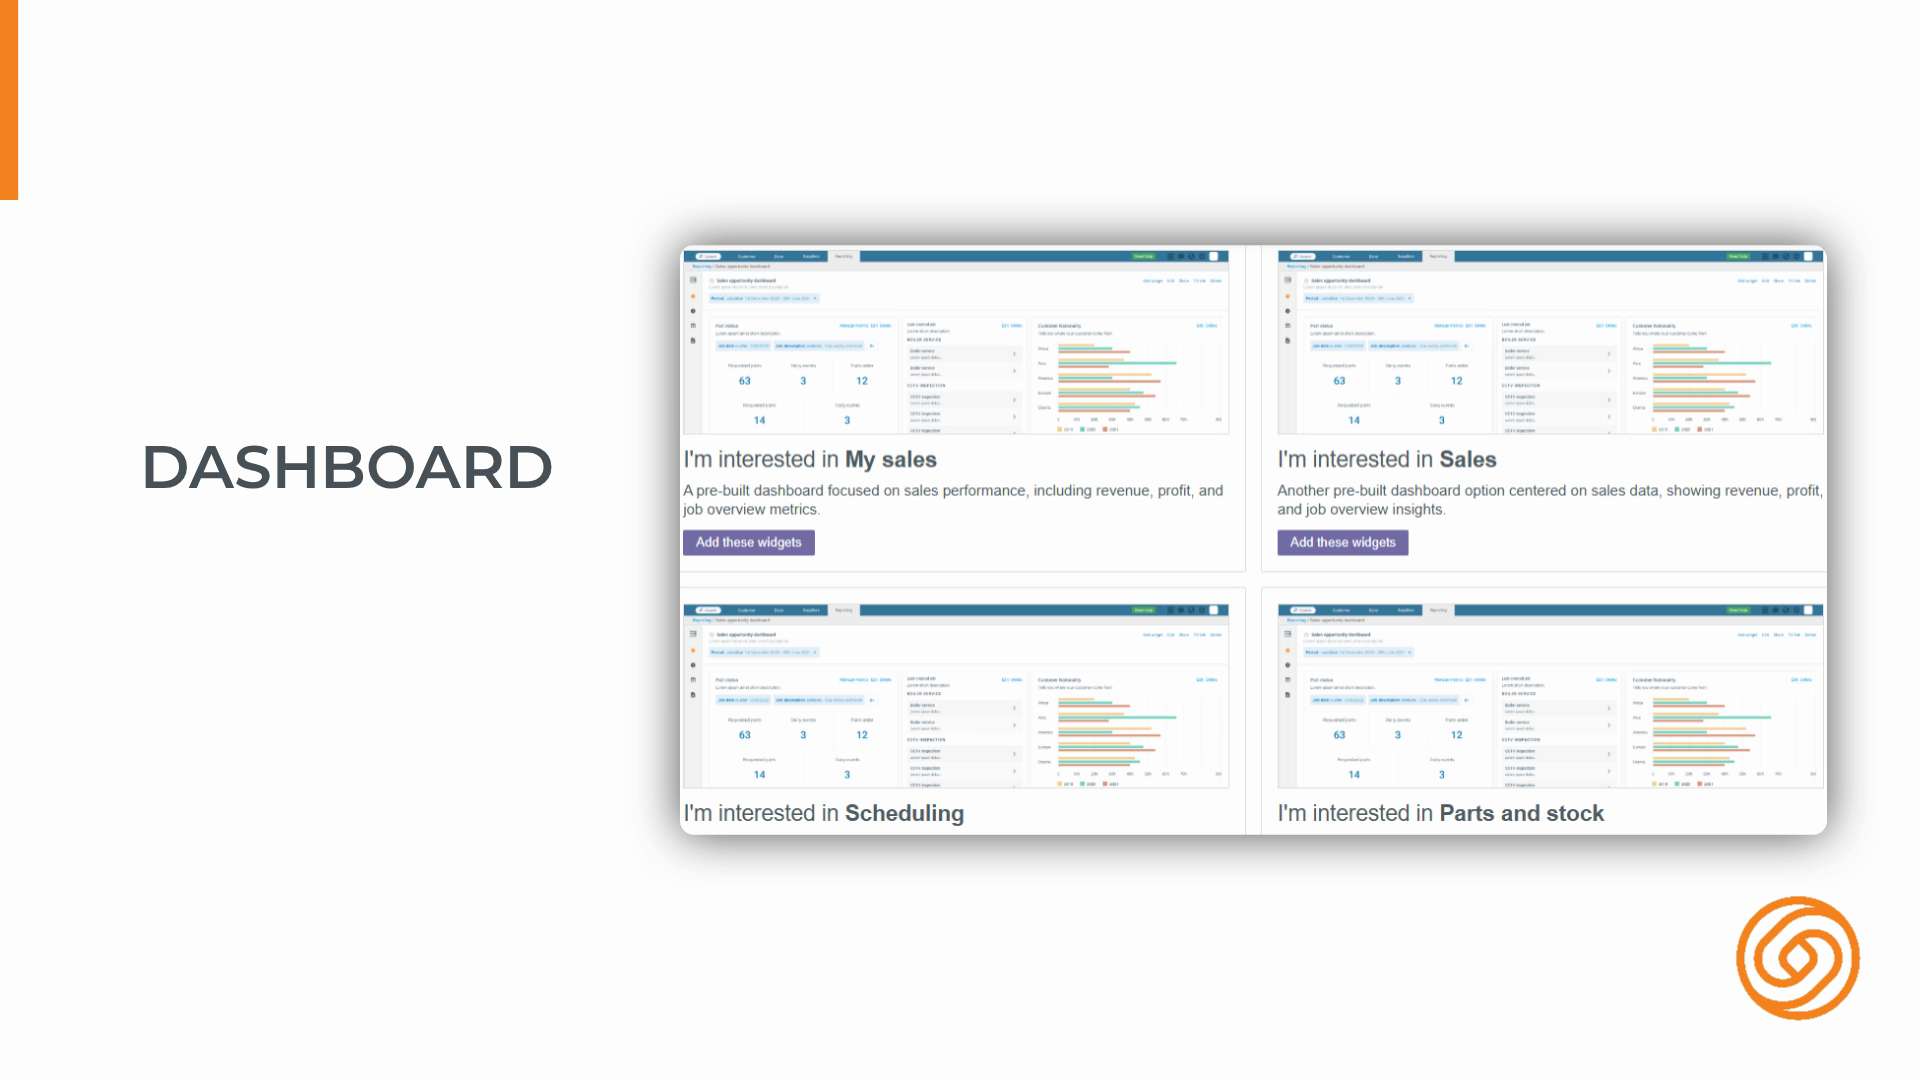
Step 1: Get comfortable with the dashboard—your main workspace where all your data comes together.
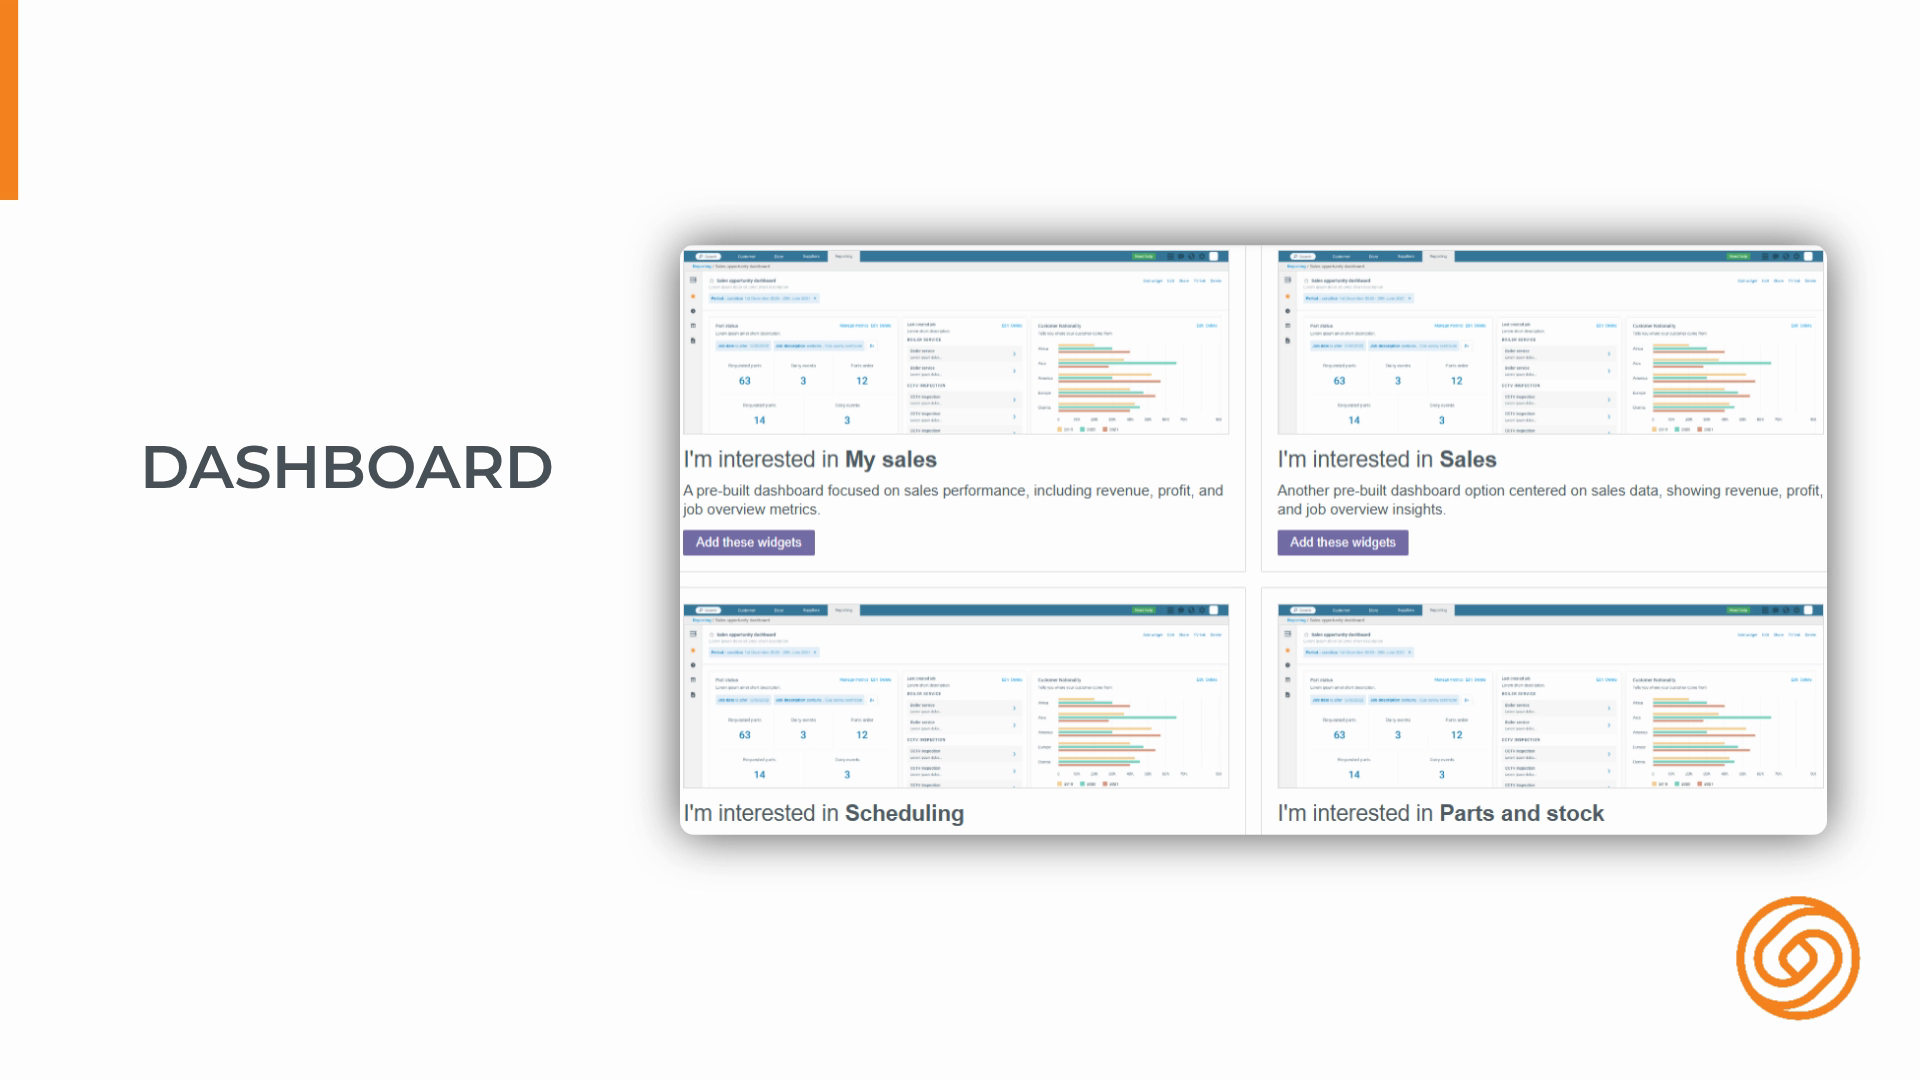
Step 2: Think of the dashboard as a canvas. It’s where you’ll create, view, and manage everything, from widgets to tabular reports.
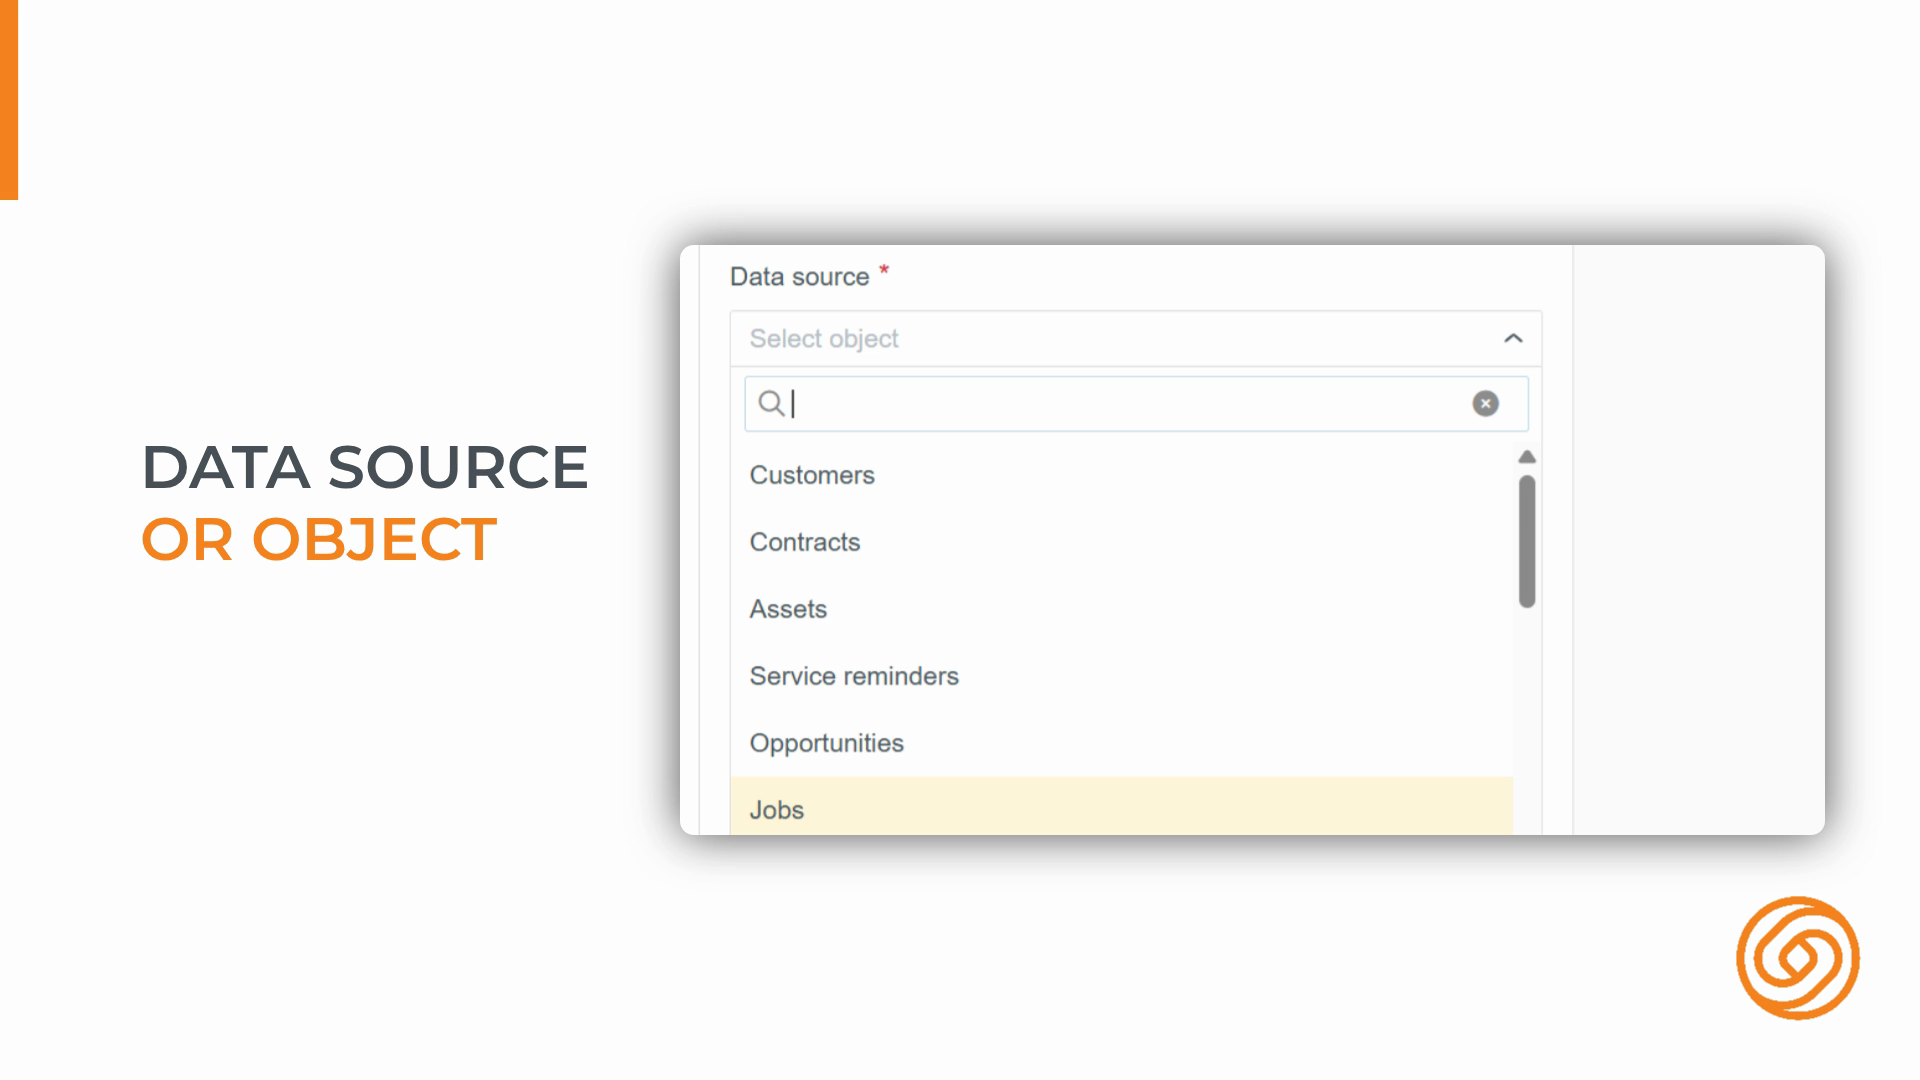
Step 3: Learn what an object is. Objects are the key data entities—like jobs, customers, or invoices—that power your analytics.
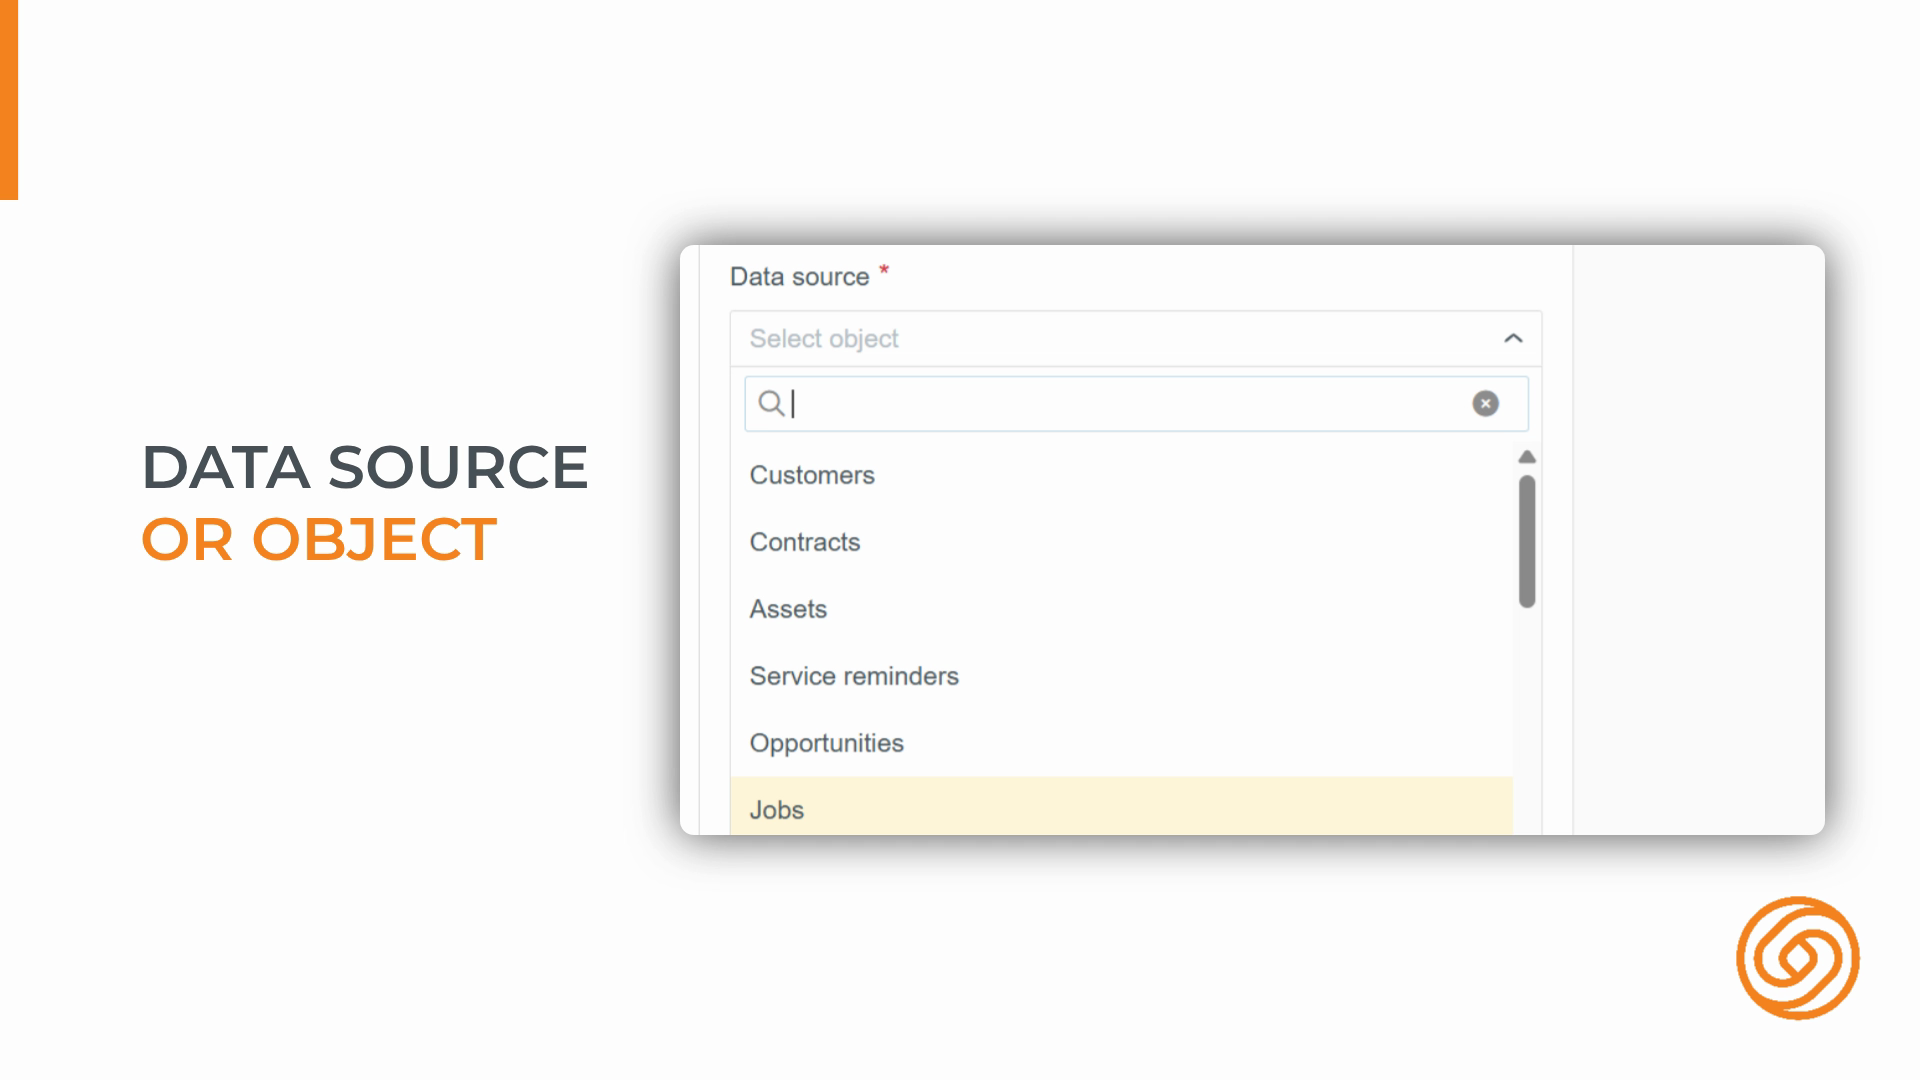
Step 4: The object you pick sets what fields and data you can use in your widgets and reports.
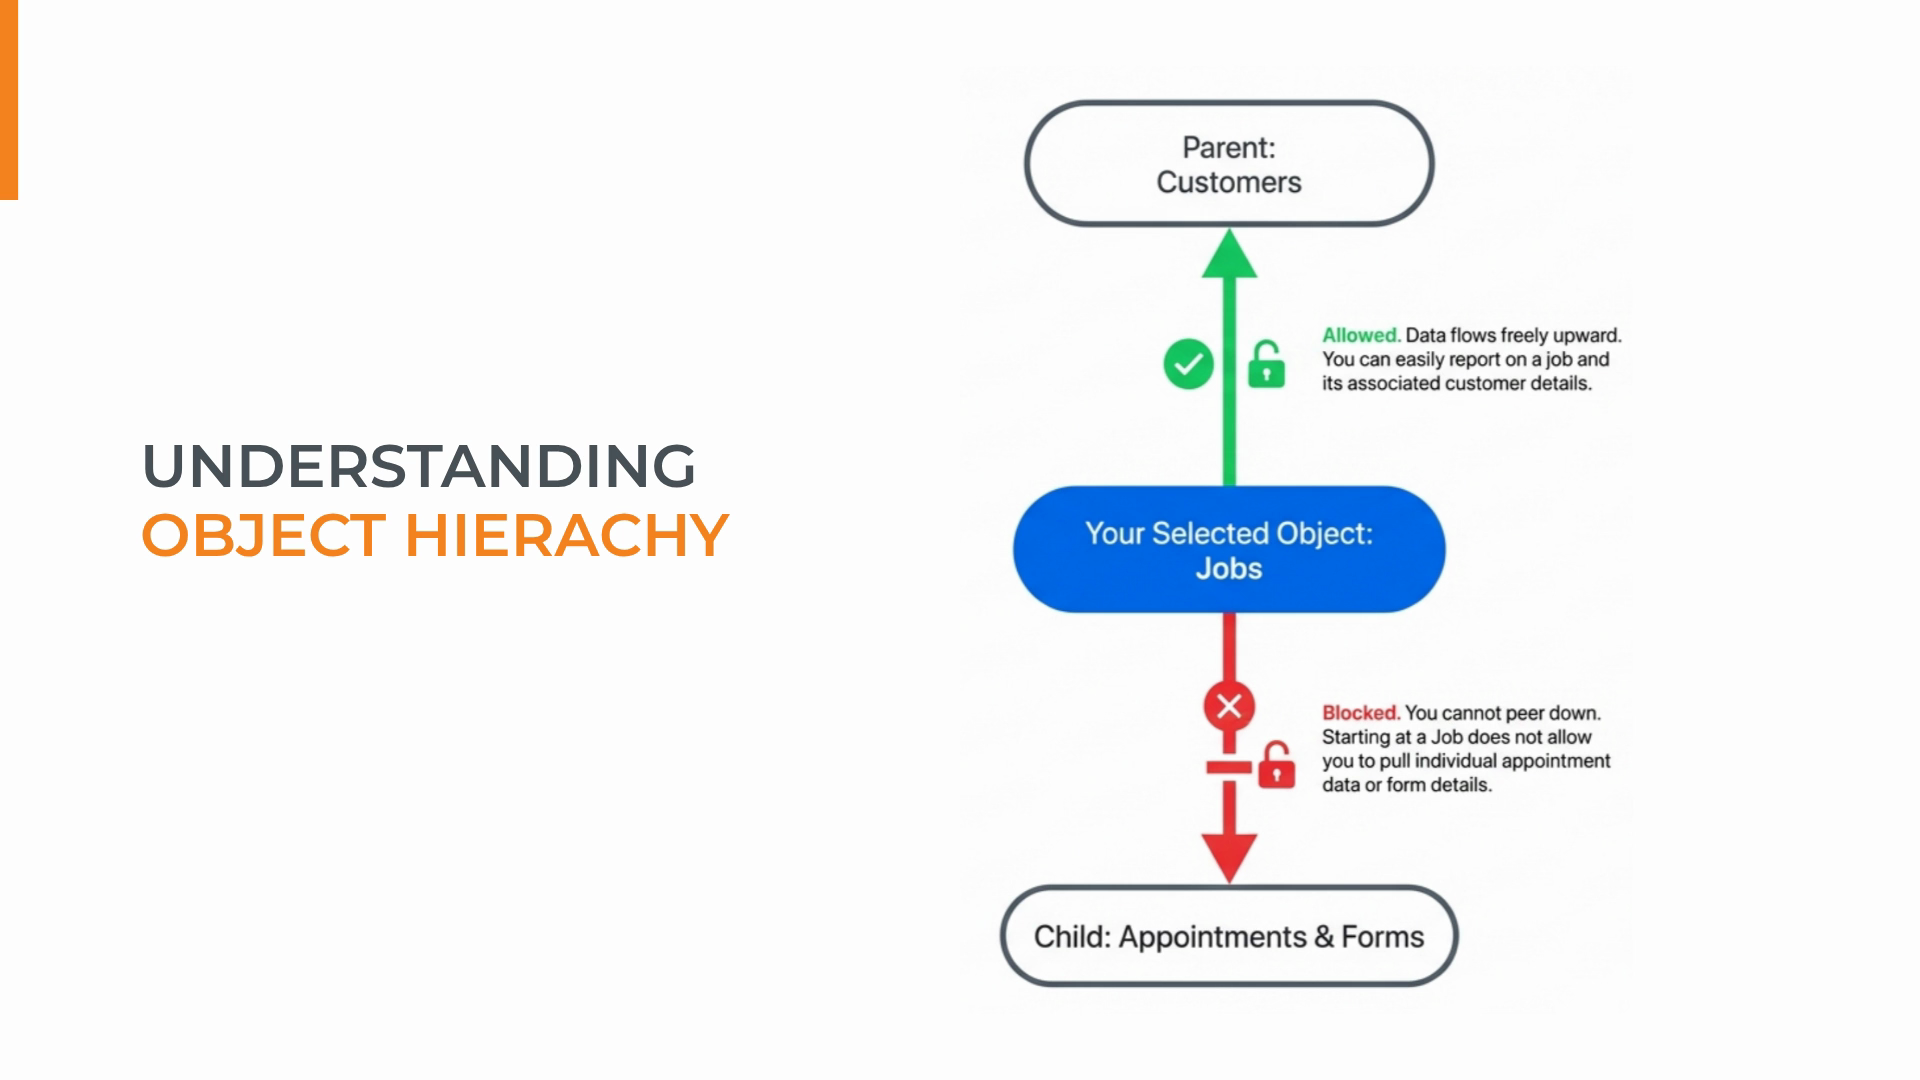
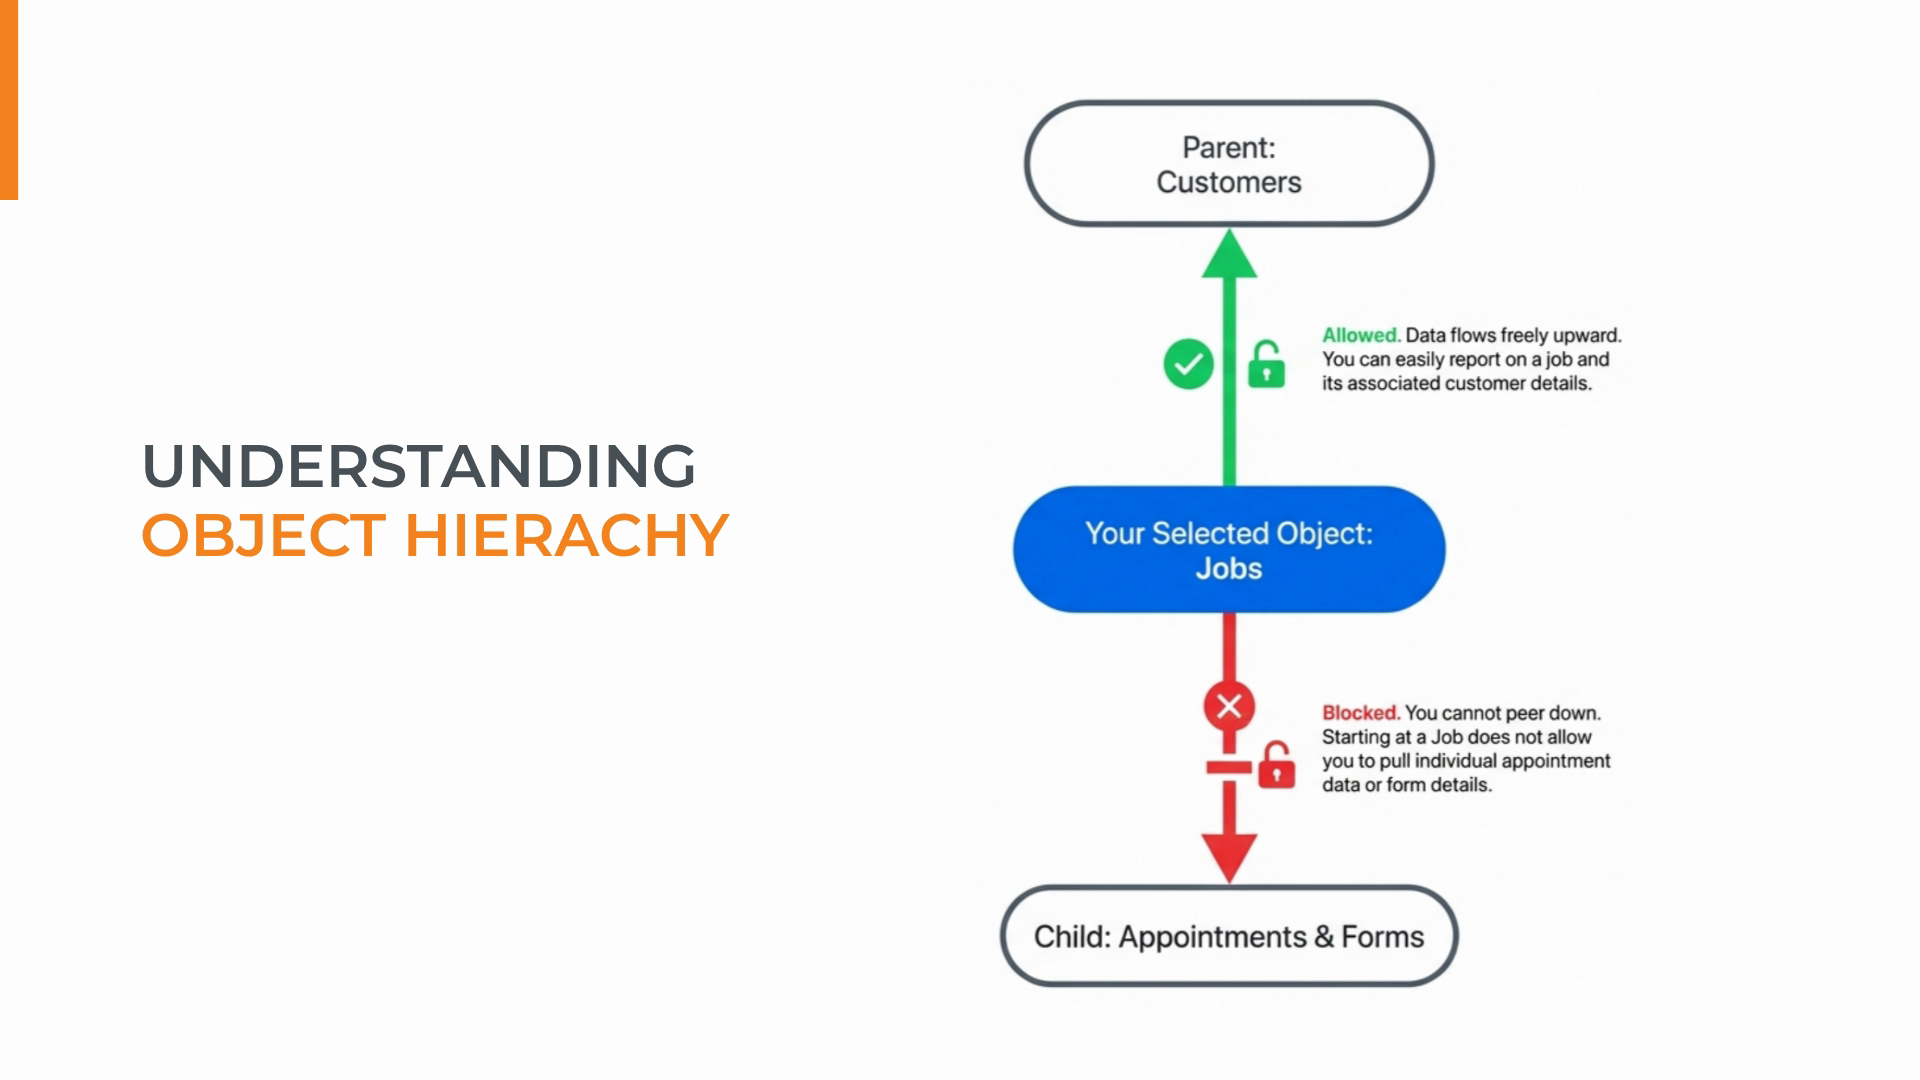
Step 5: Know how objects relate. There’s a hierarchy—some objects are parents, some are children—which affects your reporting options.
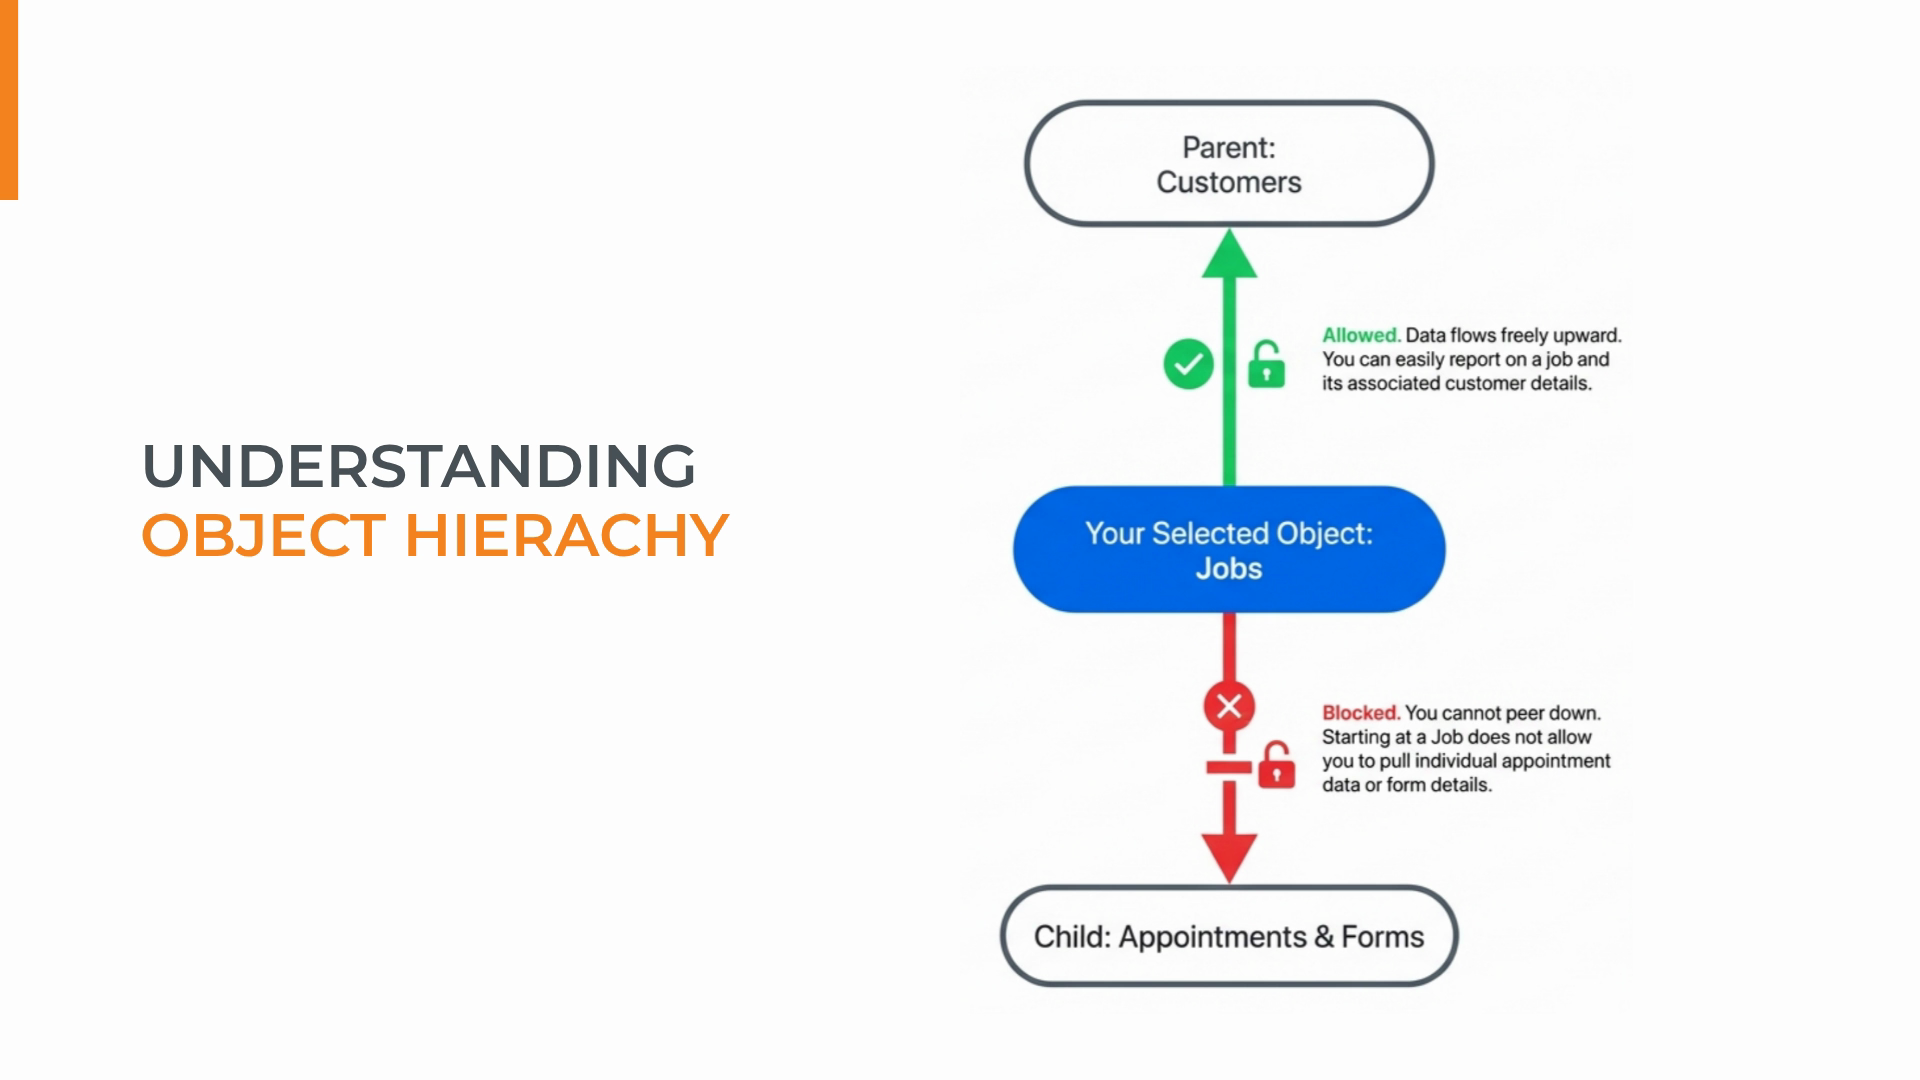
Step 6: For example, a customer is a parent of a job, and a job is a parent of a form.
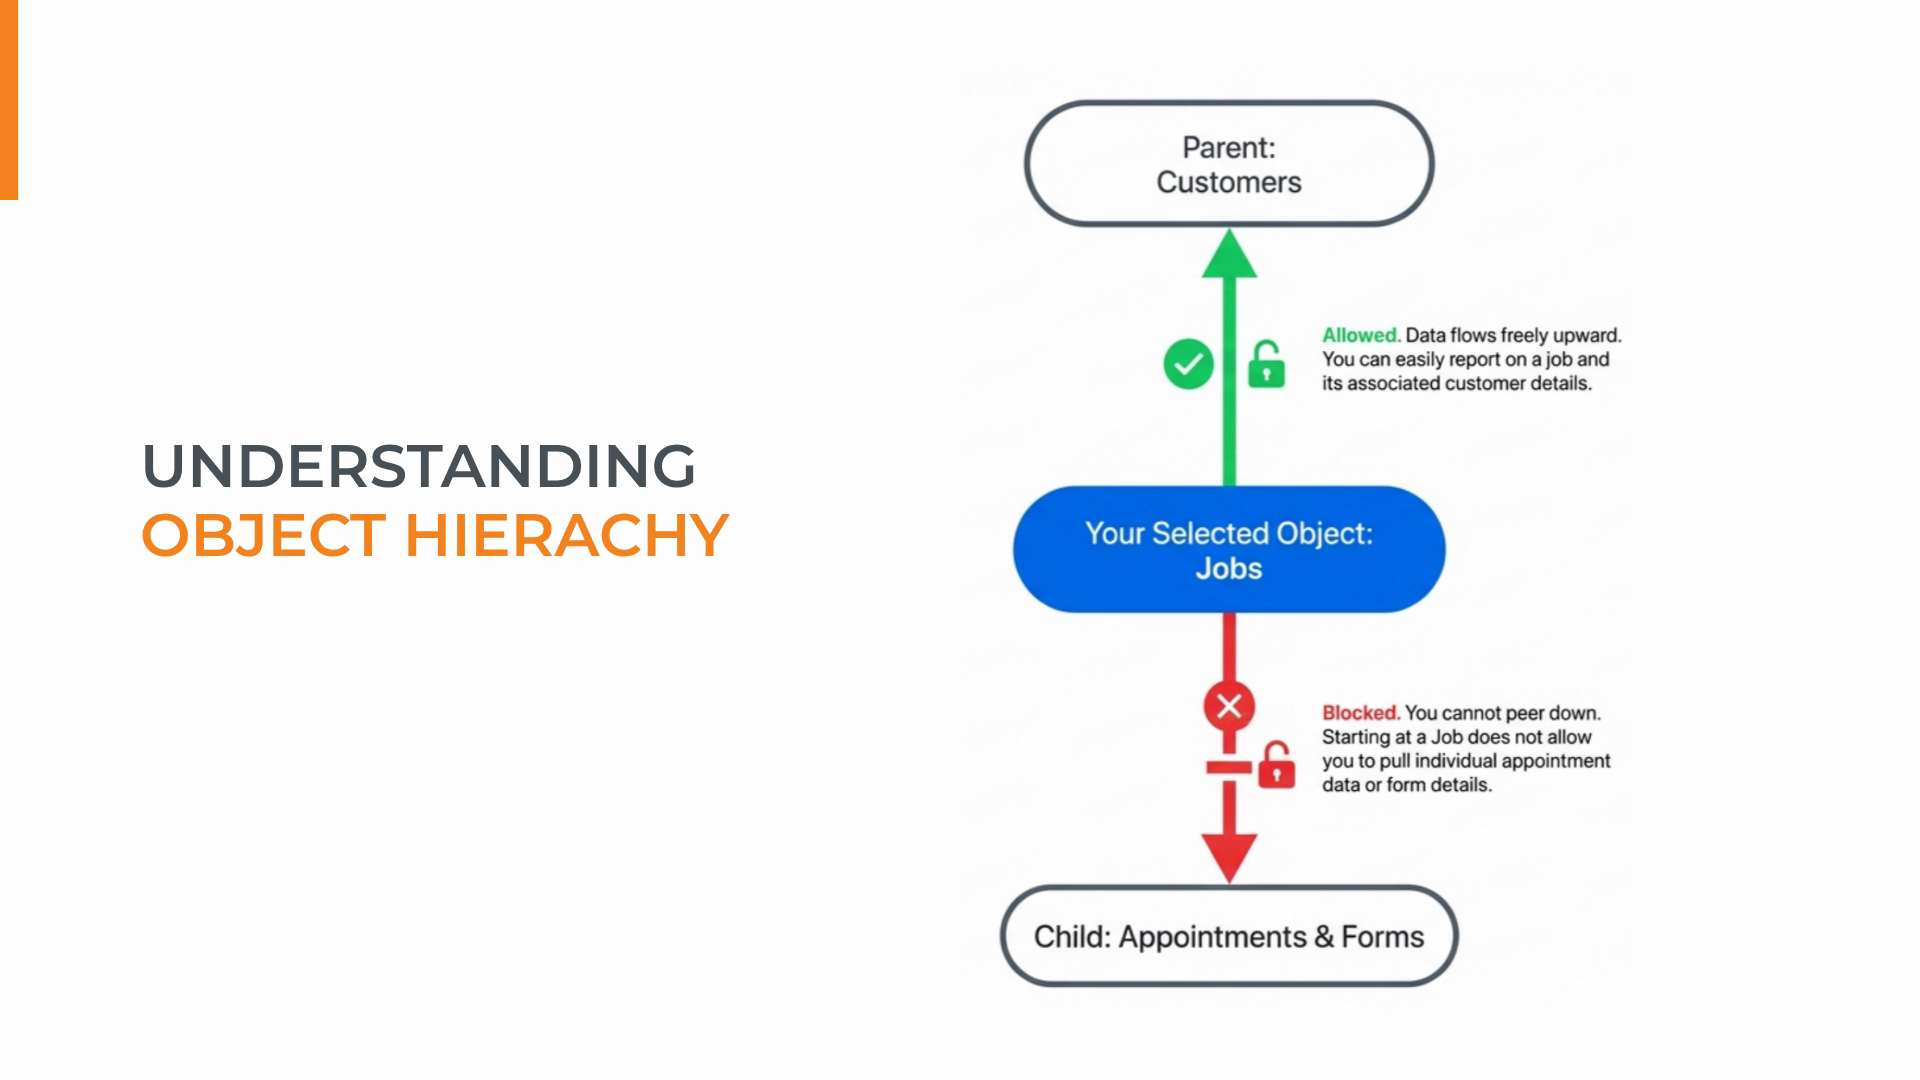
Step 7: When creating a widget or report, you can pull data from your chosen object and its parents—but not from its children.
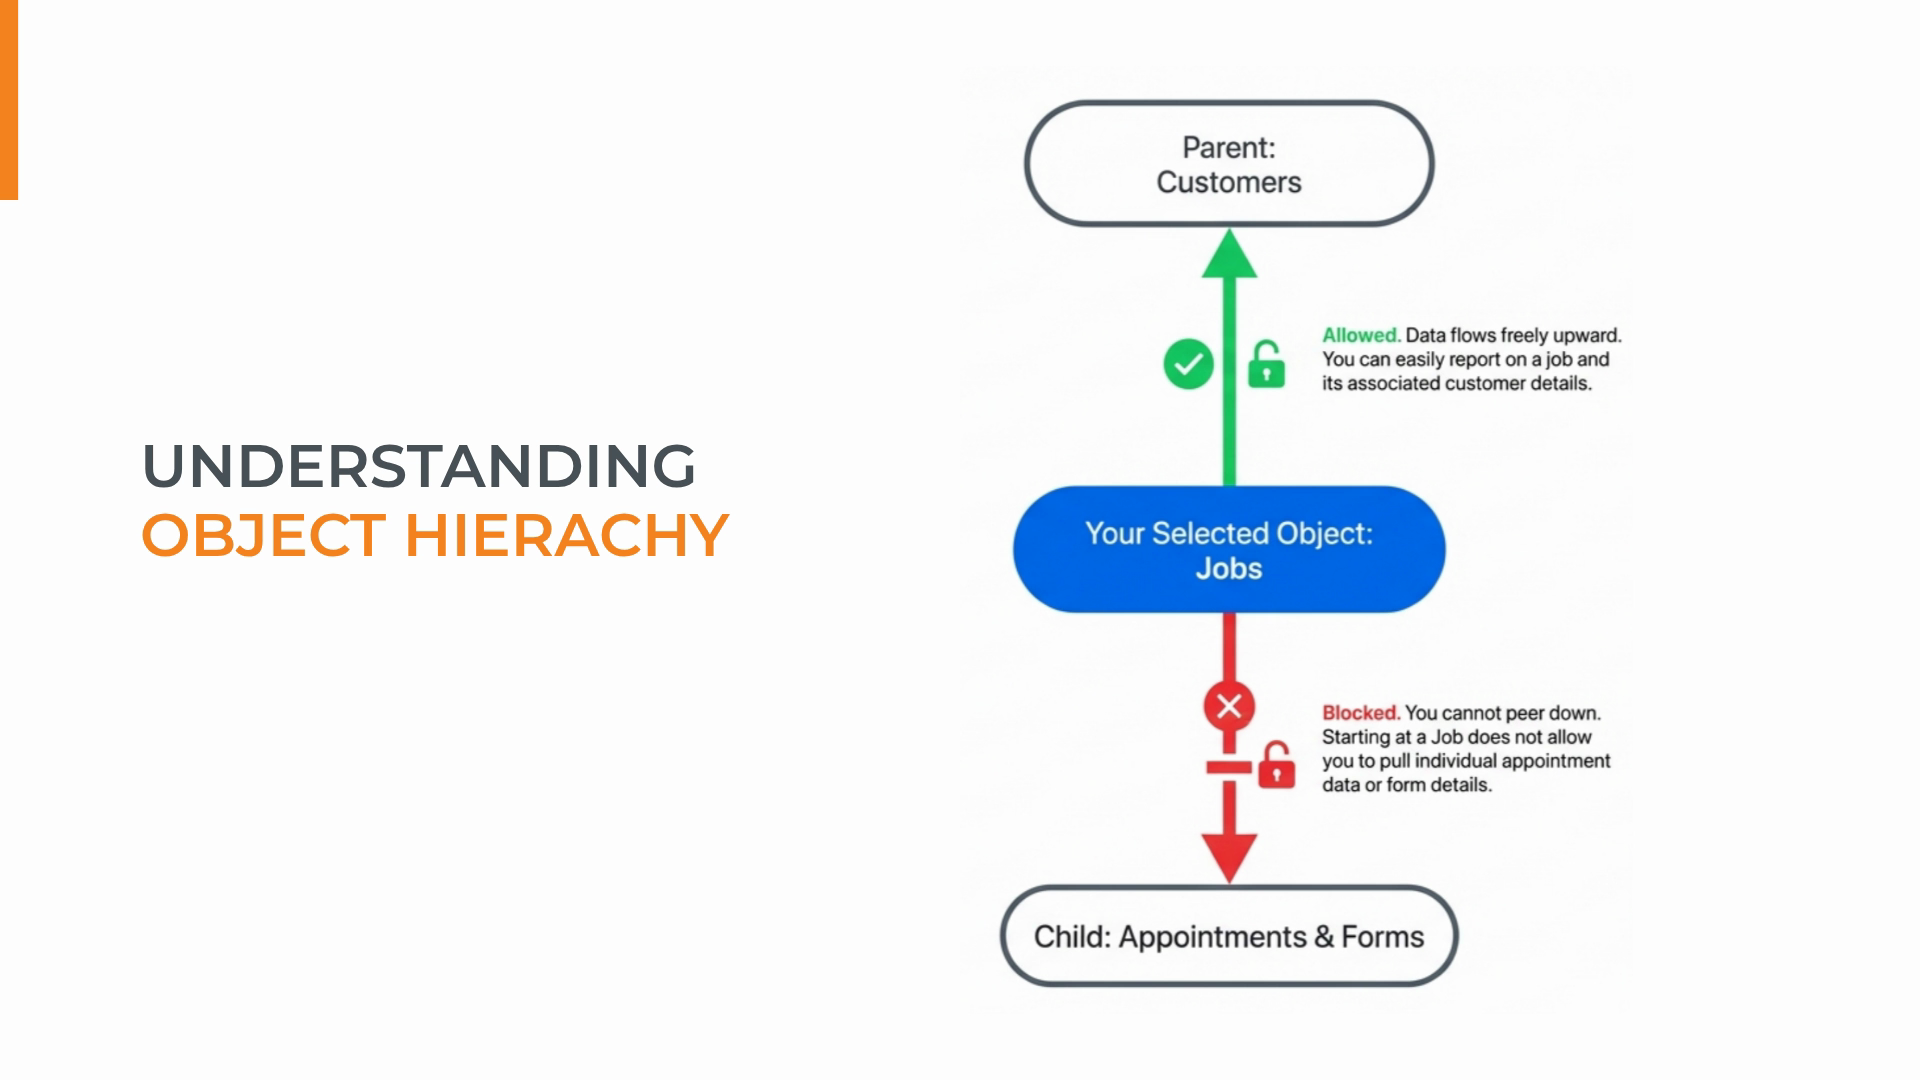
Step 8: To report on detailed data (like individual jobs), start with the lowest-level object you need.
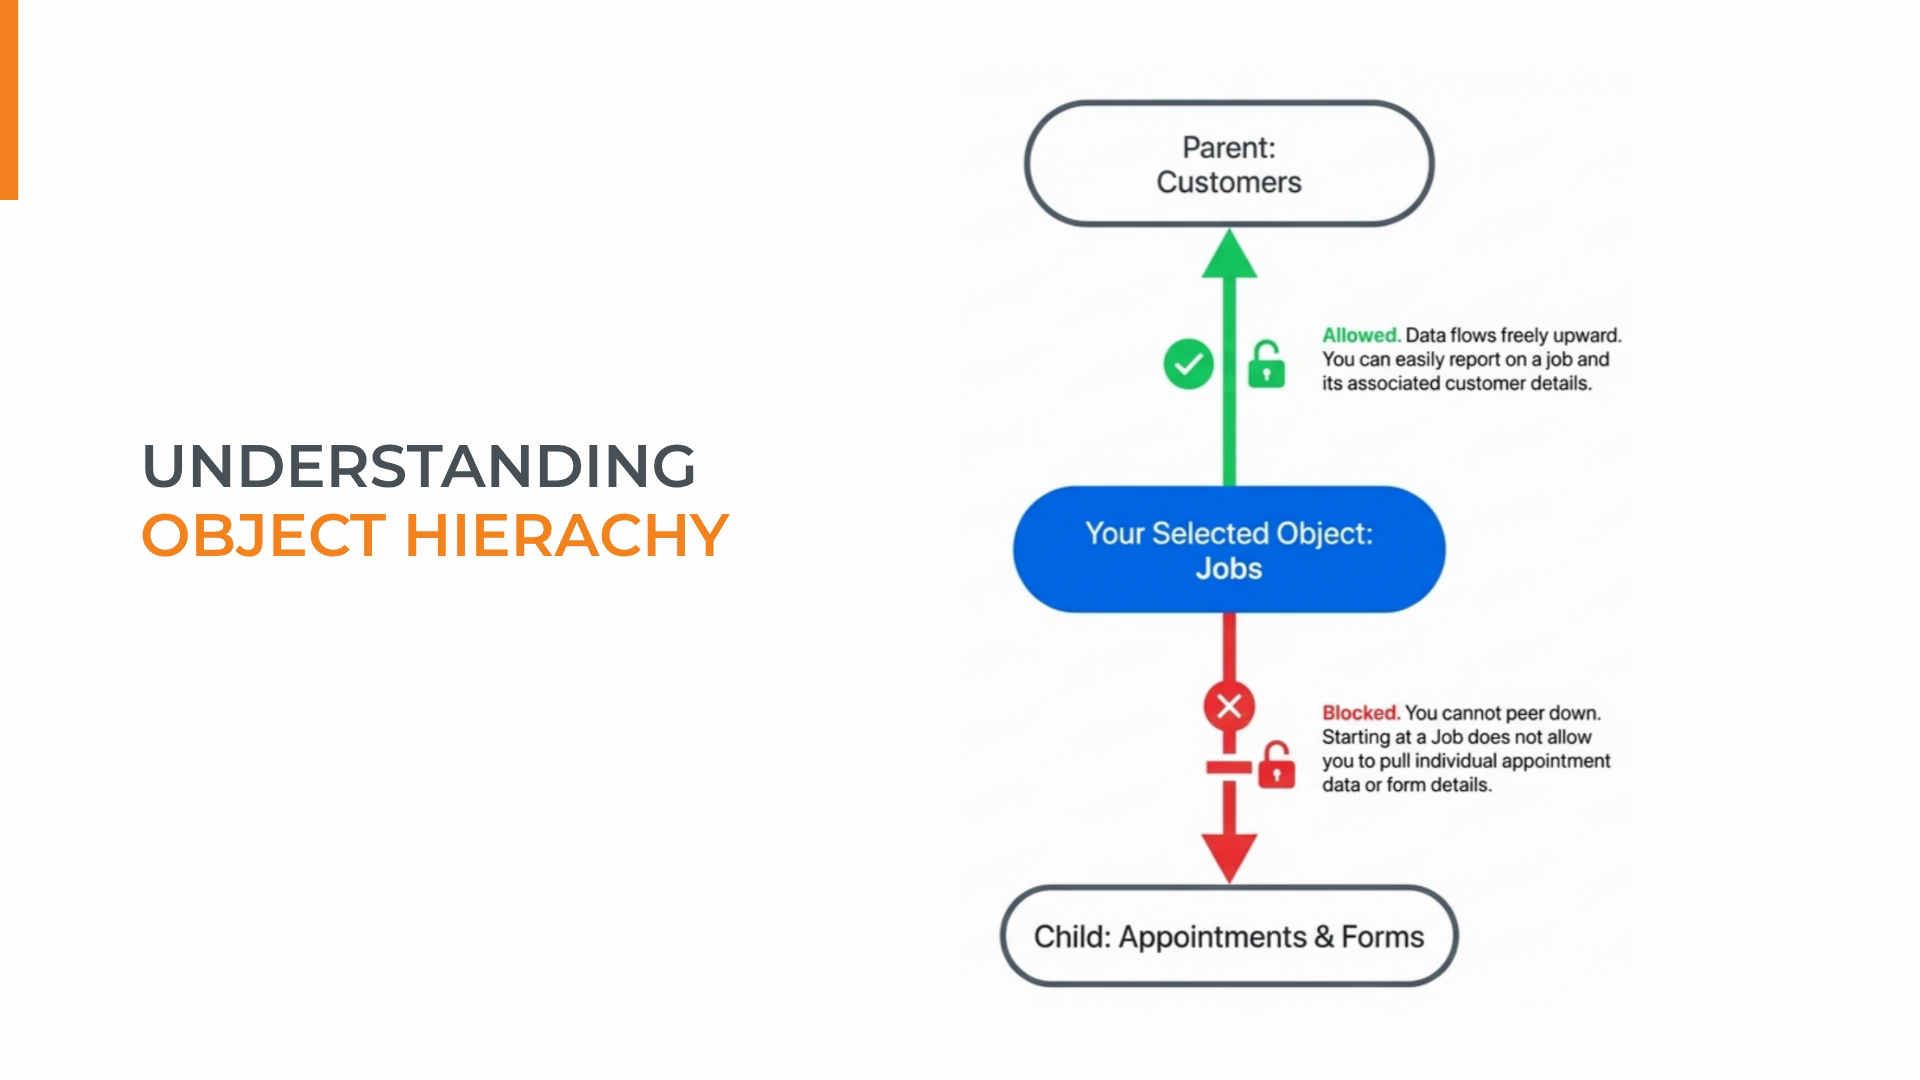
Step 9: Starting at the right level ensures all higher-level data remains available for your analysis.
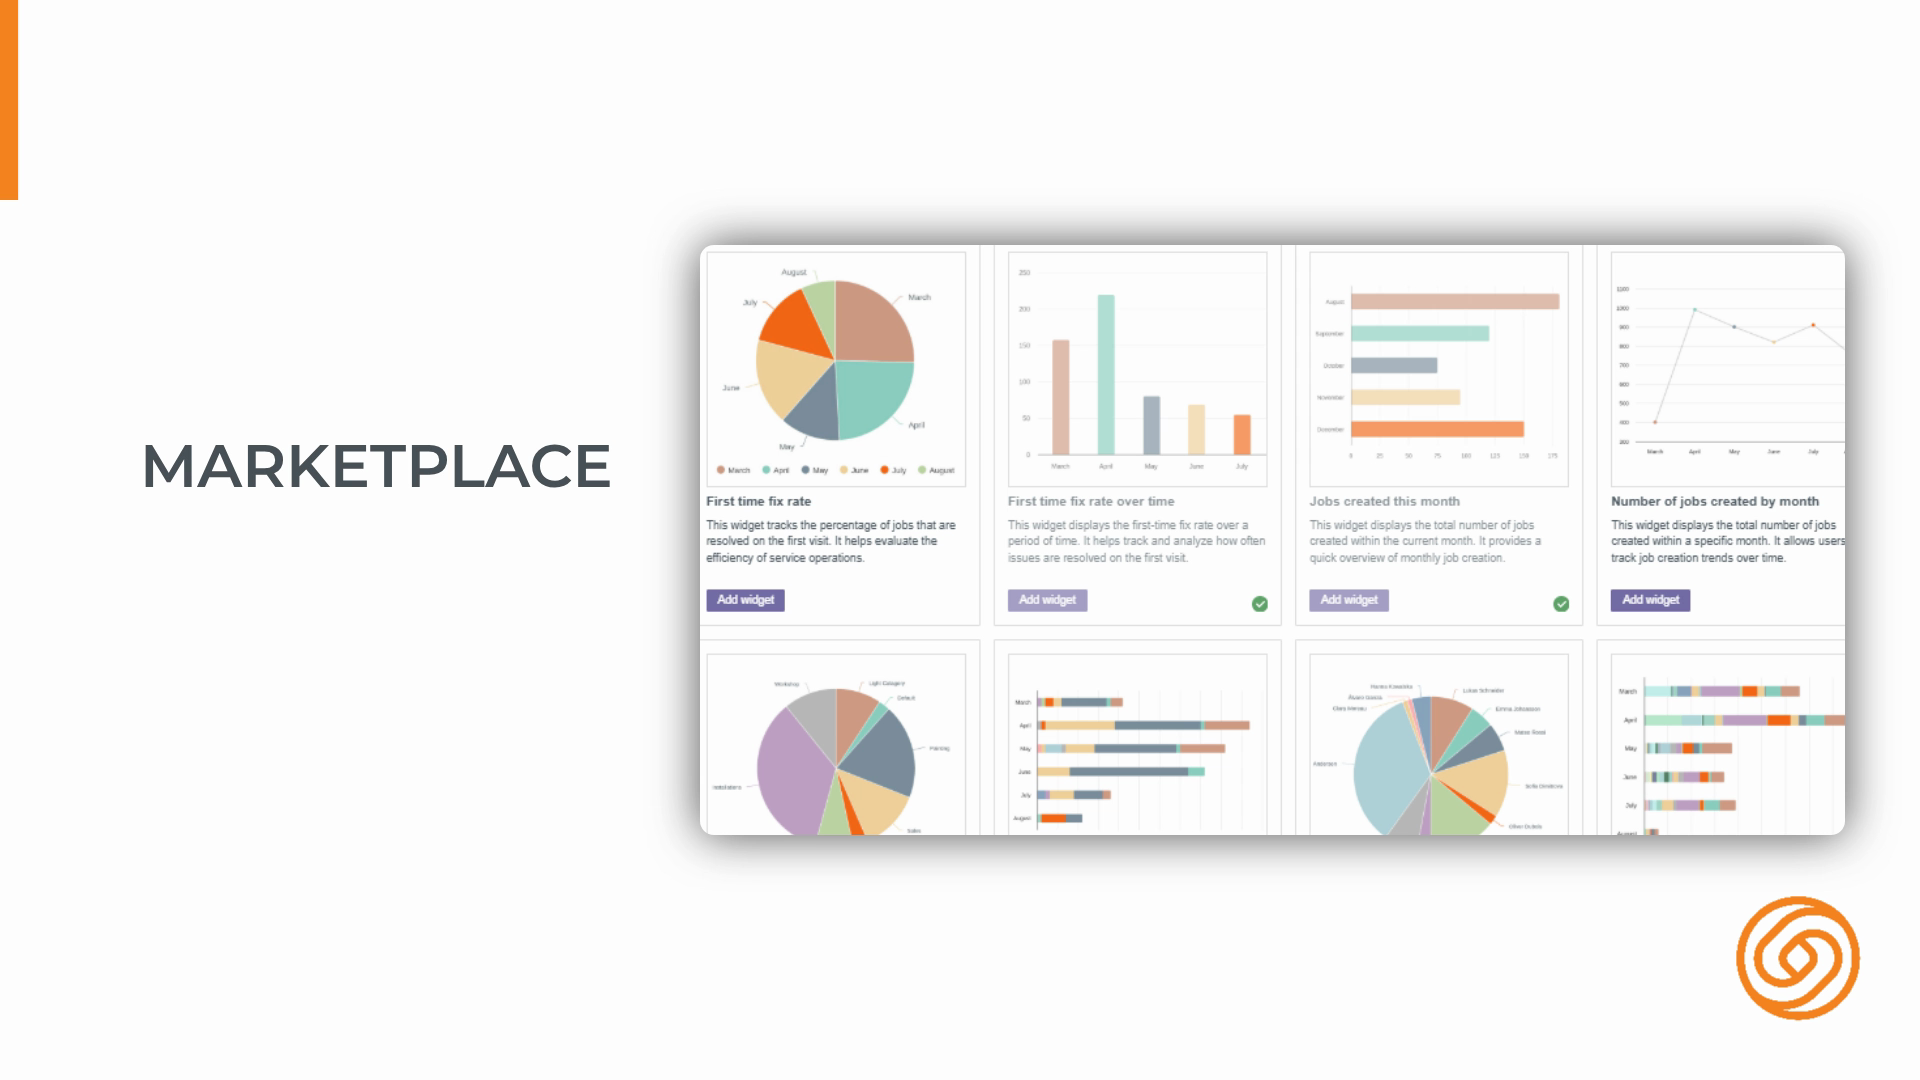
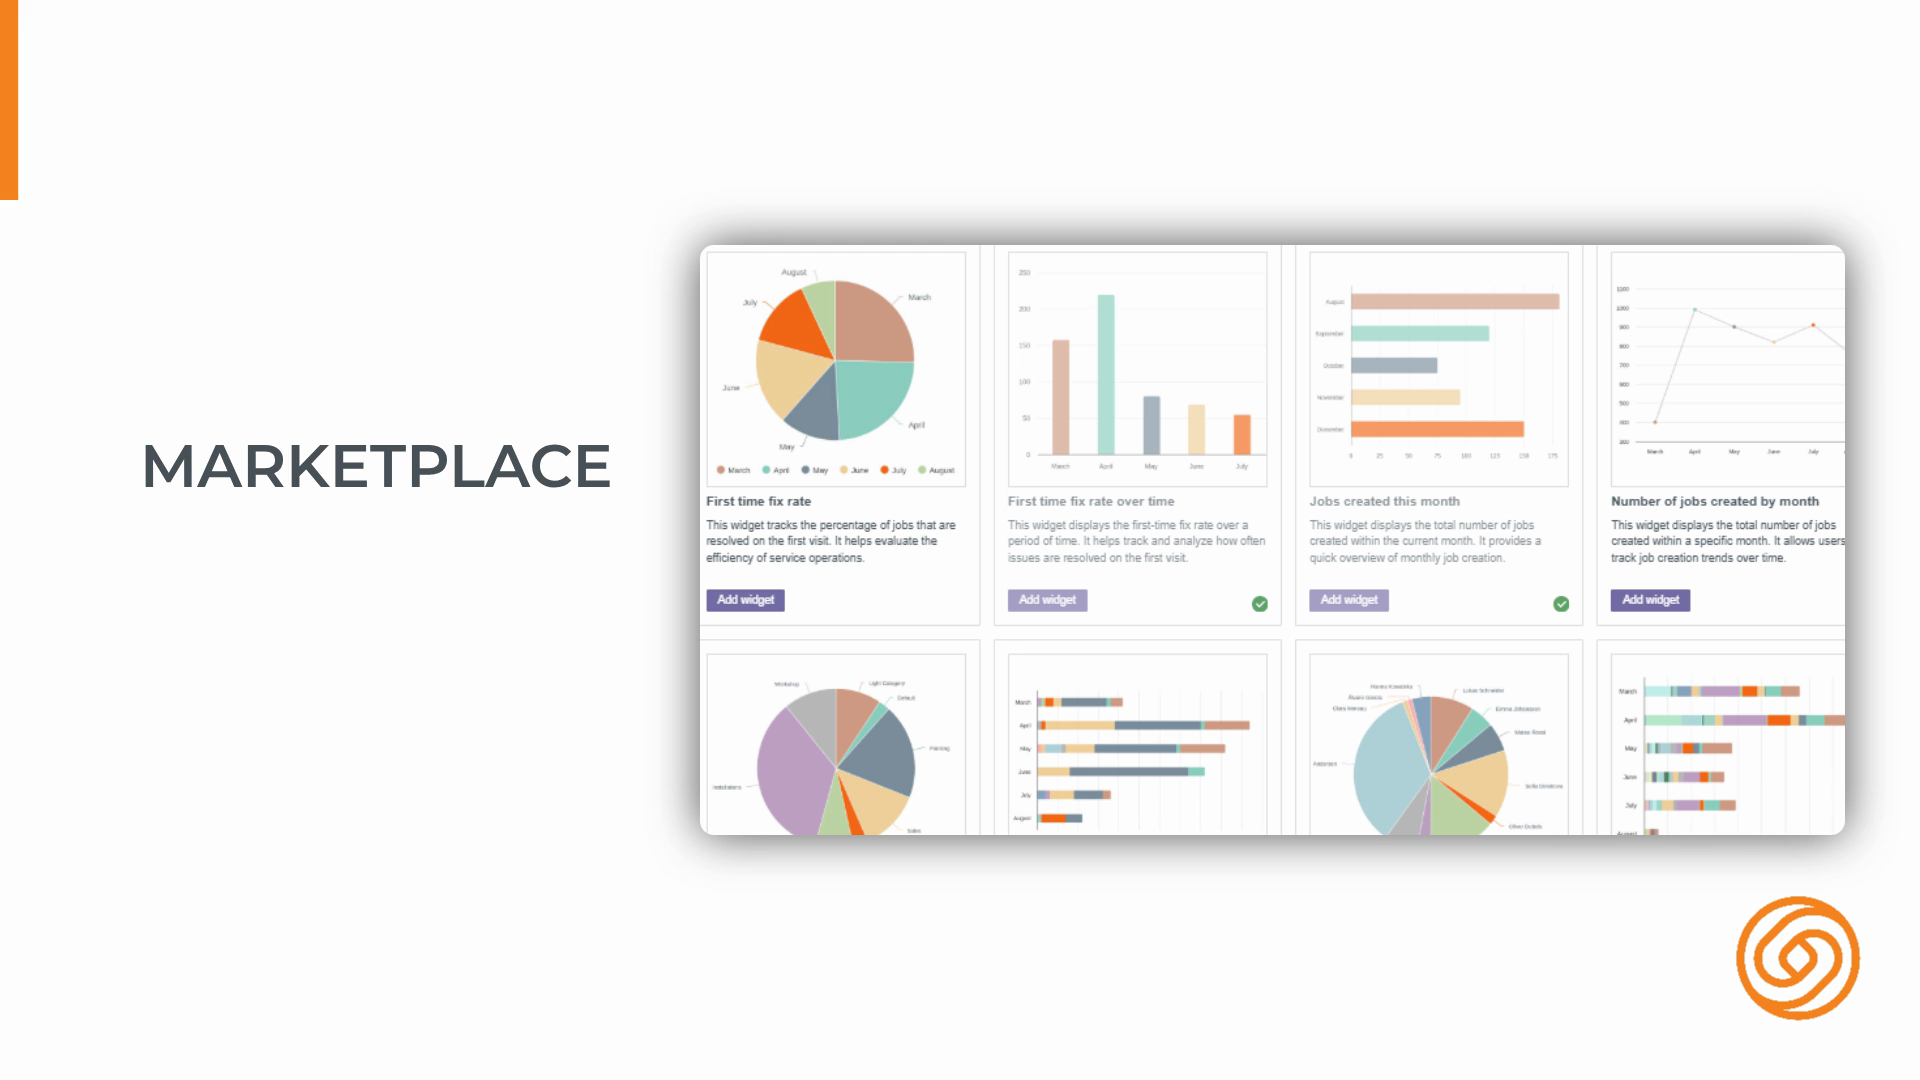
Step 10: Know the two content marketplaces—one for widgets, one for tabular reports. Both let you browse and add prebuilt content instantly.
Step 11: Browse, preview, and add ready-made widgets or reports to your account with a click.
Step 12: Use your personal dashboard as a private space for the widgets and insights that matter most to you.
Step 13: Remember: your personal dashboard is visible only to you. Customize it without affecting shared dashboards.
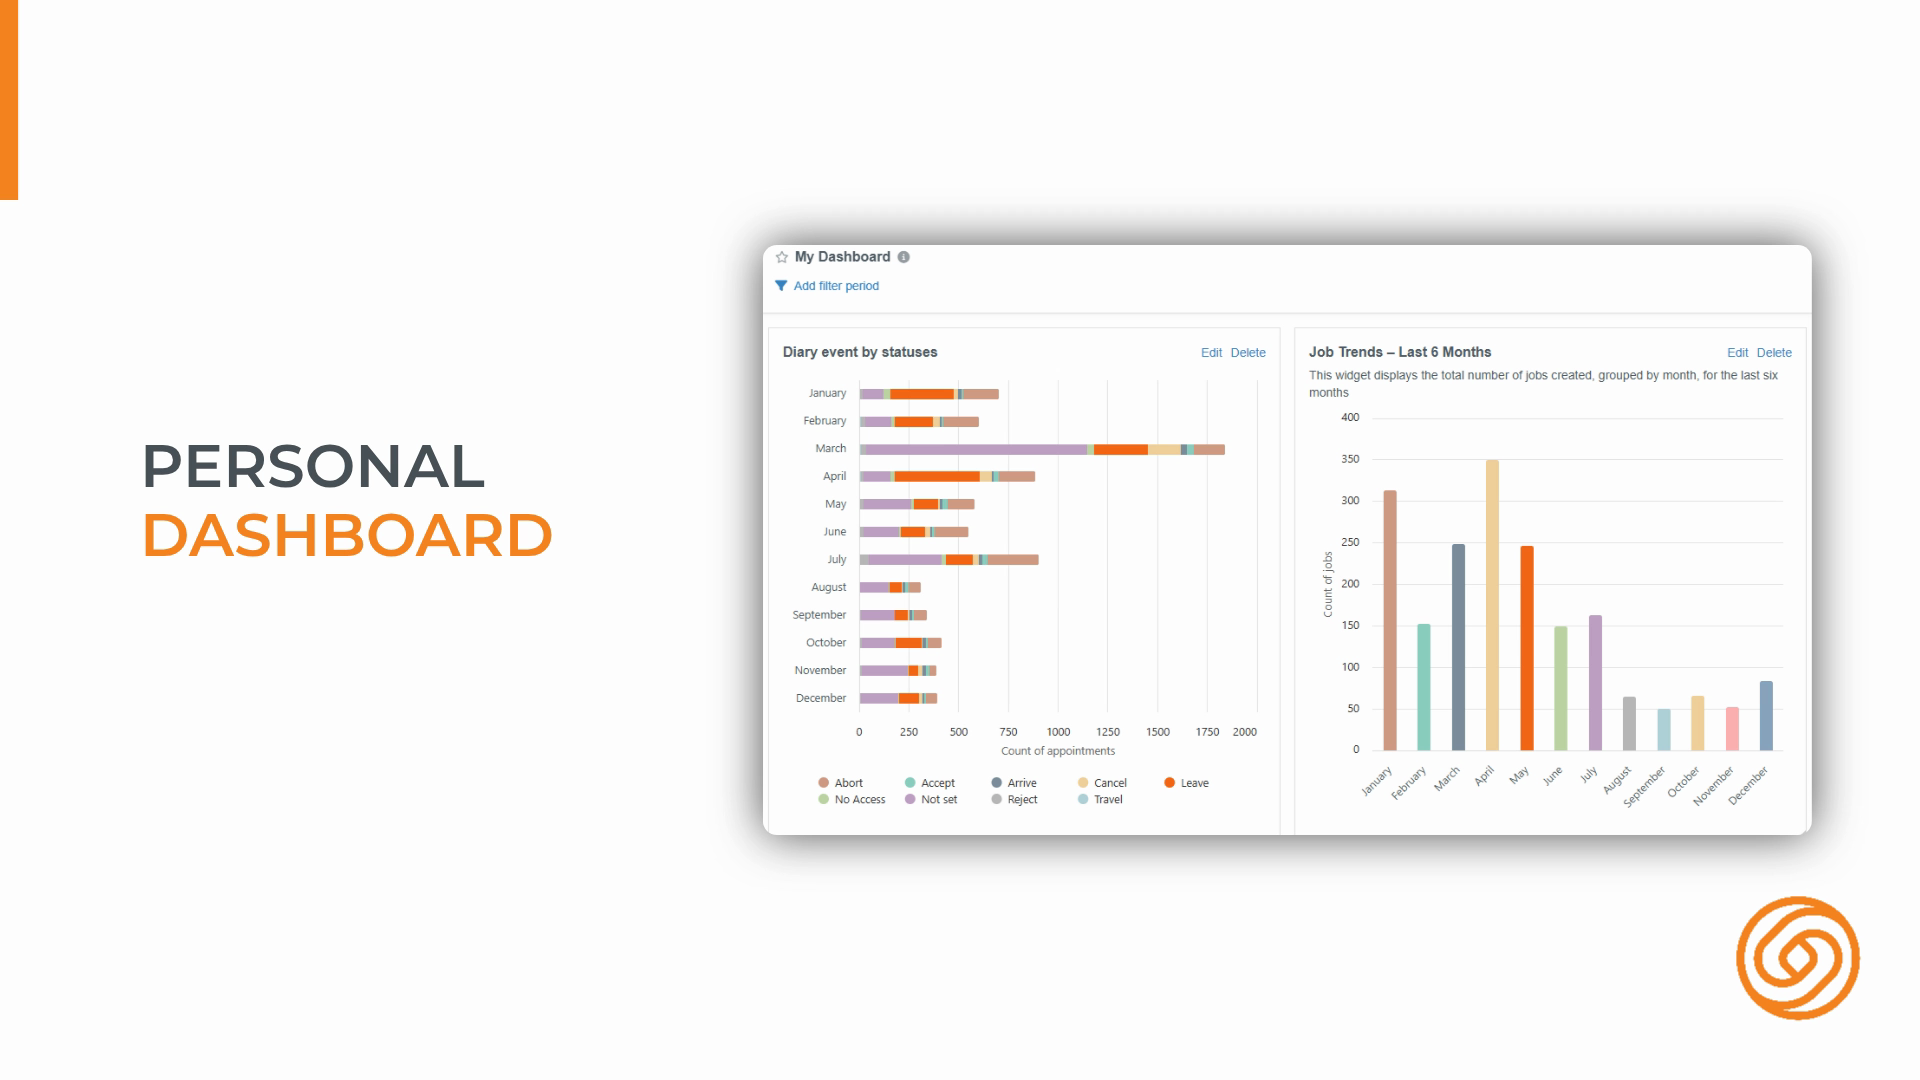
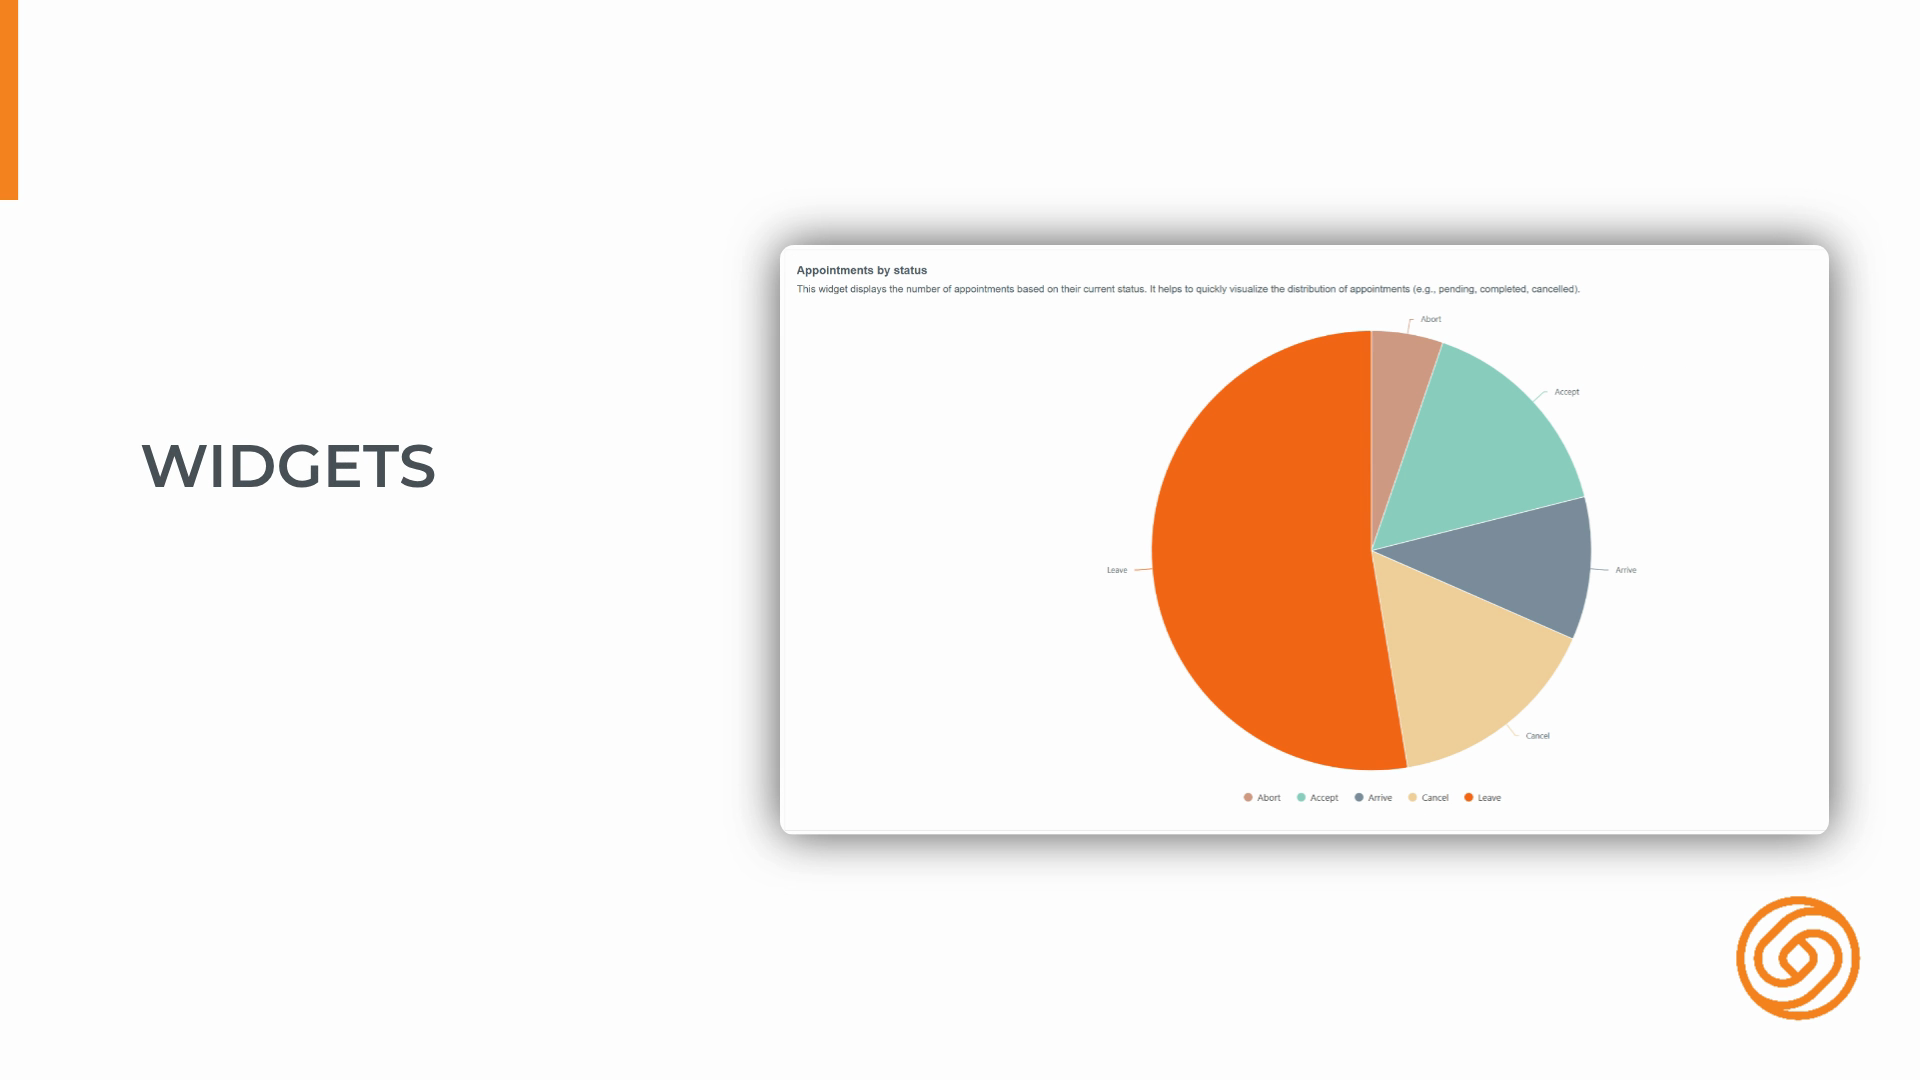
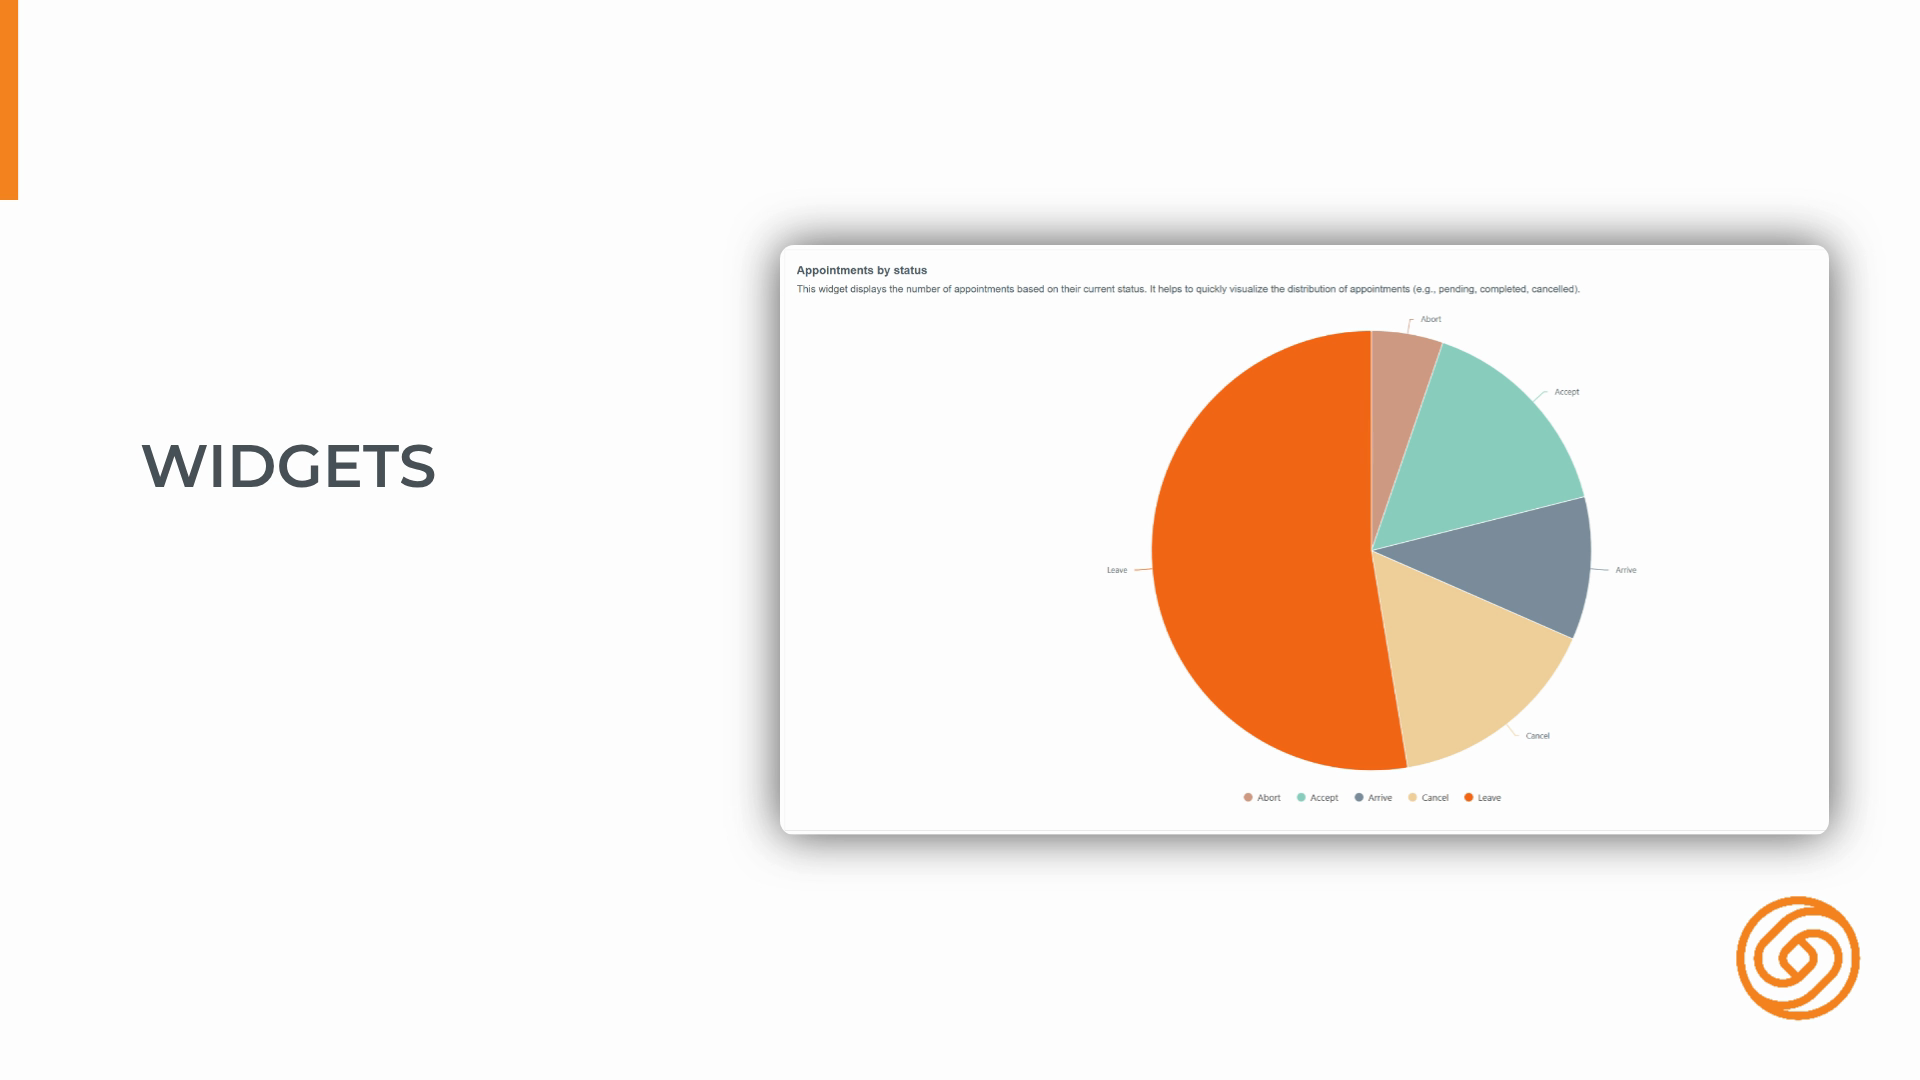
Step 14: Widgets are the mini charts and graphs on your dashboard, each tracking a specific metric or dataset.
Step 15: Tabular reports present your data in detailed tables—showing every record, not just summaries.
Step 16: Tabular reports reveal the full detail behind your data, unlike widgets which summarize information.
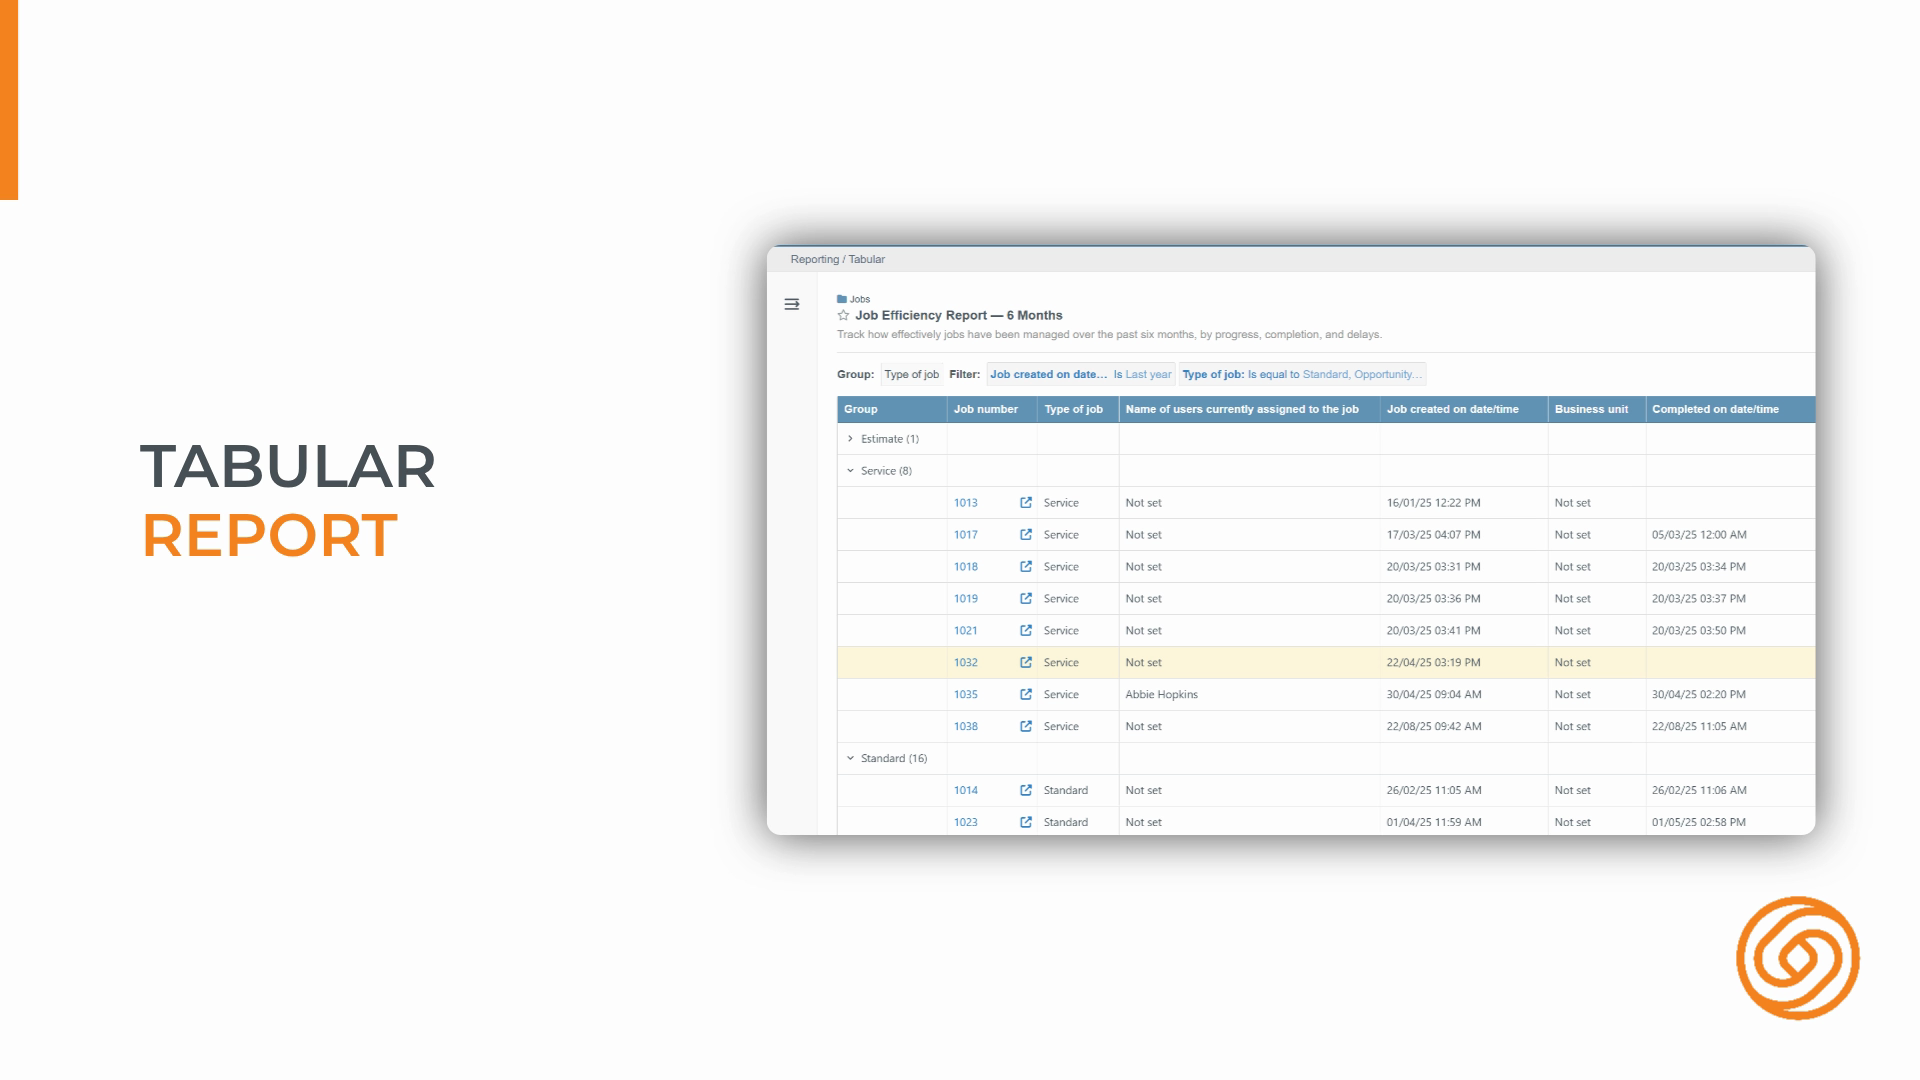
Step 17: Use grouping in tabular reports to organize your data into sections—for example, by job type or by month.
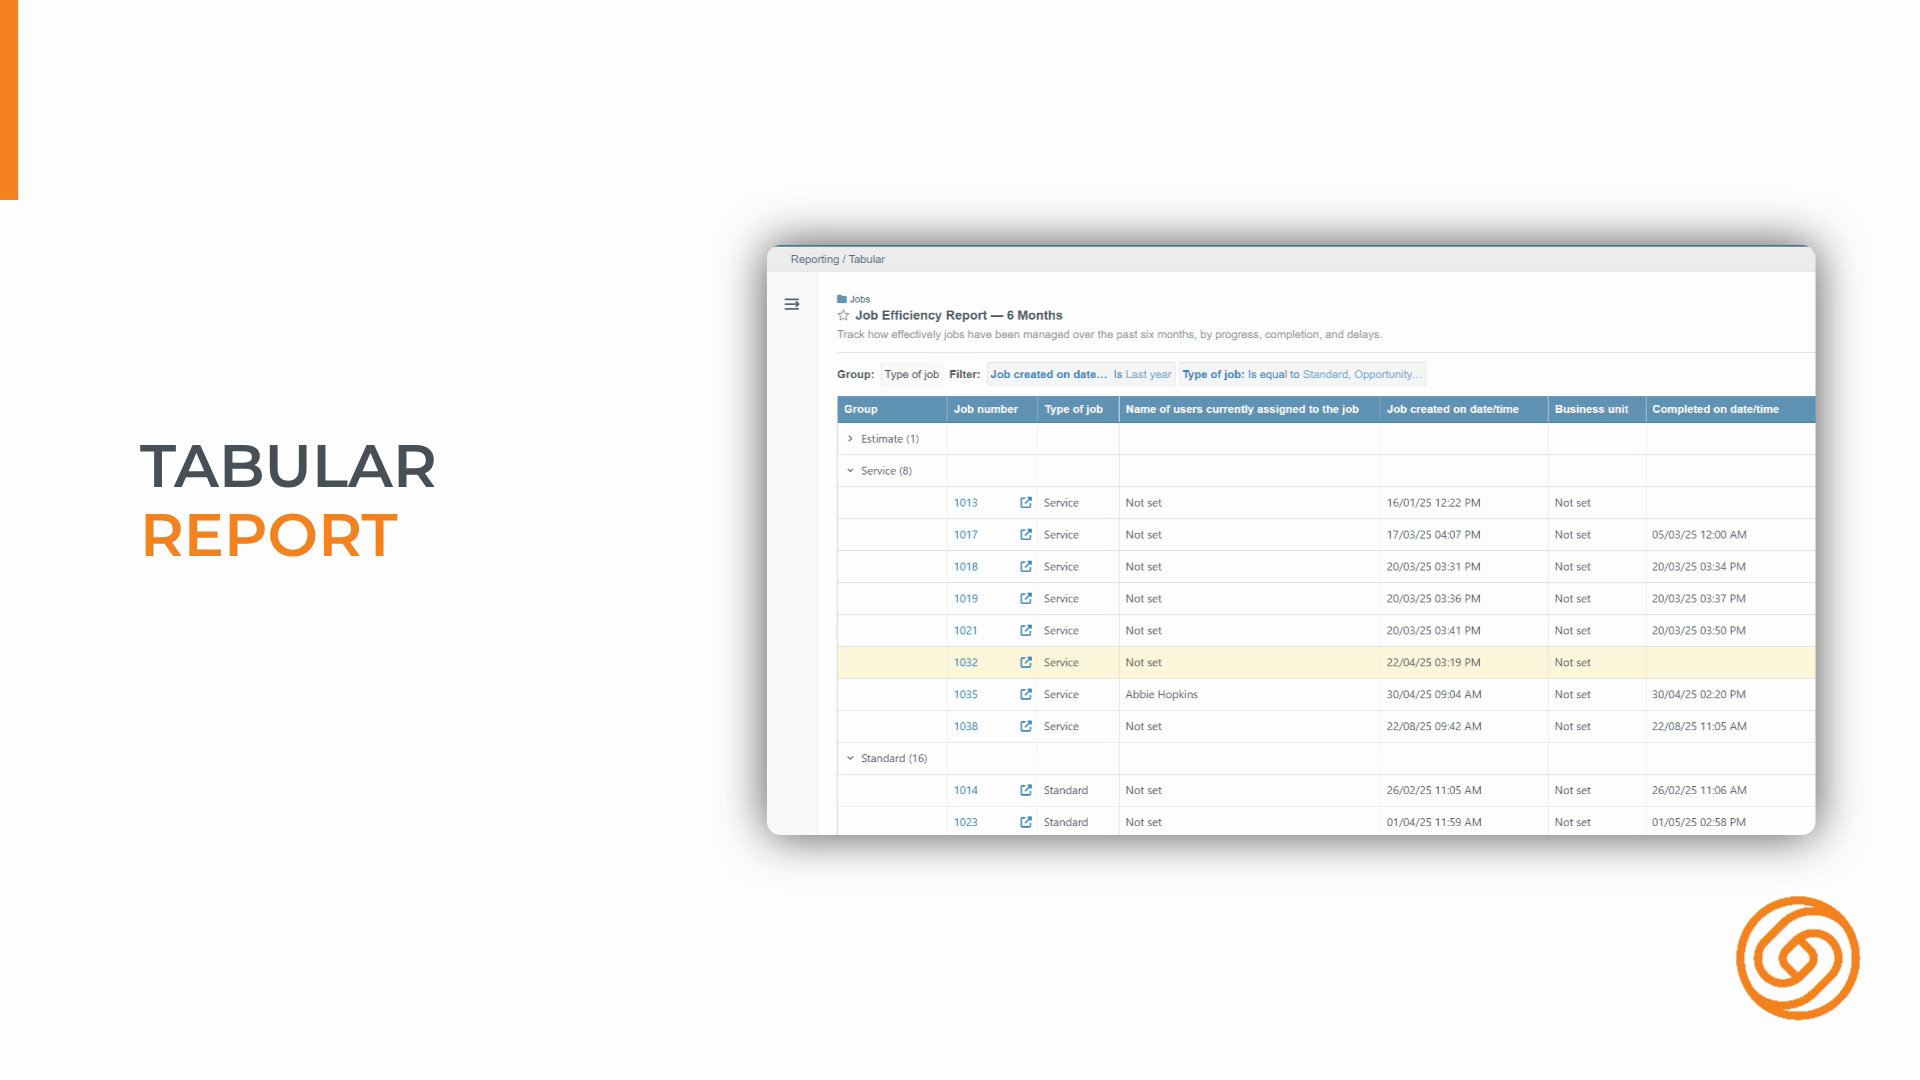
Step 18: Apply up to two levels of grouping for cleaner, more insightful reports.
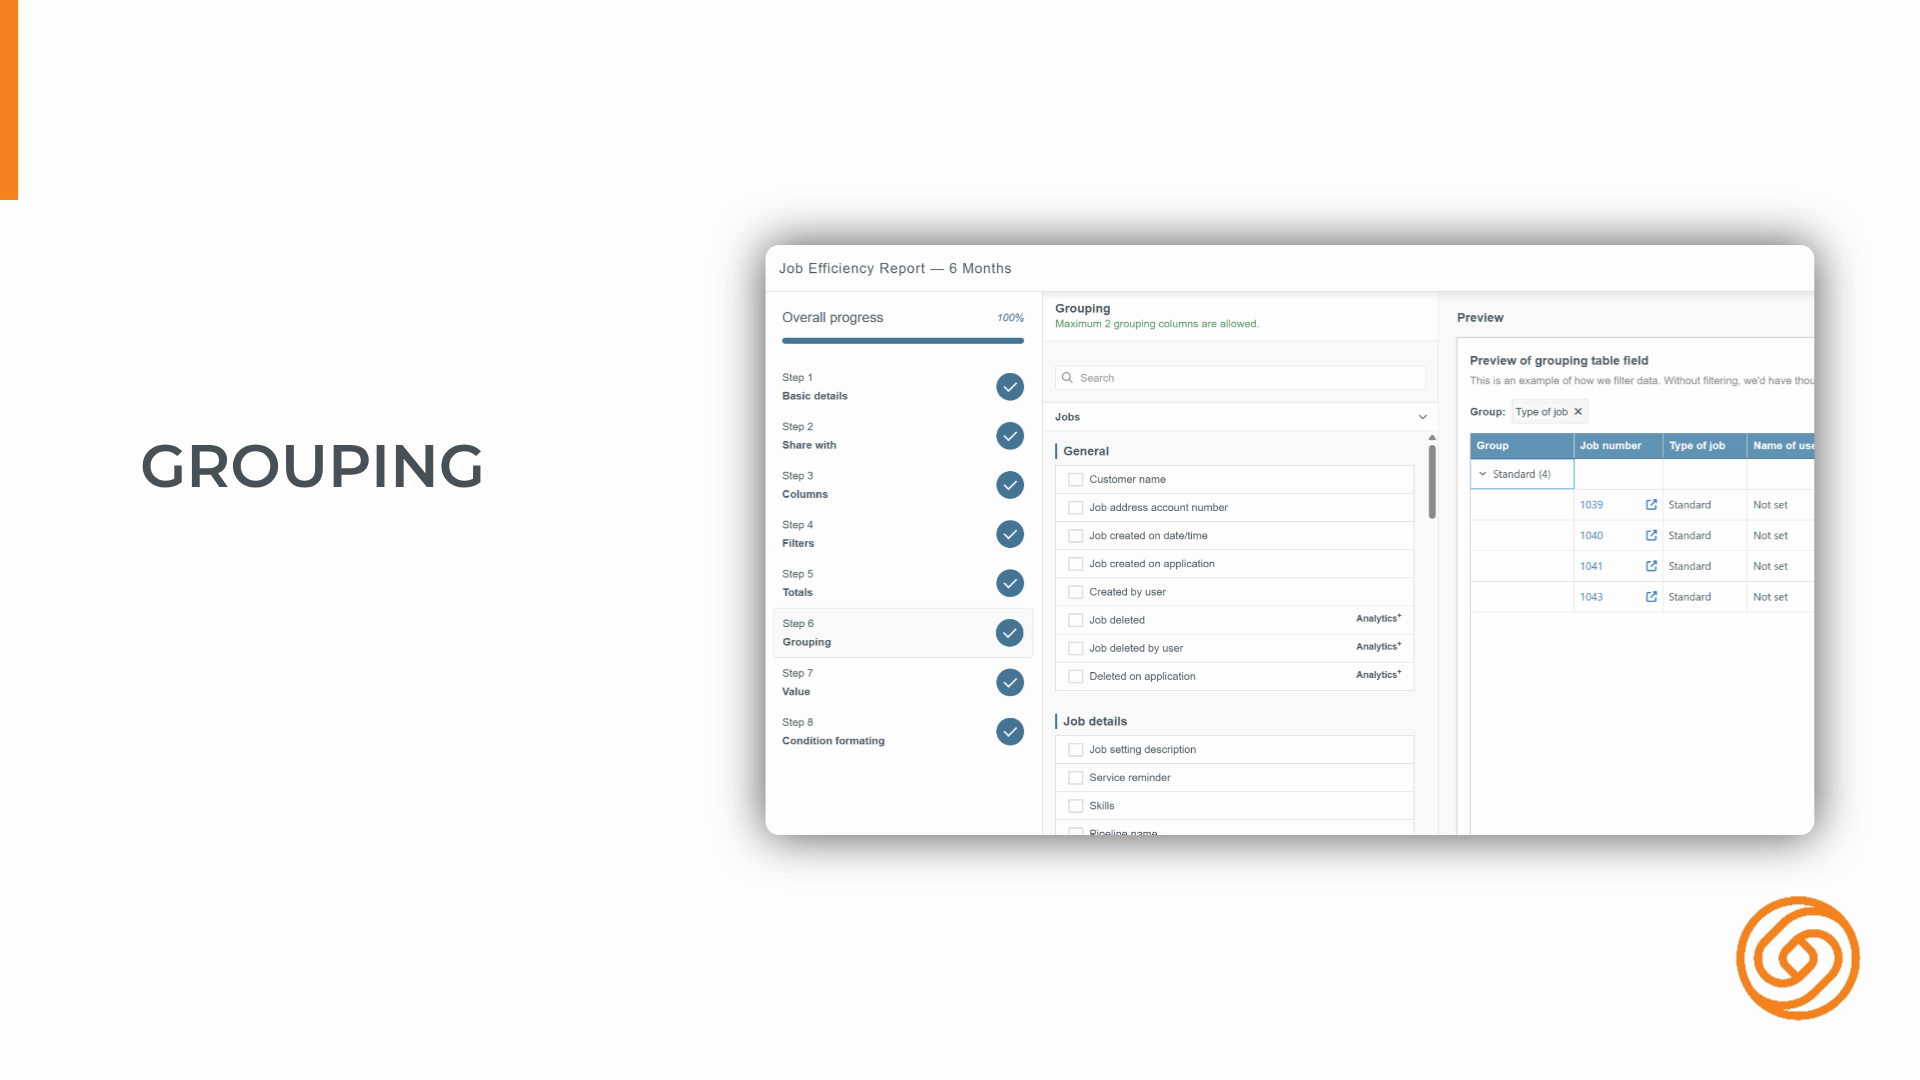
Mastering these basics helps you build powerful dashboards, detailed reports, and get the most from your analytics workspace. Start at the right object, use grouping for clarity, and customize your personal dashboard for insights that matter to you.
Created on
Did you find this article helpful?