

Custom widgets empower you to track exactly what matters to your business. Whether you’re monitoring job trends, performance, or compliance, custom widgets give you full control over data, calculations, and timeframes. They’re available on Customer Journey and Analytics Plus.
Step 1: Click Add Custom Widget on your dashboard.
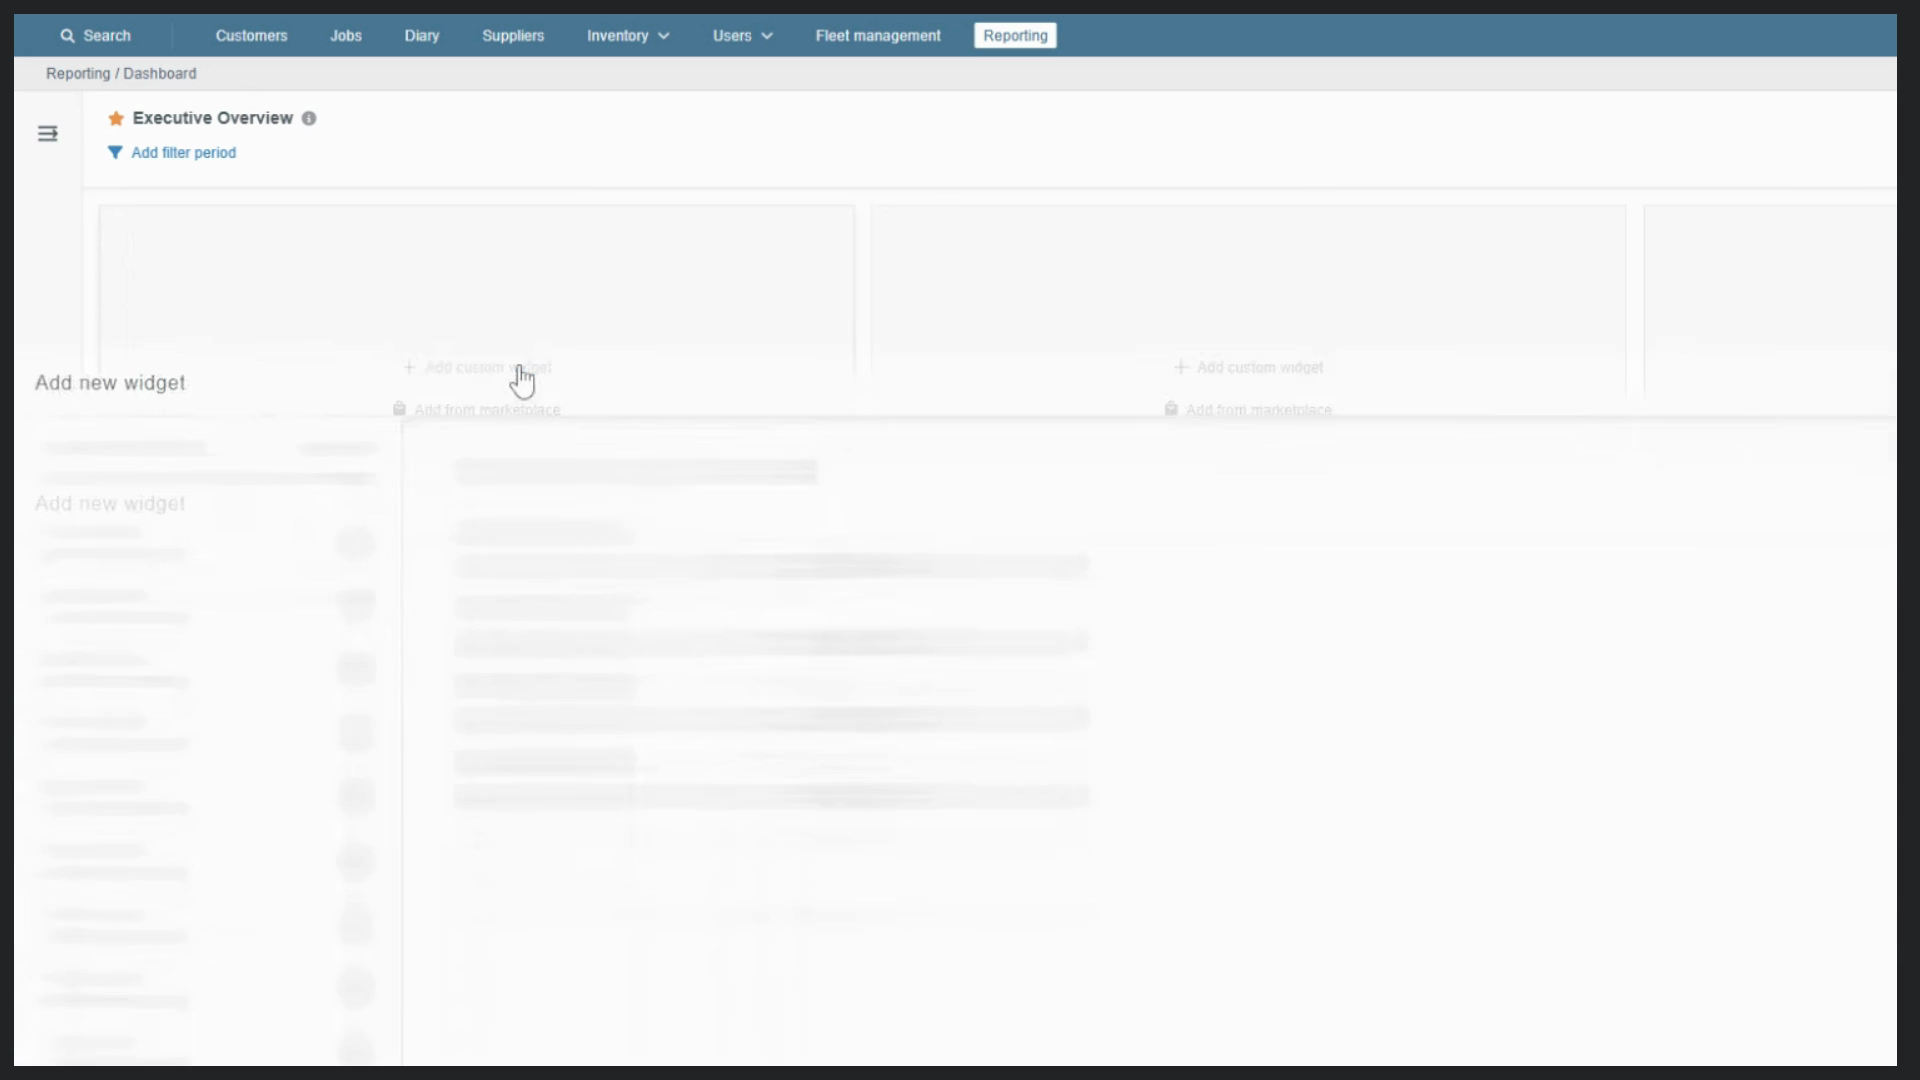
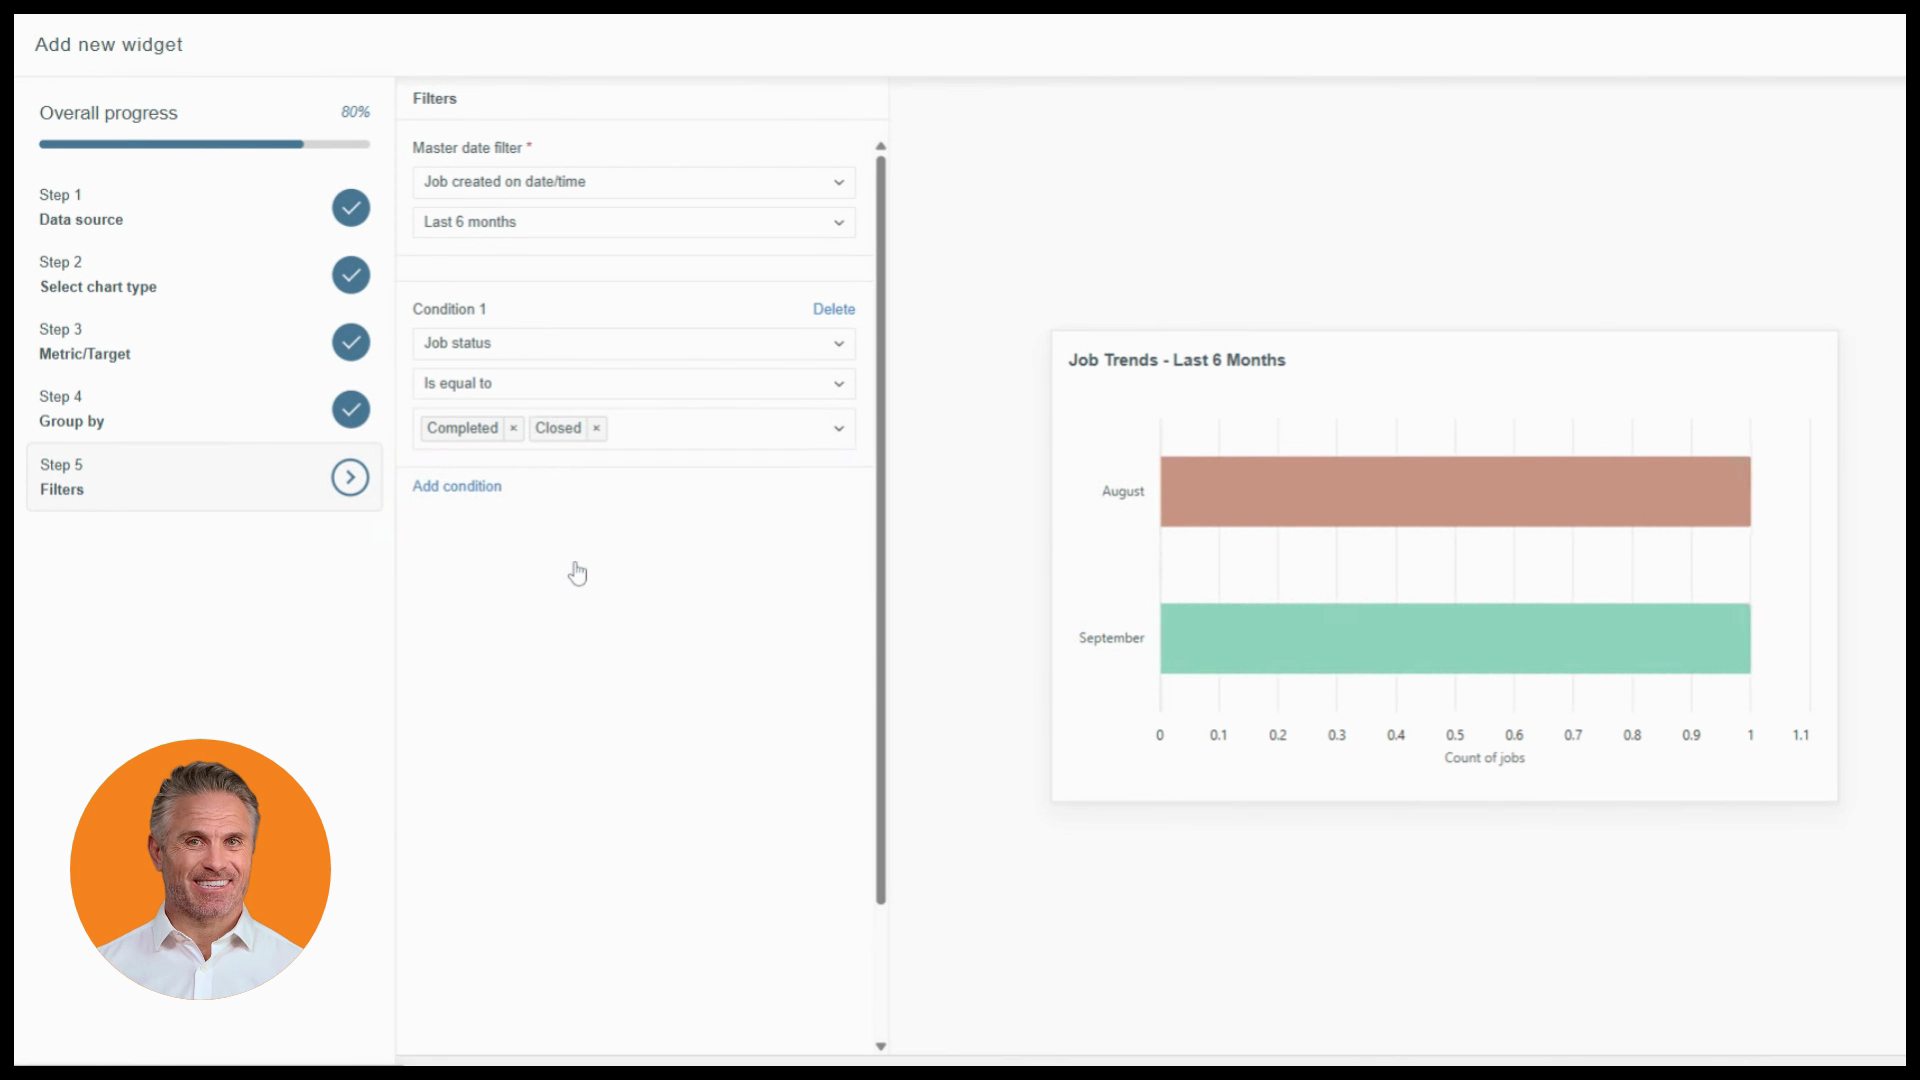
The setup wizard opens. On the left, you’ll see a progress indicator guiding you through five core steps: data source, chart type, metric, group by, and filters.
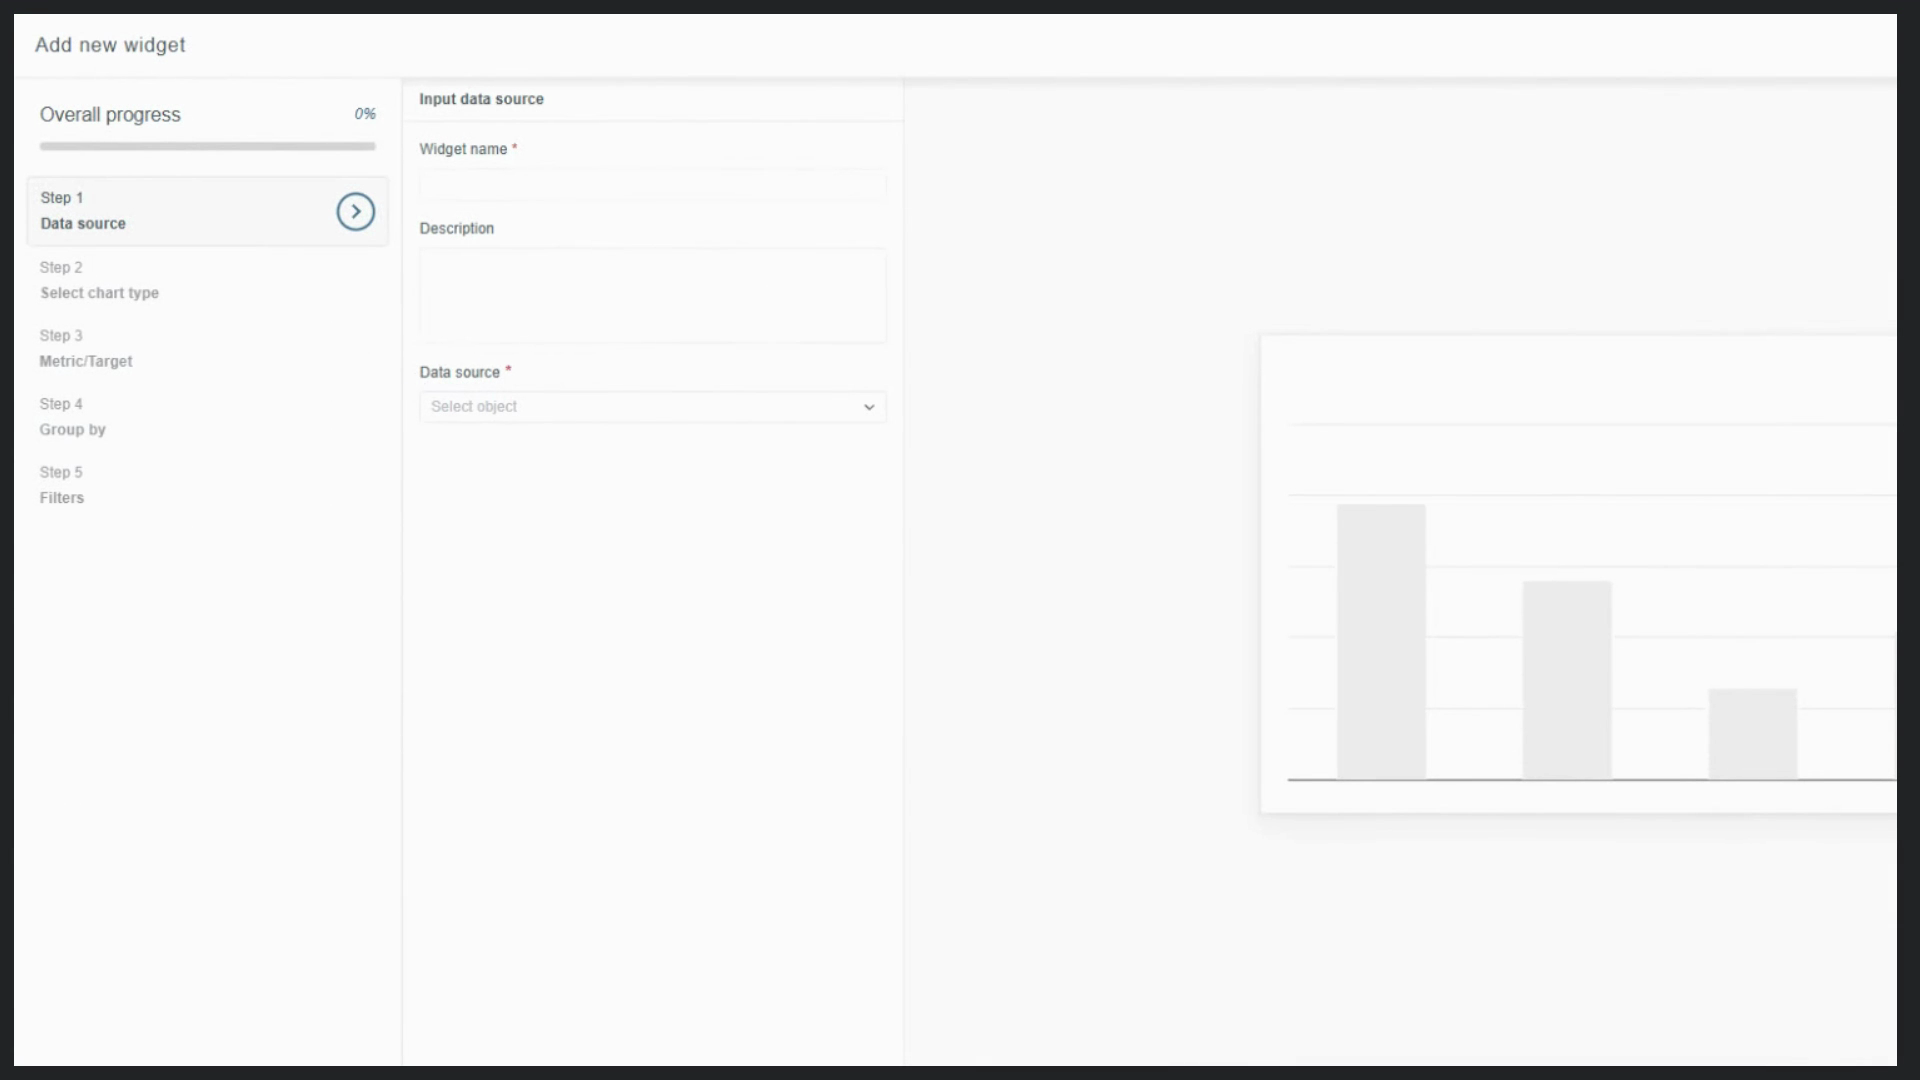
Start by naming your widget. Choose something descriptive, like “Job Trends for Last Six Months,” and add an optional description to help your team understand its purpose.
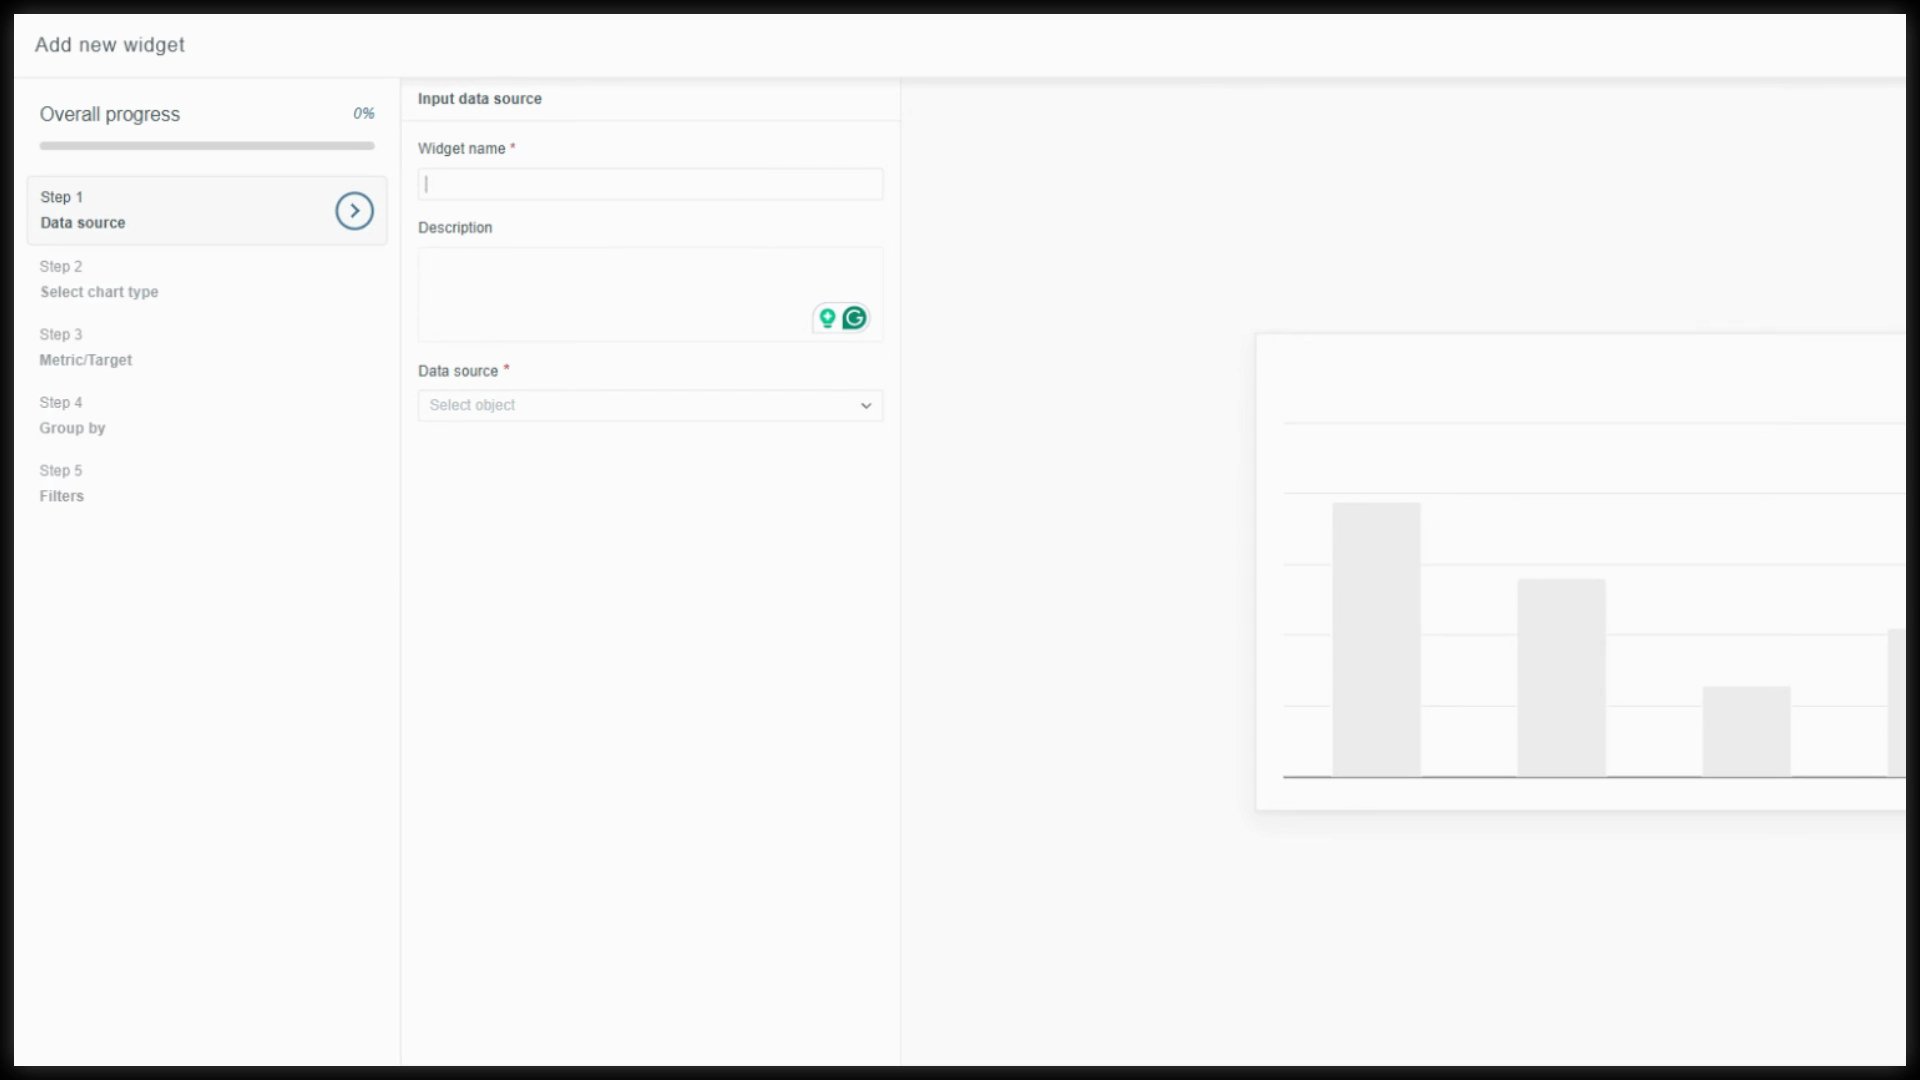
On the right, view an instant preview of your widget details as you build.
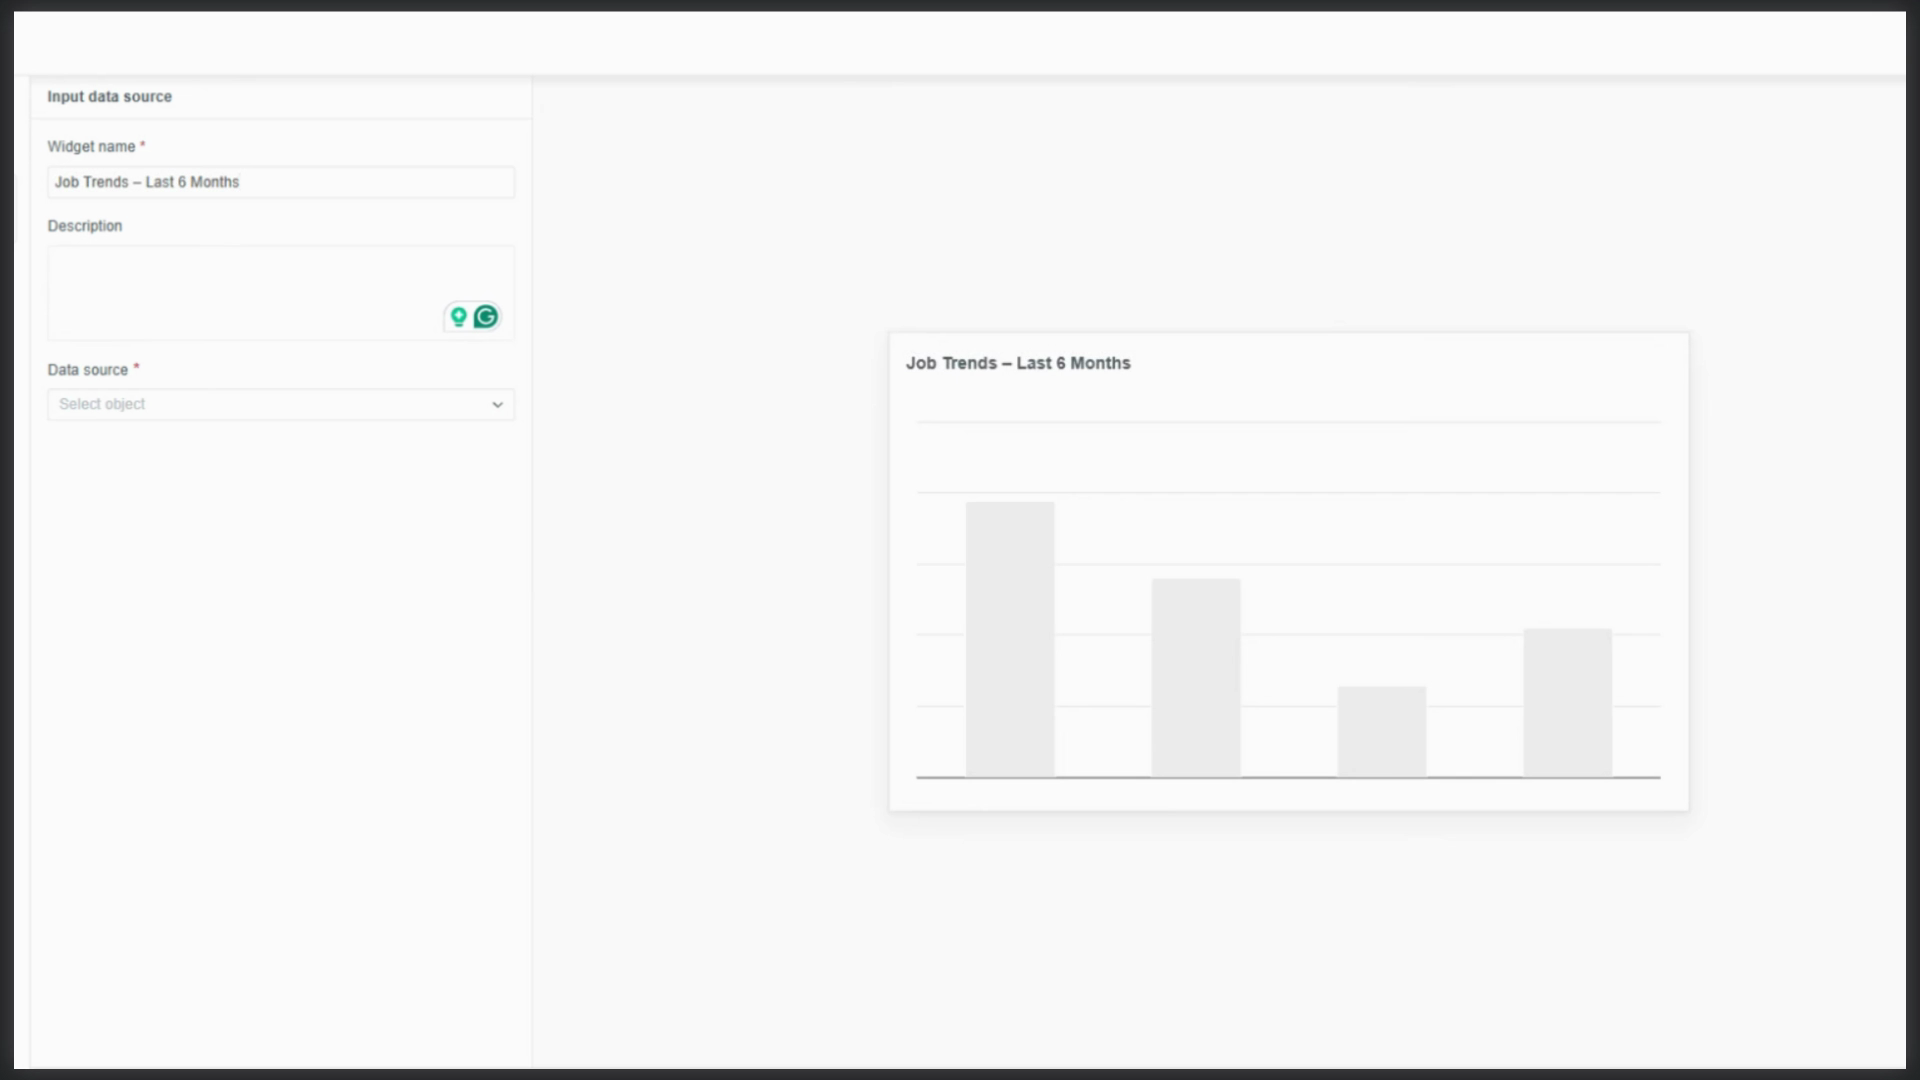
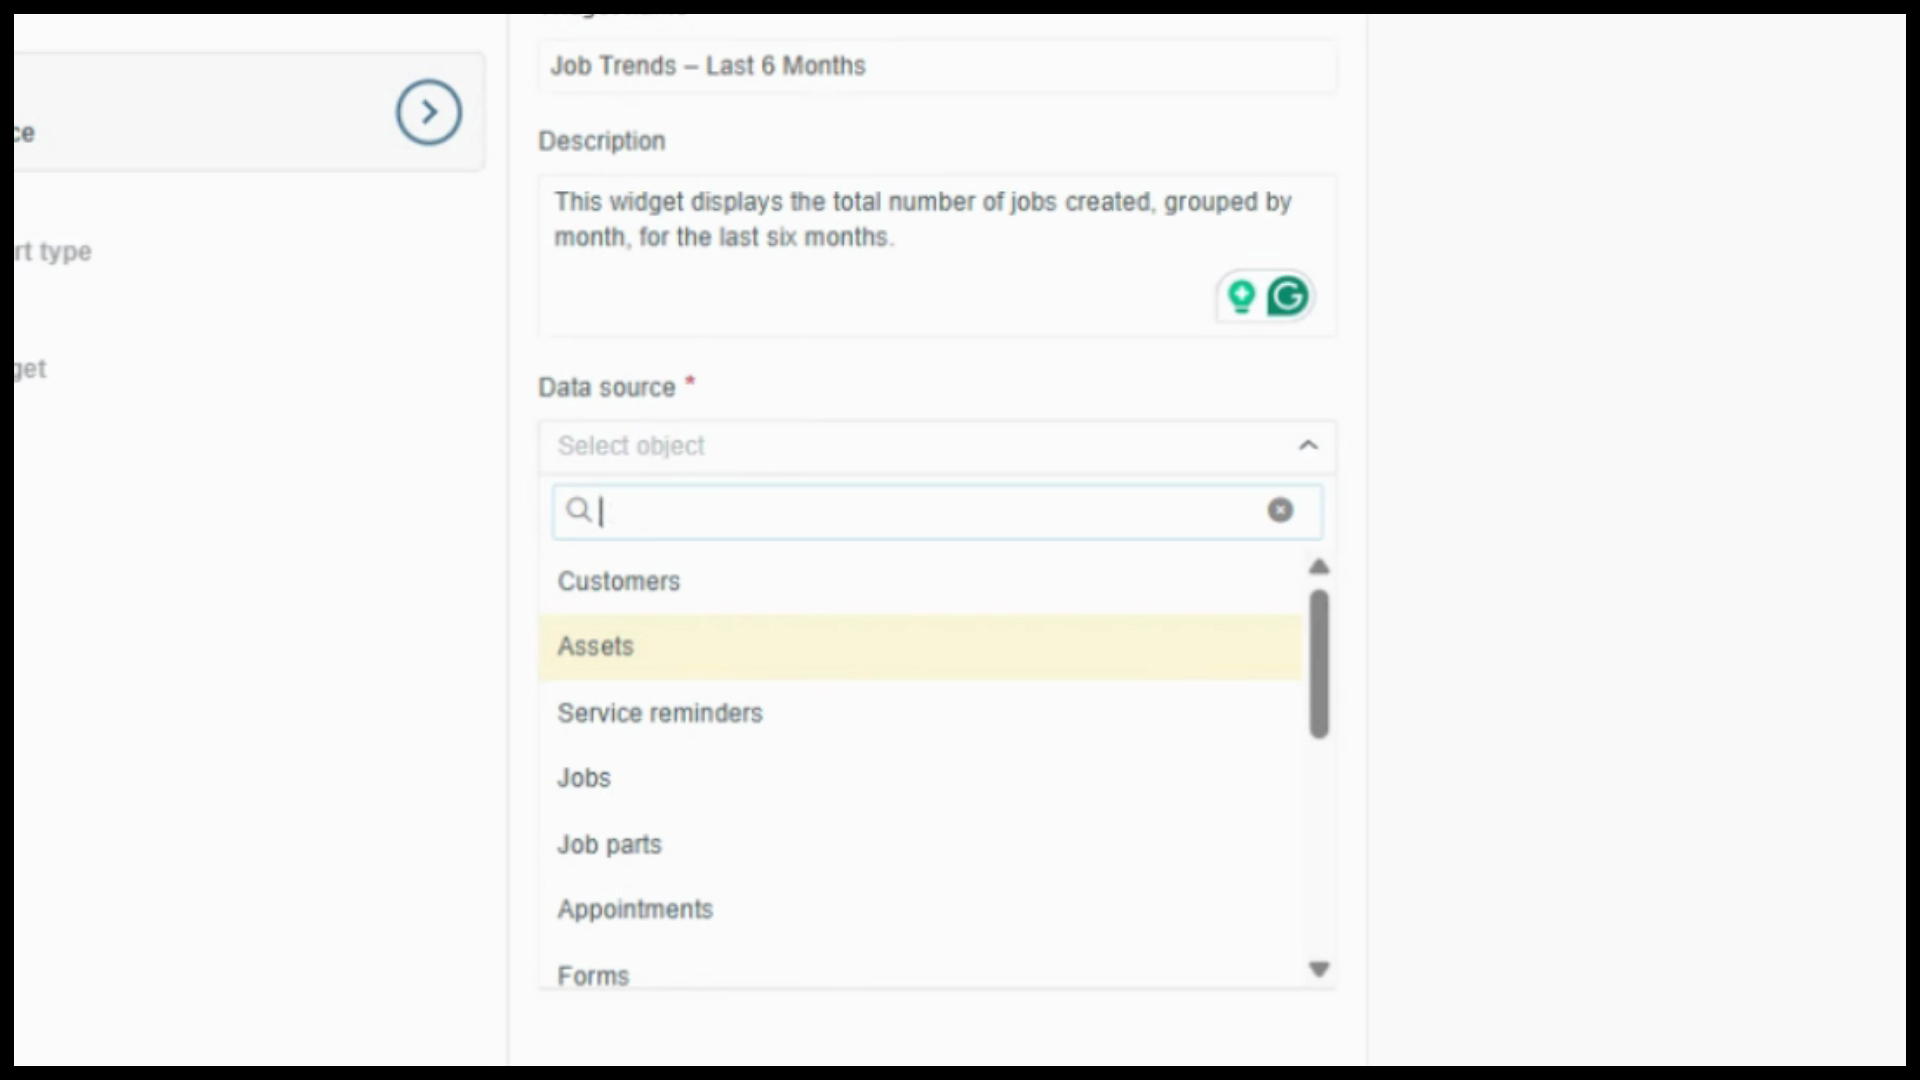
Next, pick your data source—this sets the foundation for all options in the following steps.
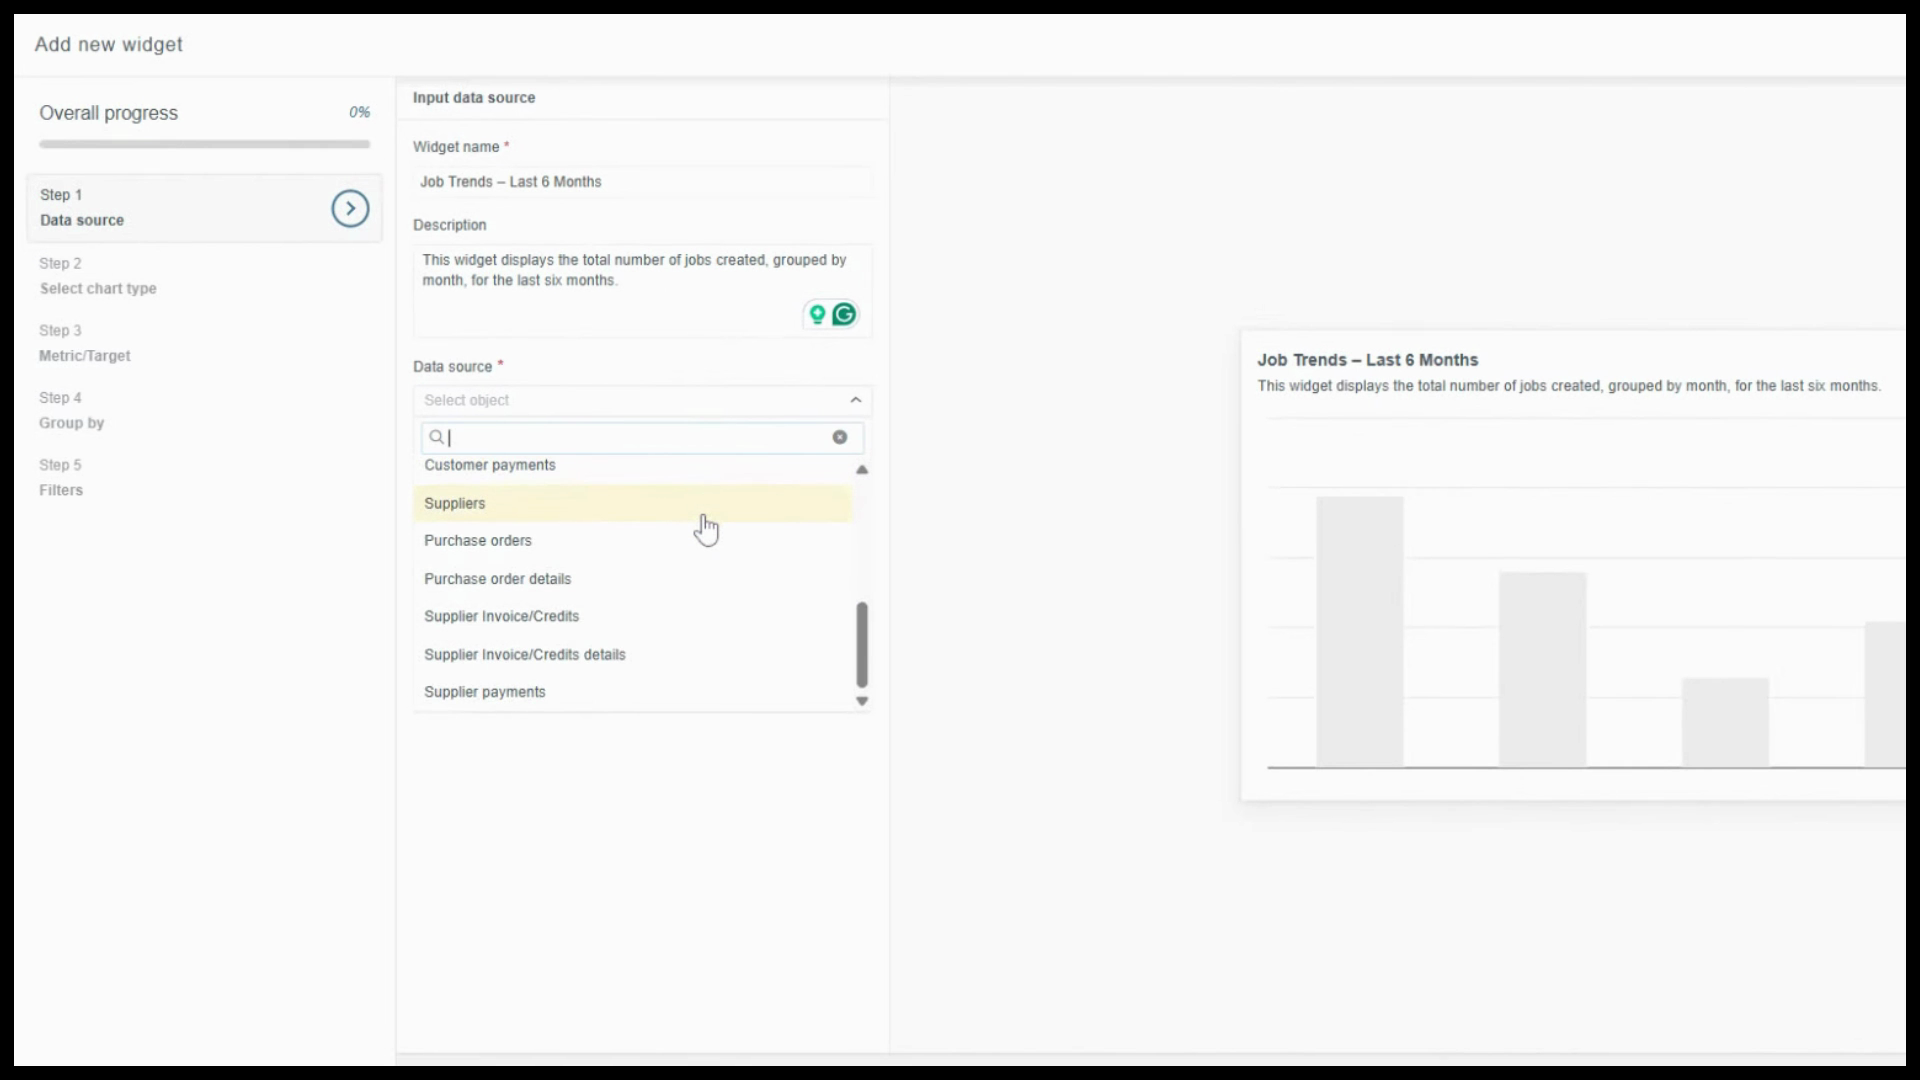
For job-level detail (and access to related customer data), select Jobs.
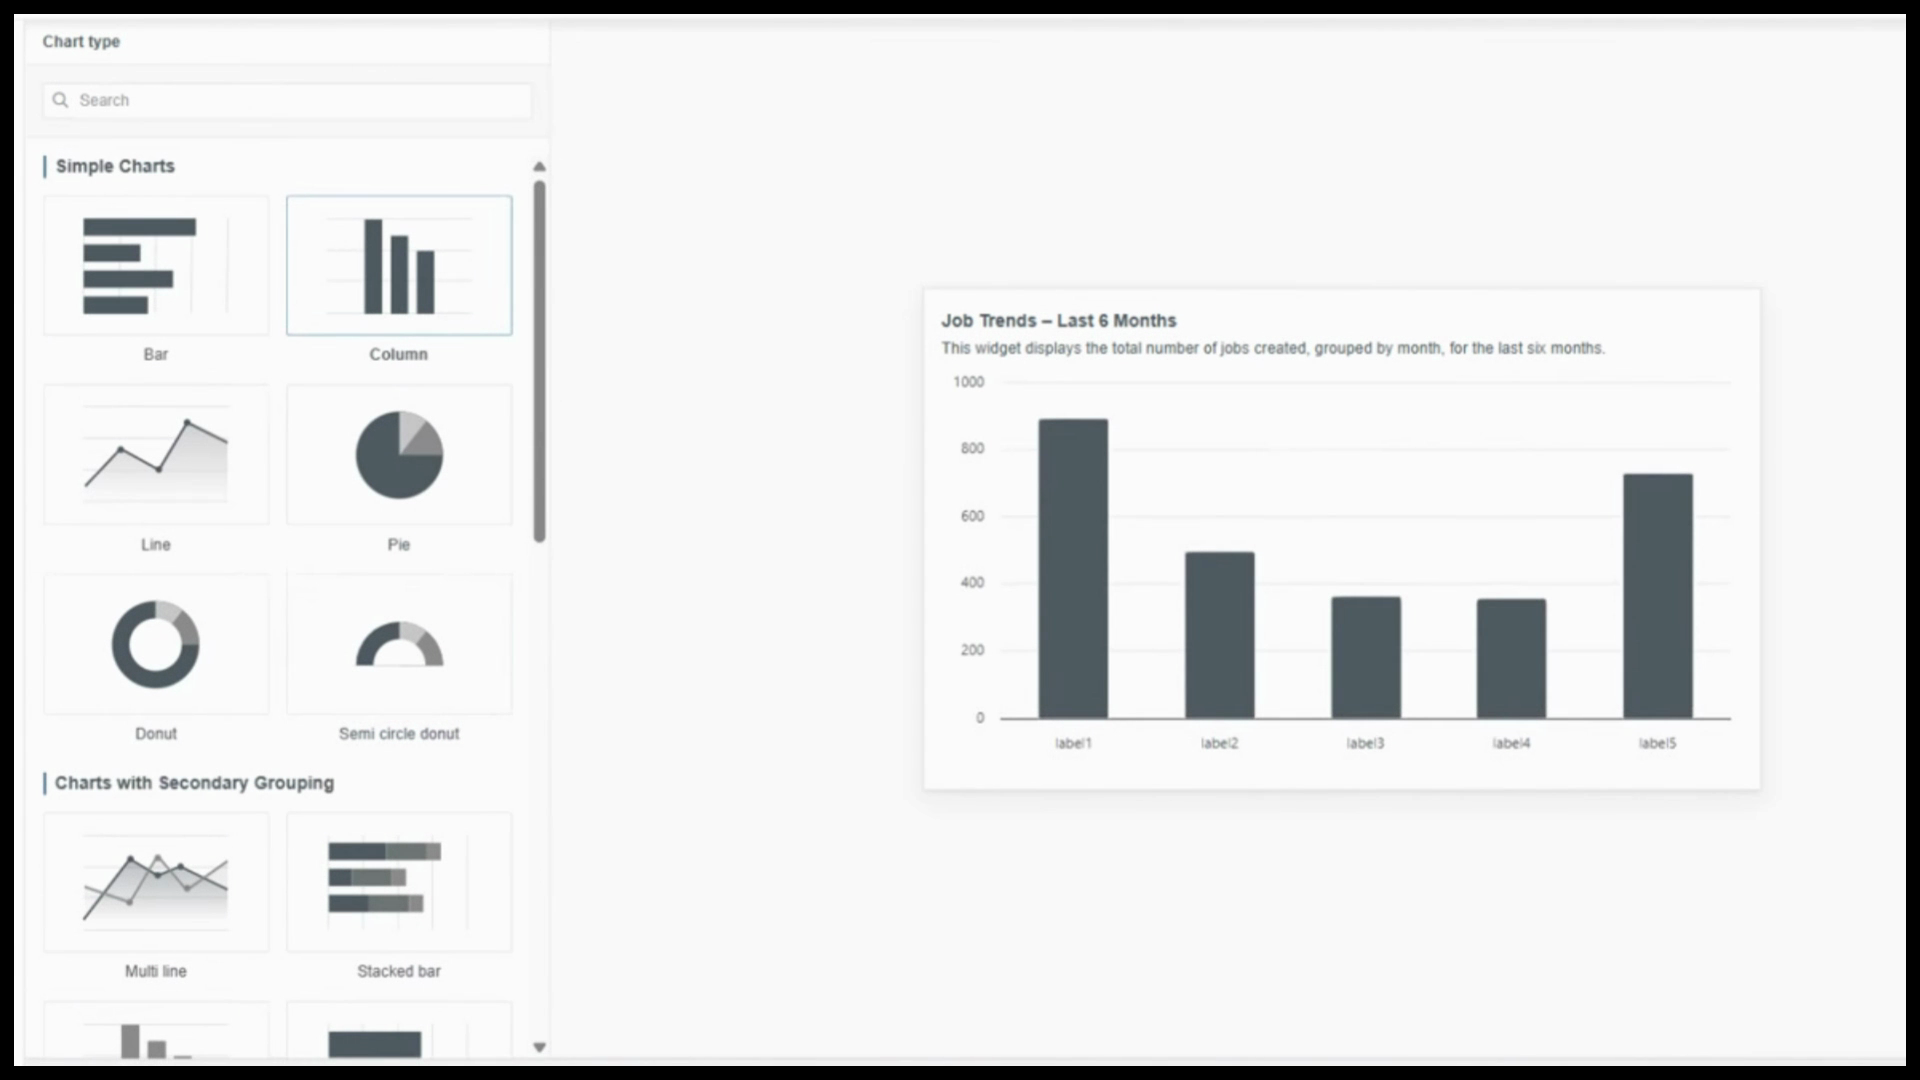
Step 2: Choose your chart type.
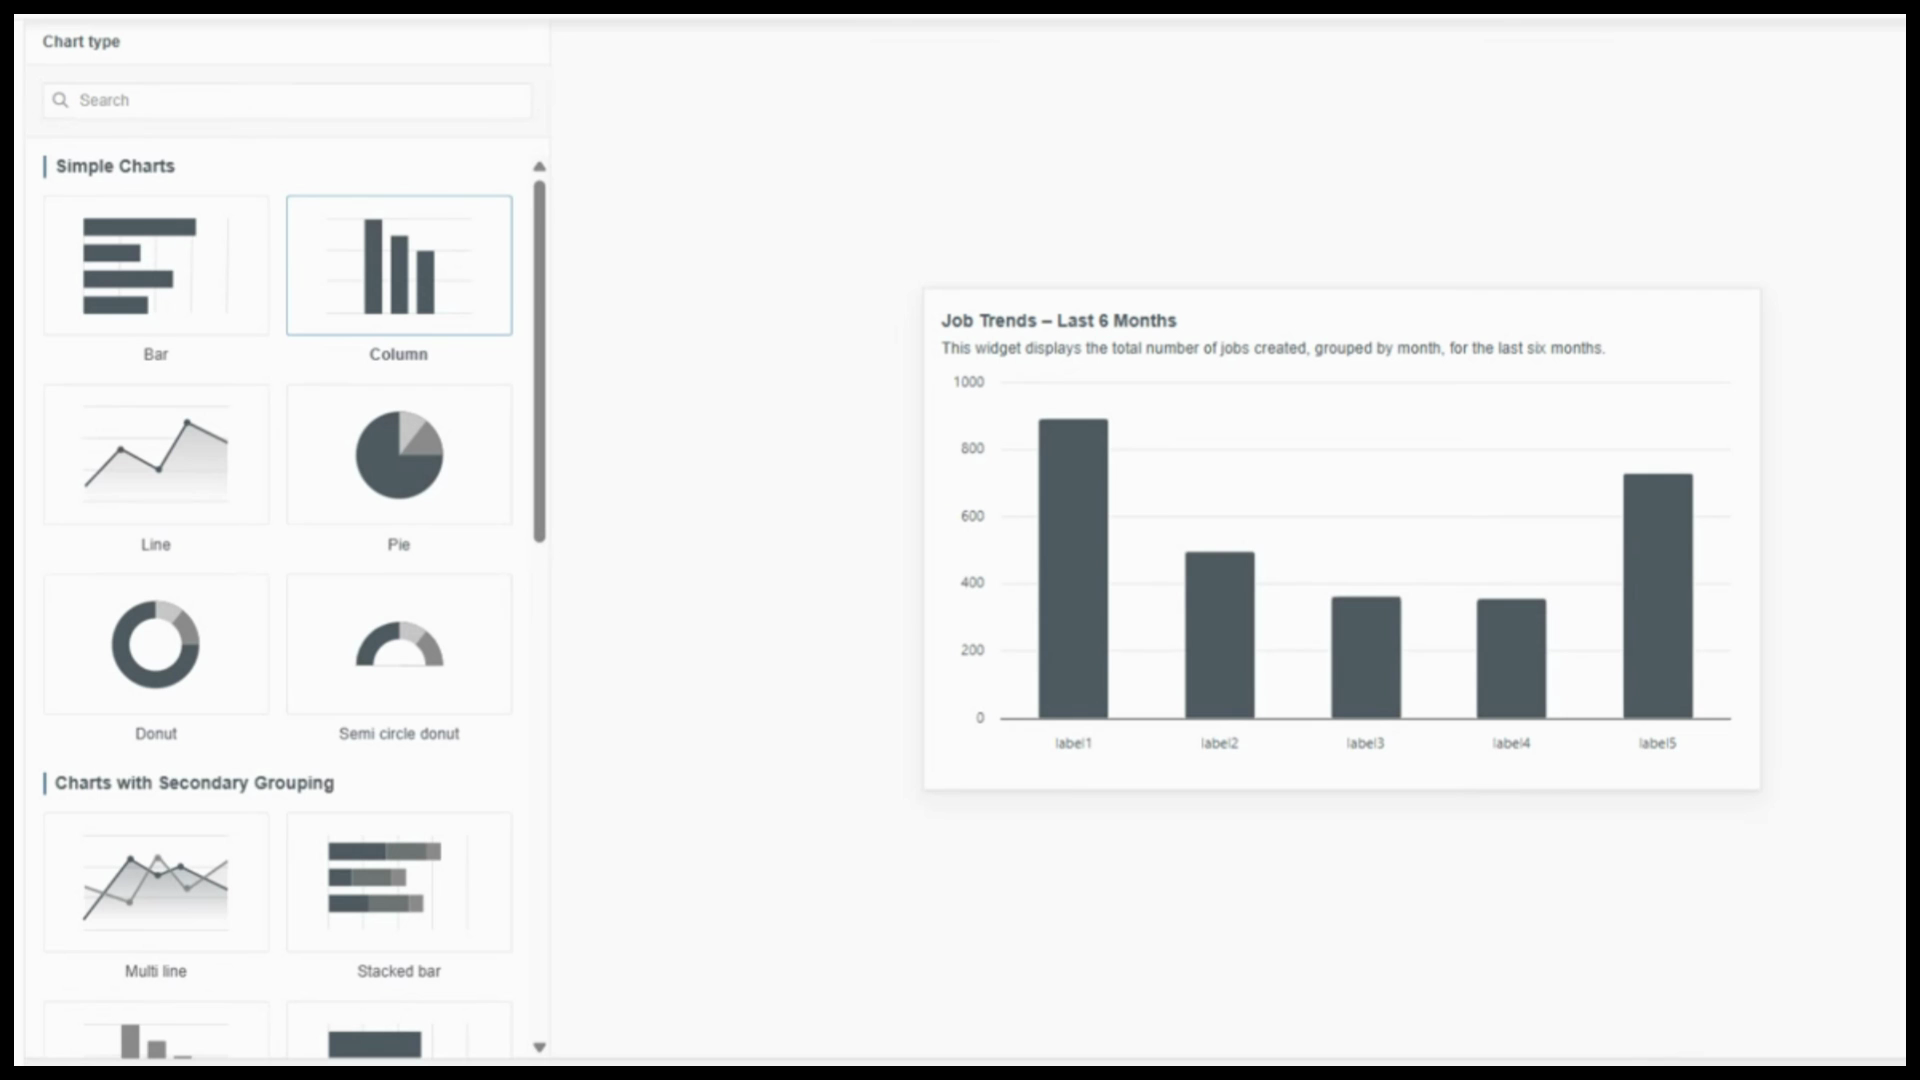
Preview different chart styles to find the best fit for your data story. For showing trends over time, use a column chart from simple charts.
Step 3: Set the metric.
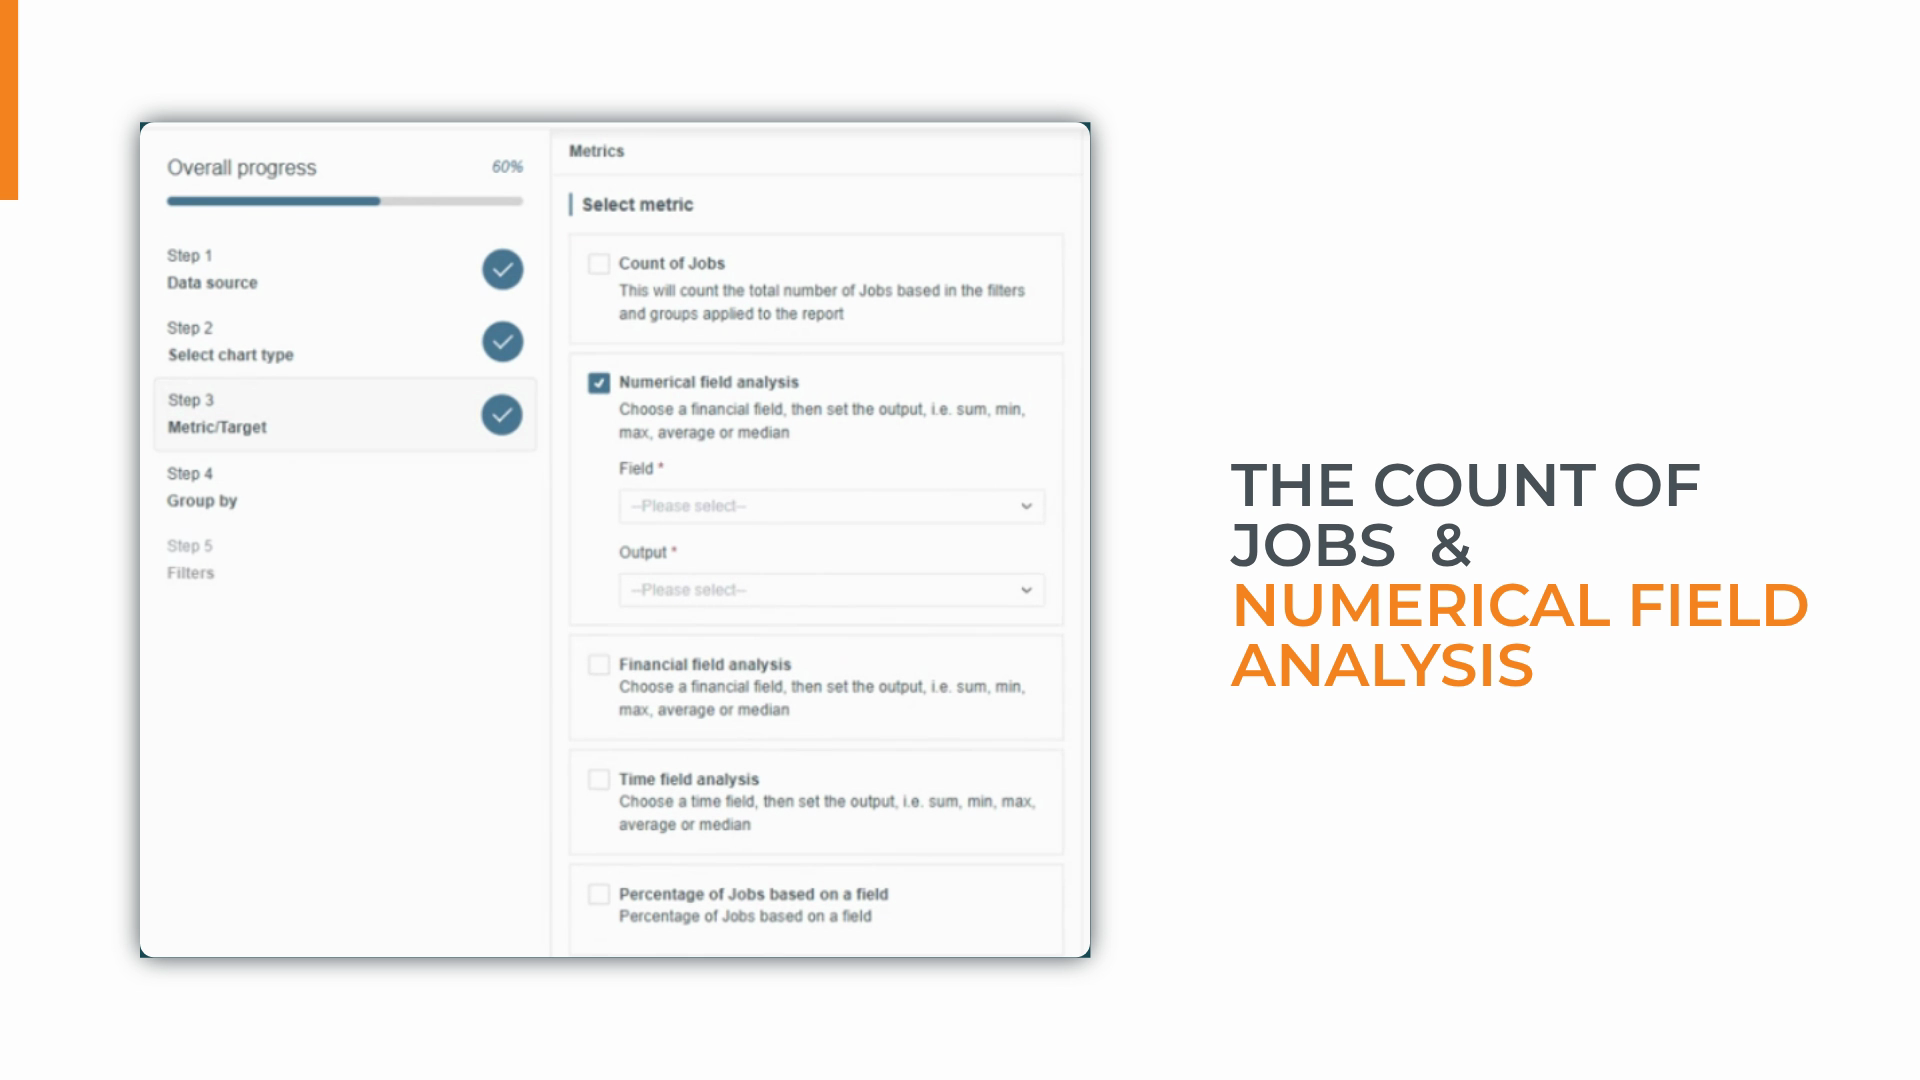
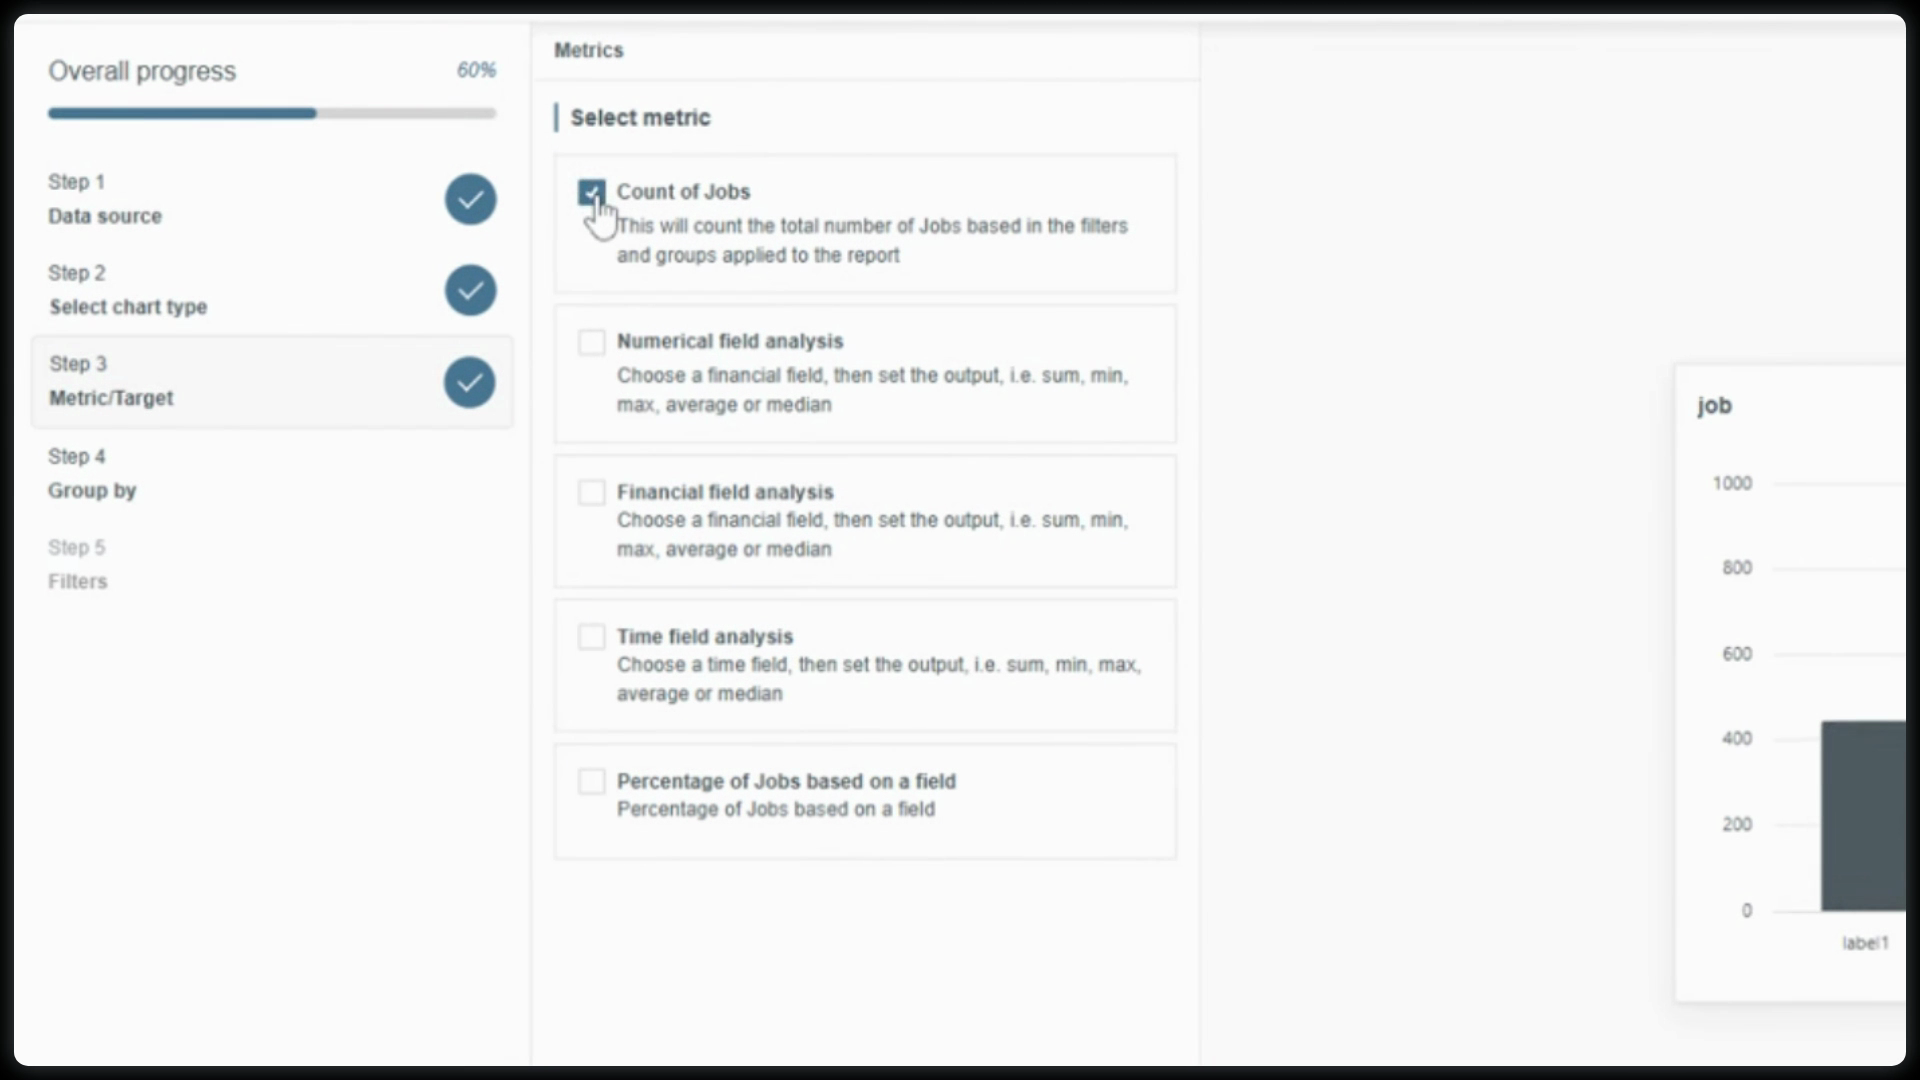
Decide how your data is calculated. Options depend on your data source. For Jobs, you’ll see choices like:
Count of Jobs: Simple tally, perfect for high-level workload insights.
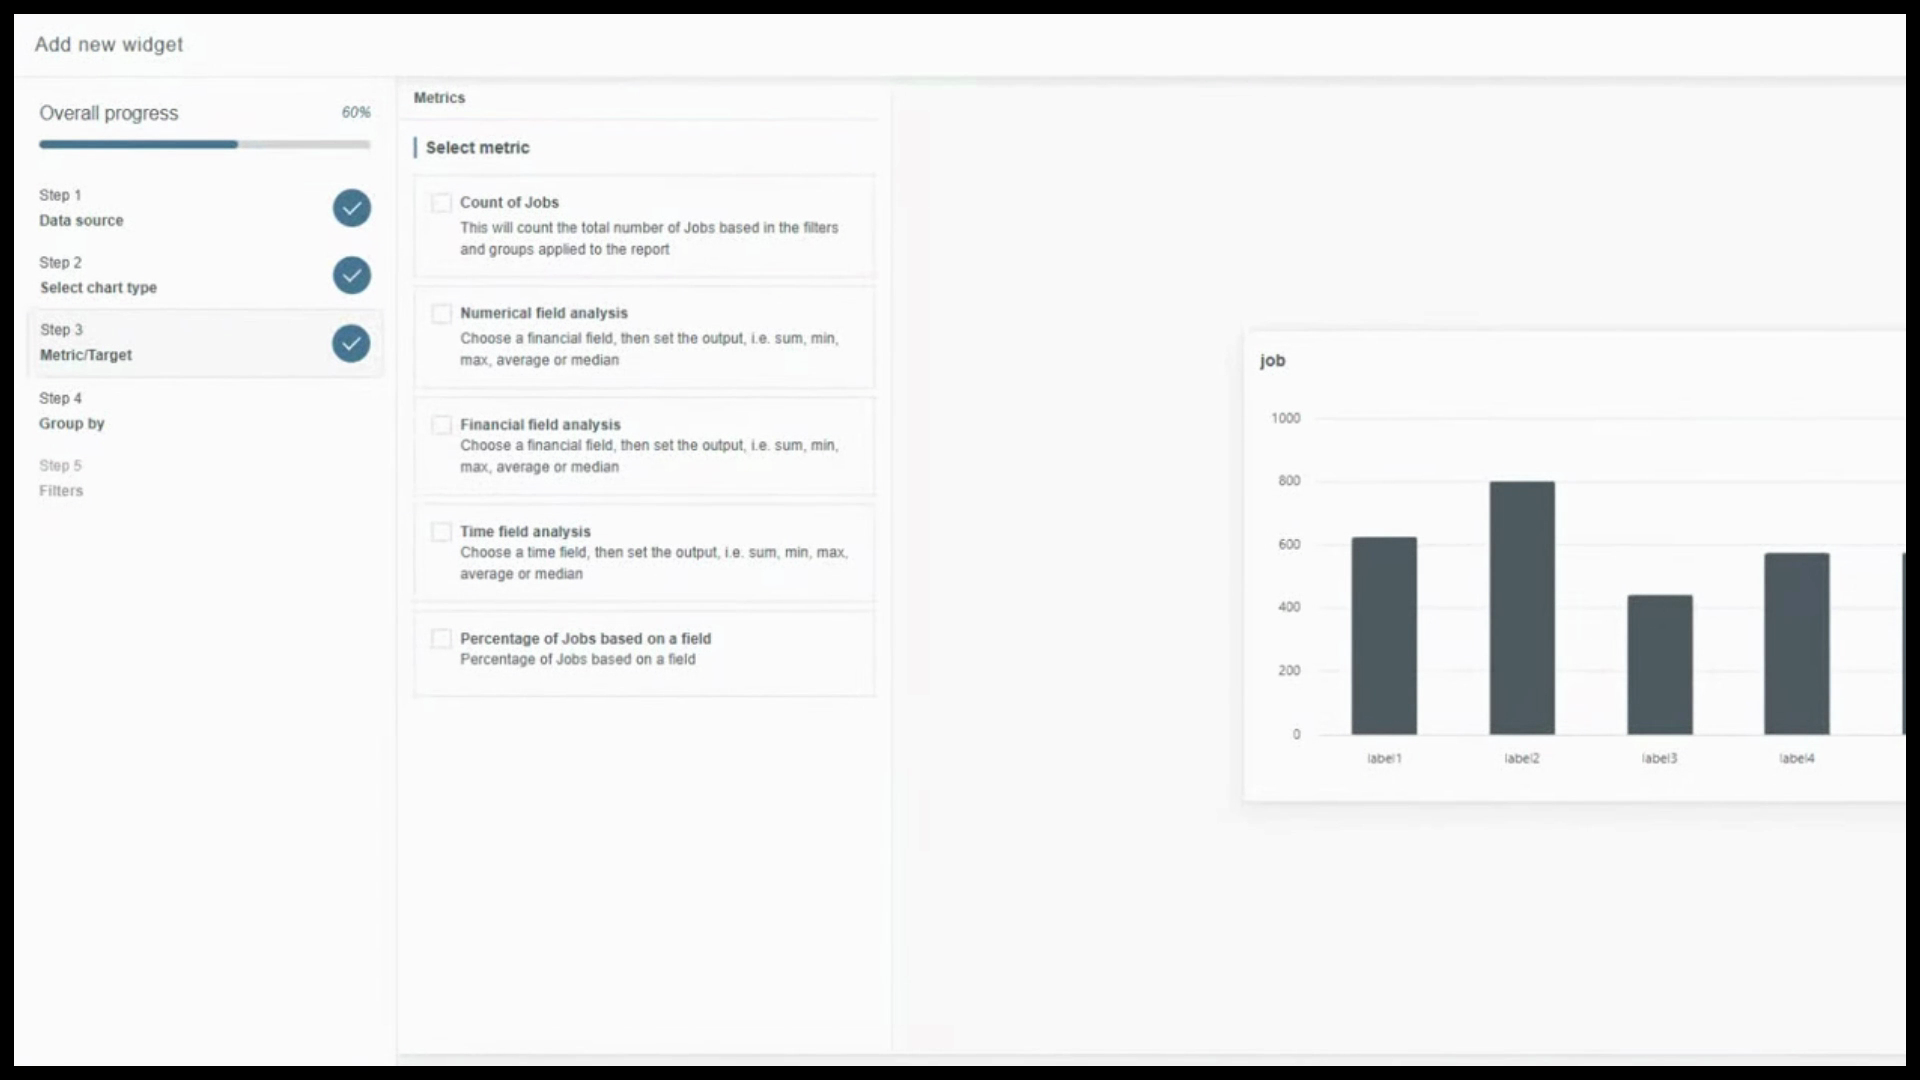
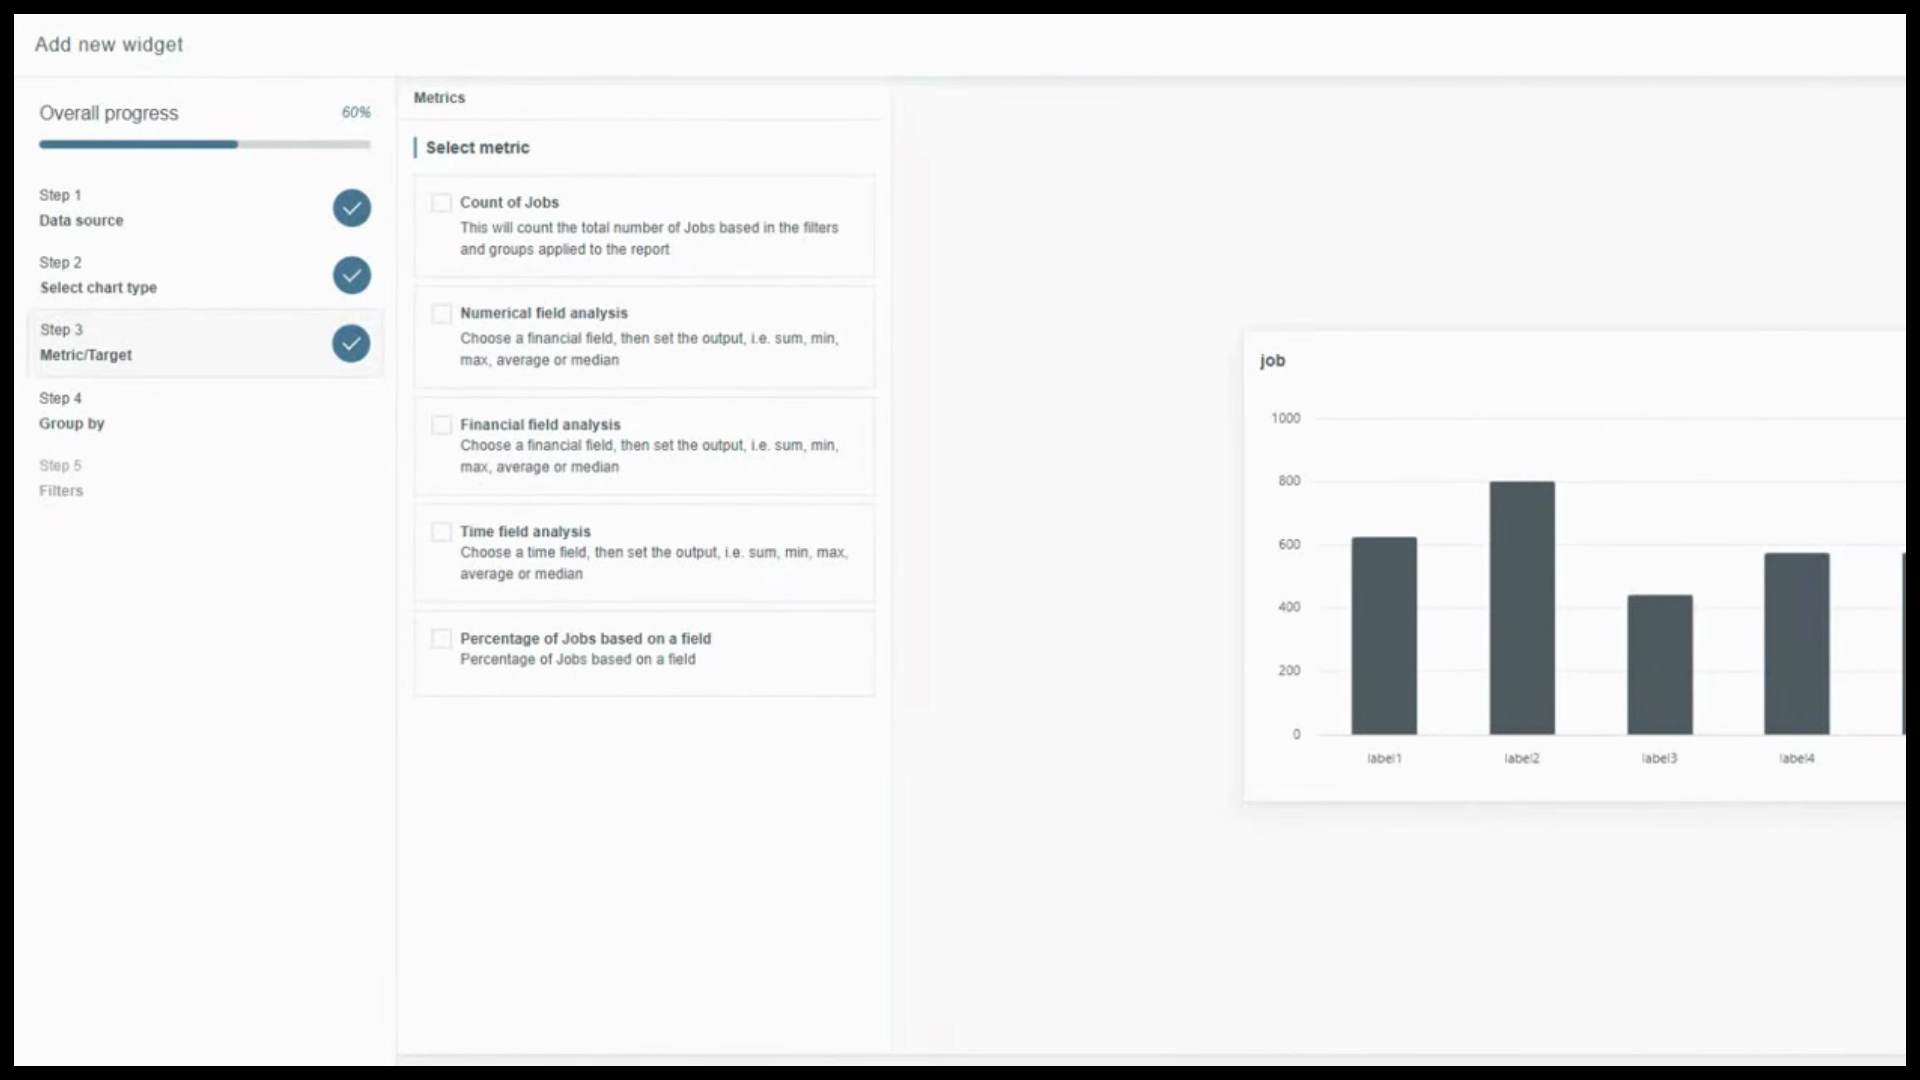
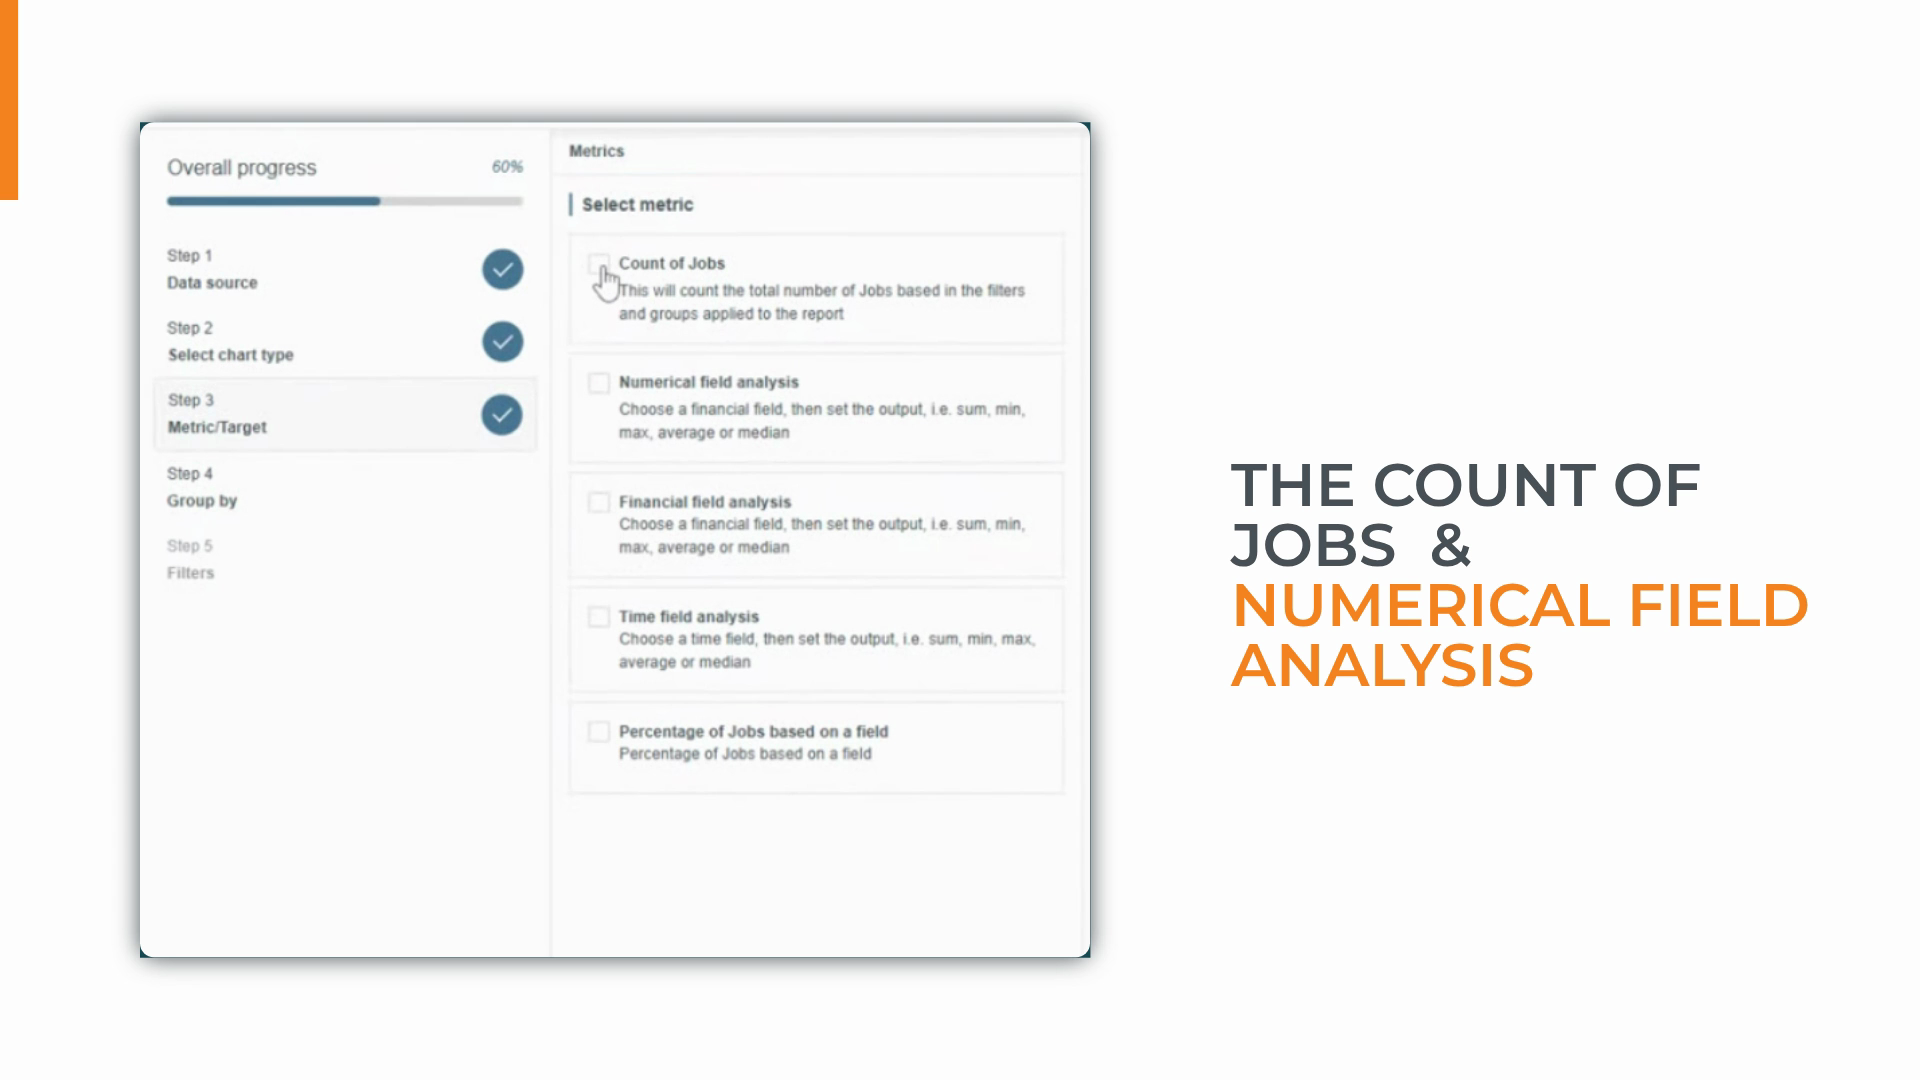
Numerical Field Analysis: Aggregate fields like hours worked or number of visits for performance tracking.
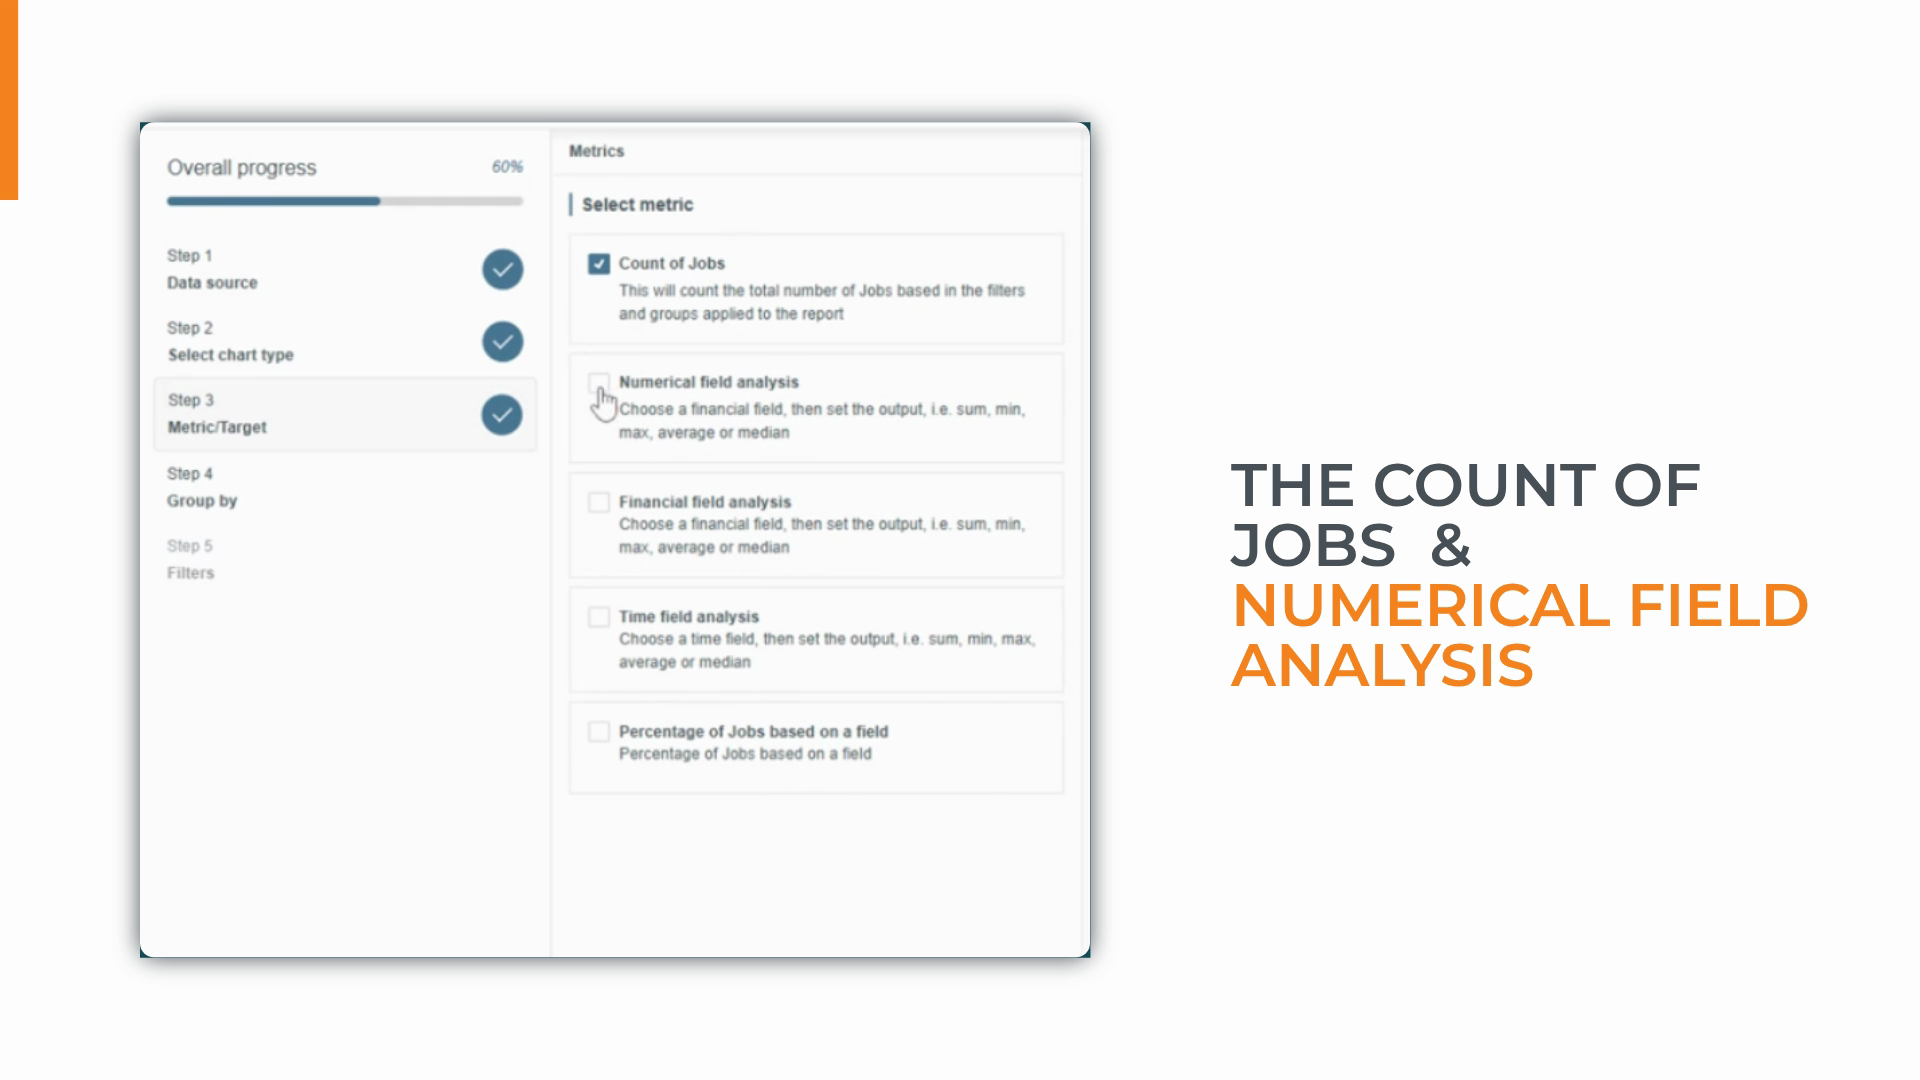
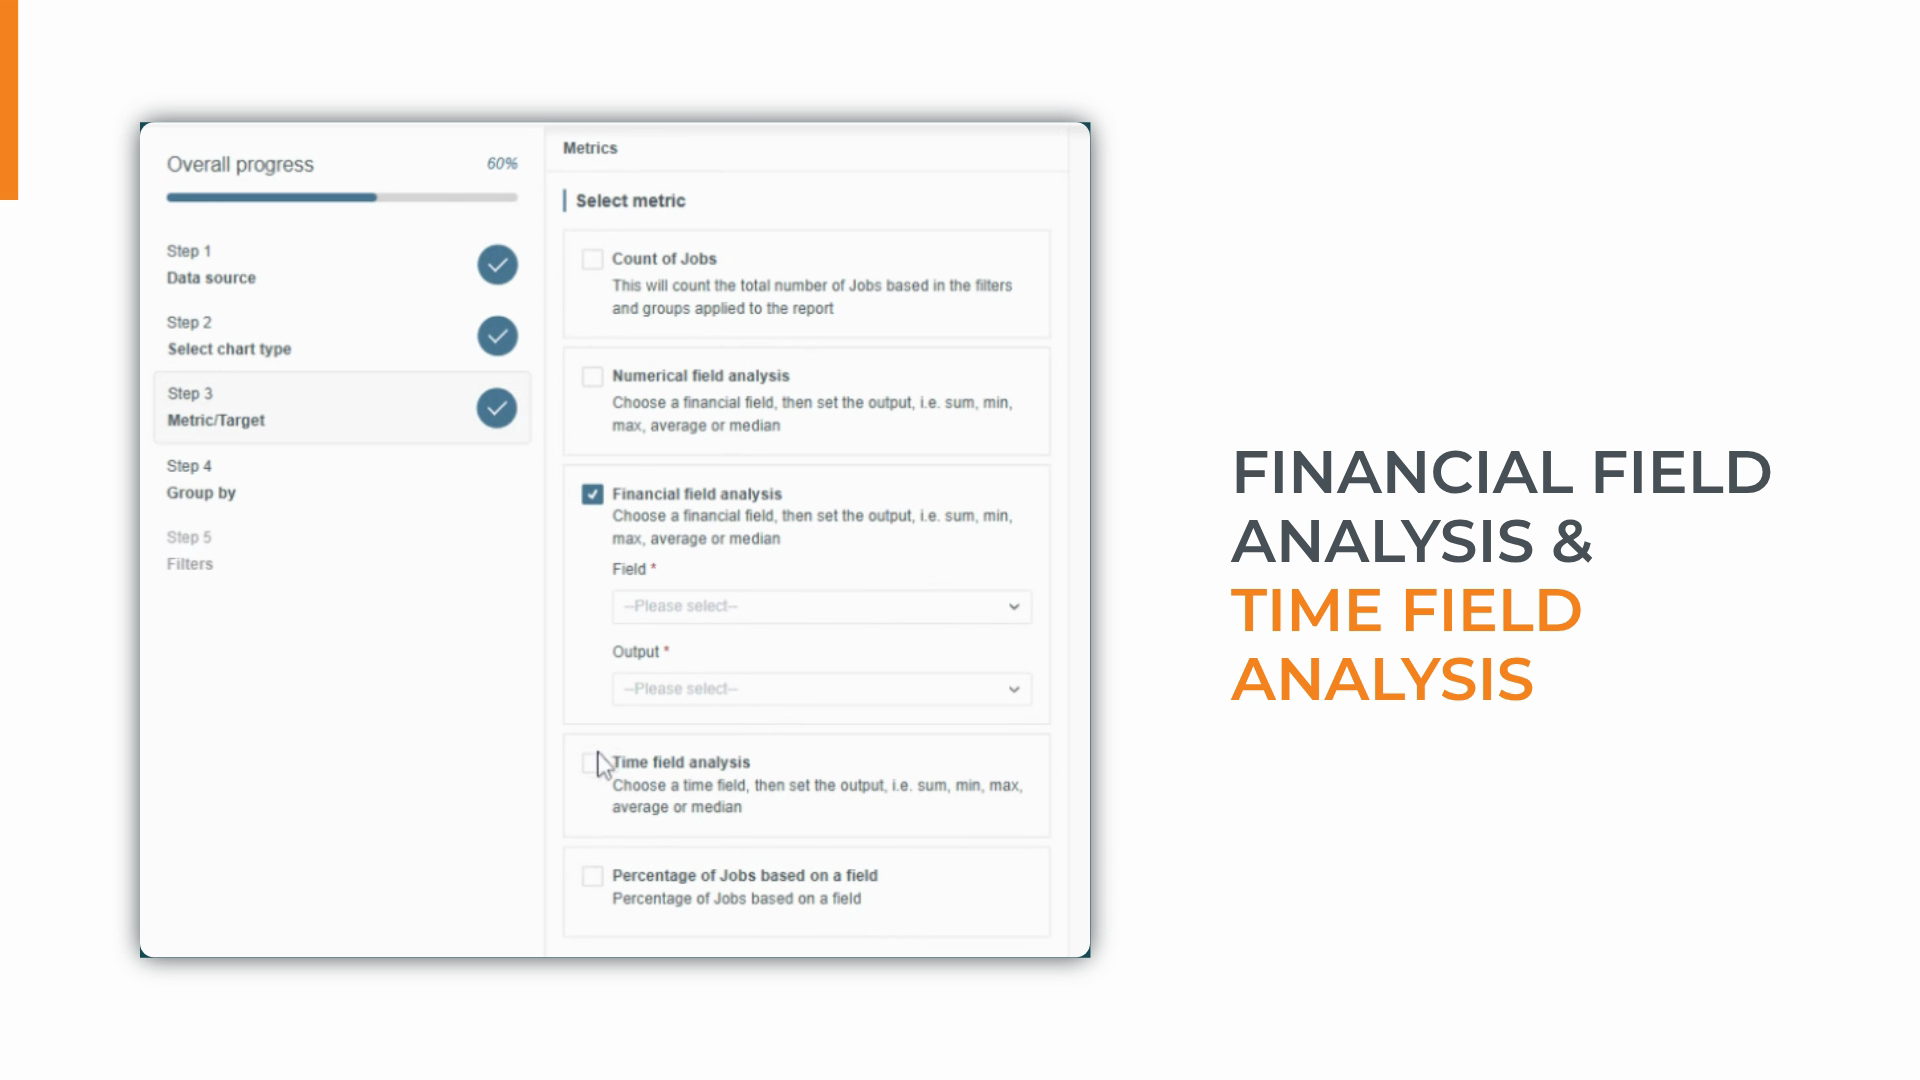
Financial Field Analysis: Focus on job costs or revenue to monitor margins.
Time Field Analysis: Calculate durations between workflow events, identifying bottlenecks or average turnaround times.
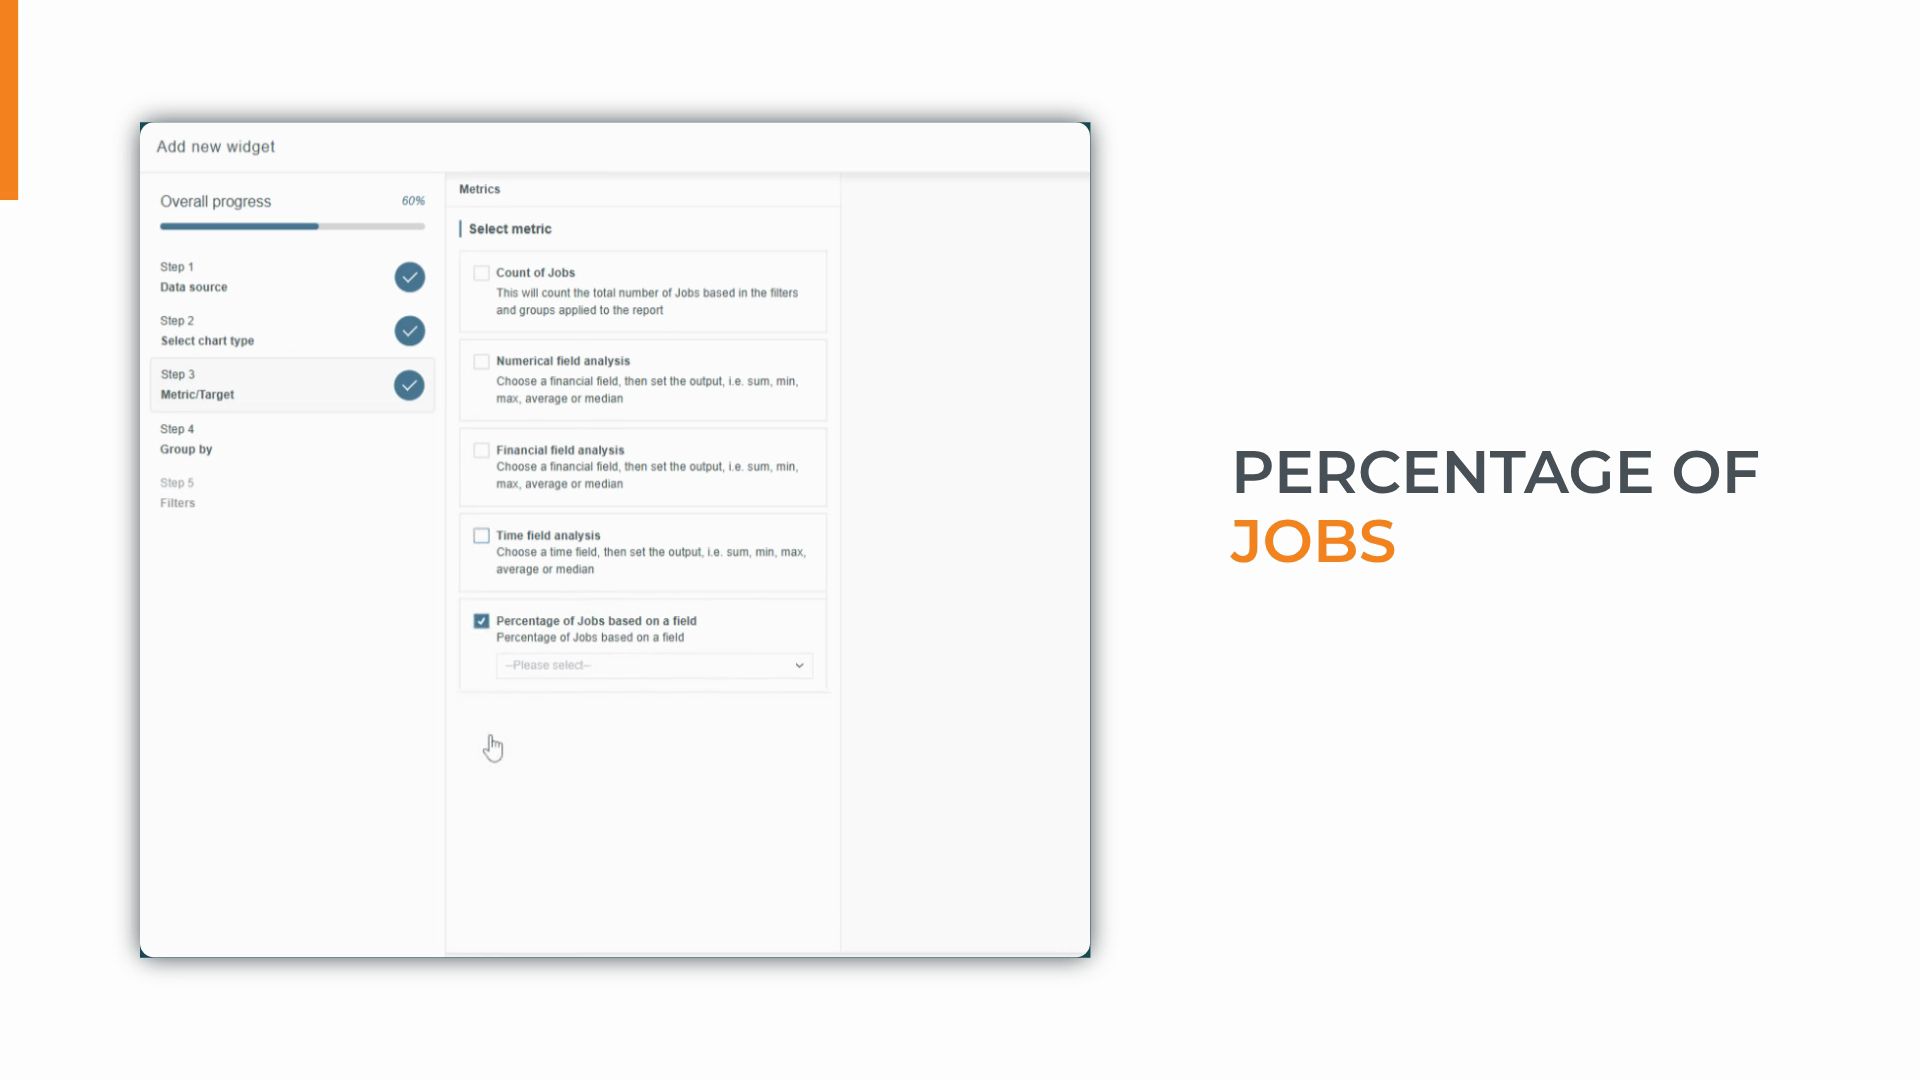
Percentage of Jobs: Measure compliance, such as jobs missing crucial access details.
For “Jobs Created by Month,” select Count of Jobs.
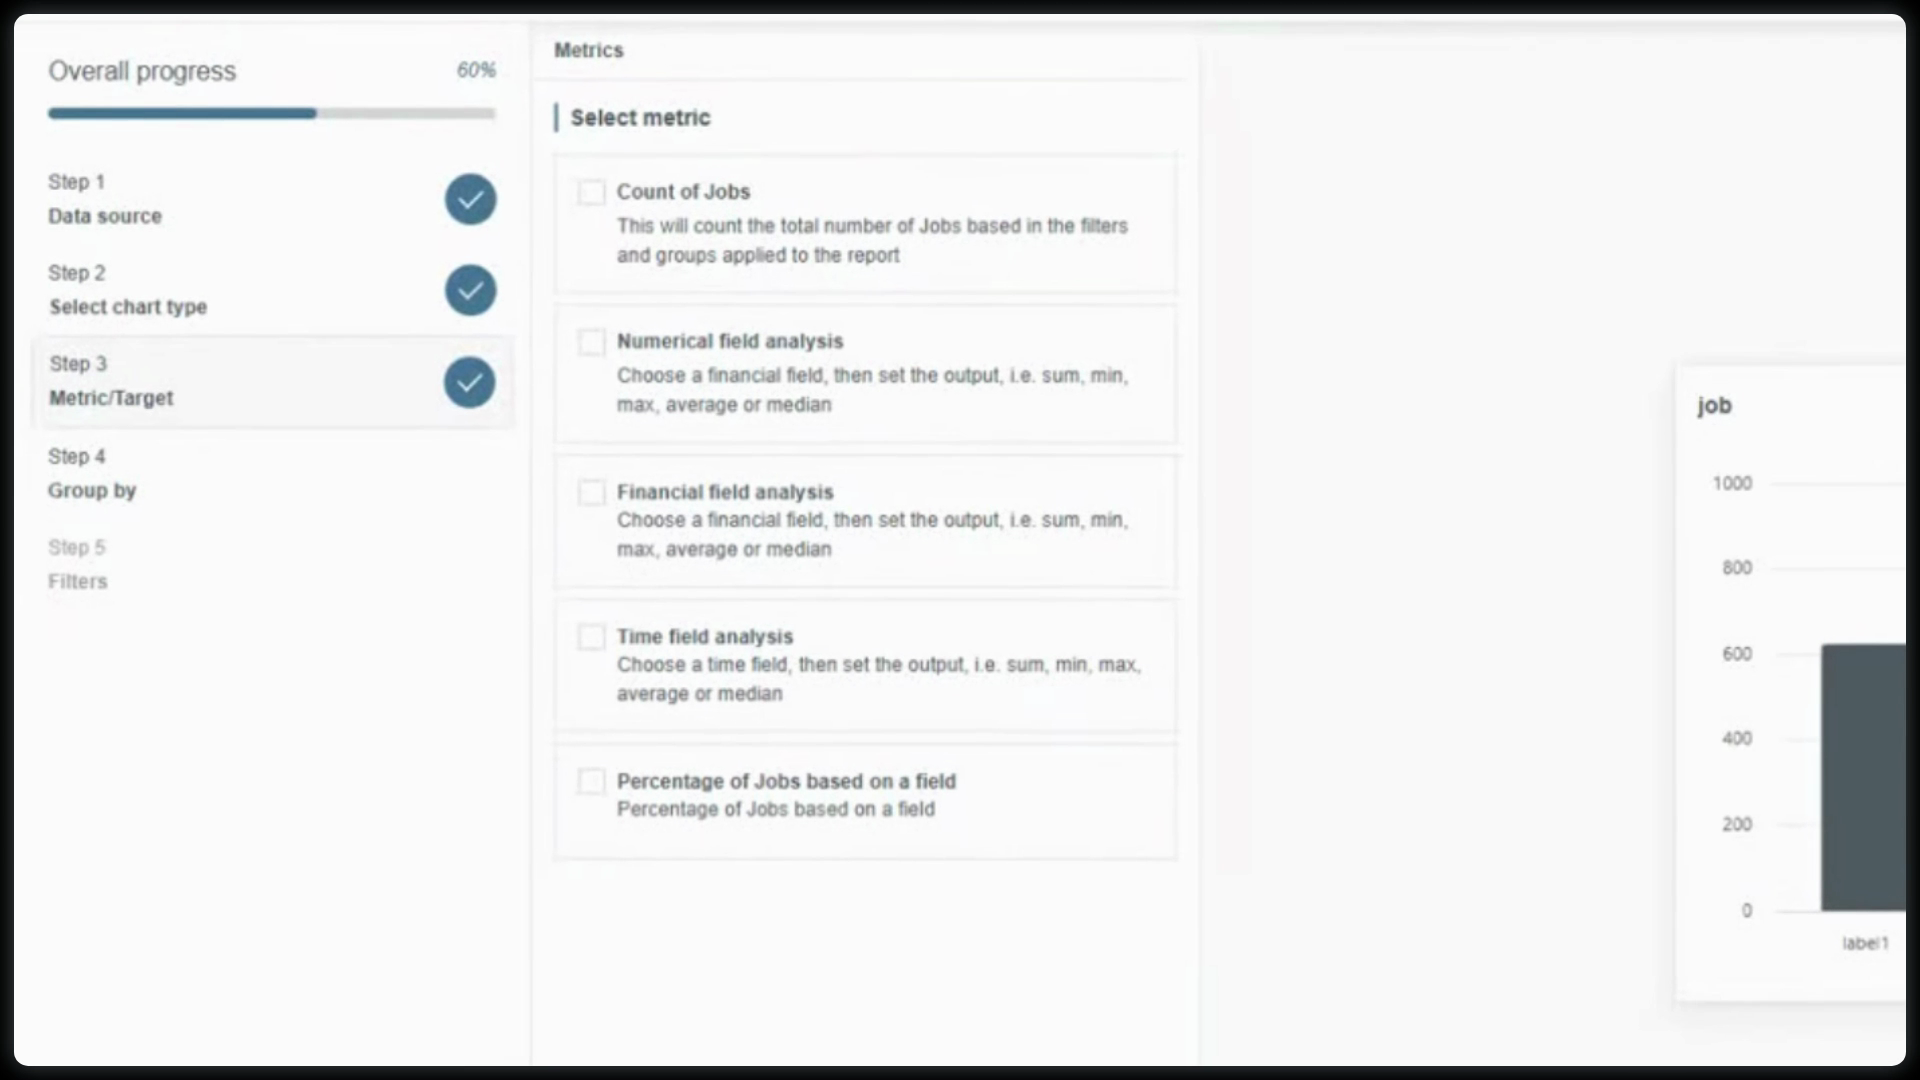
You can revisit this step to update your calculation as your needs change.
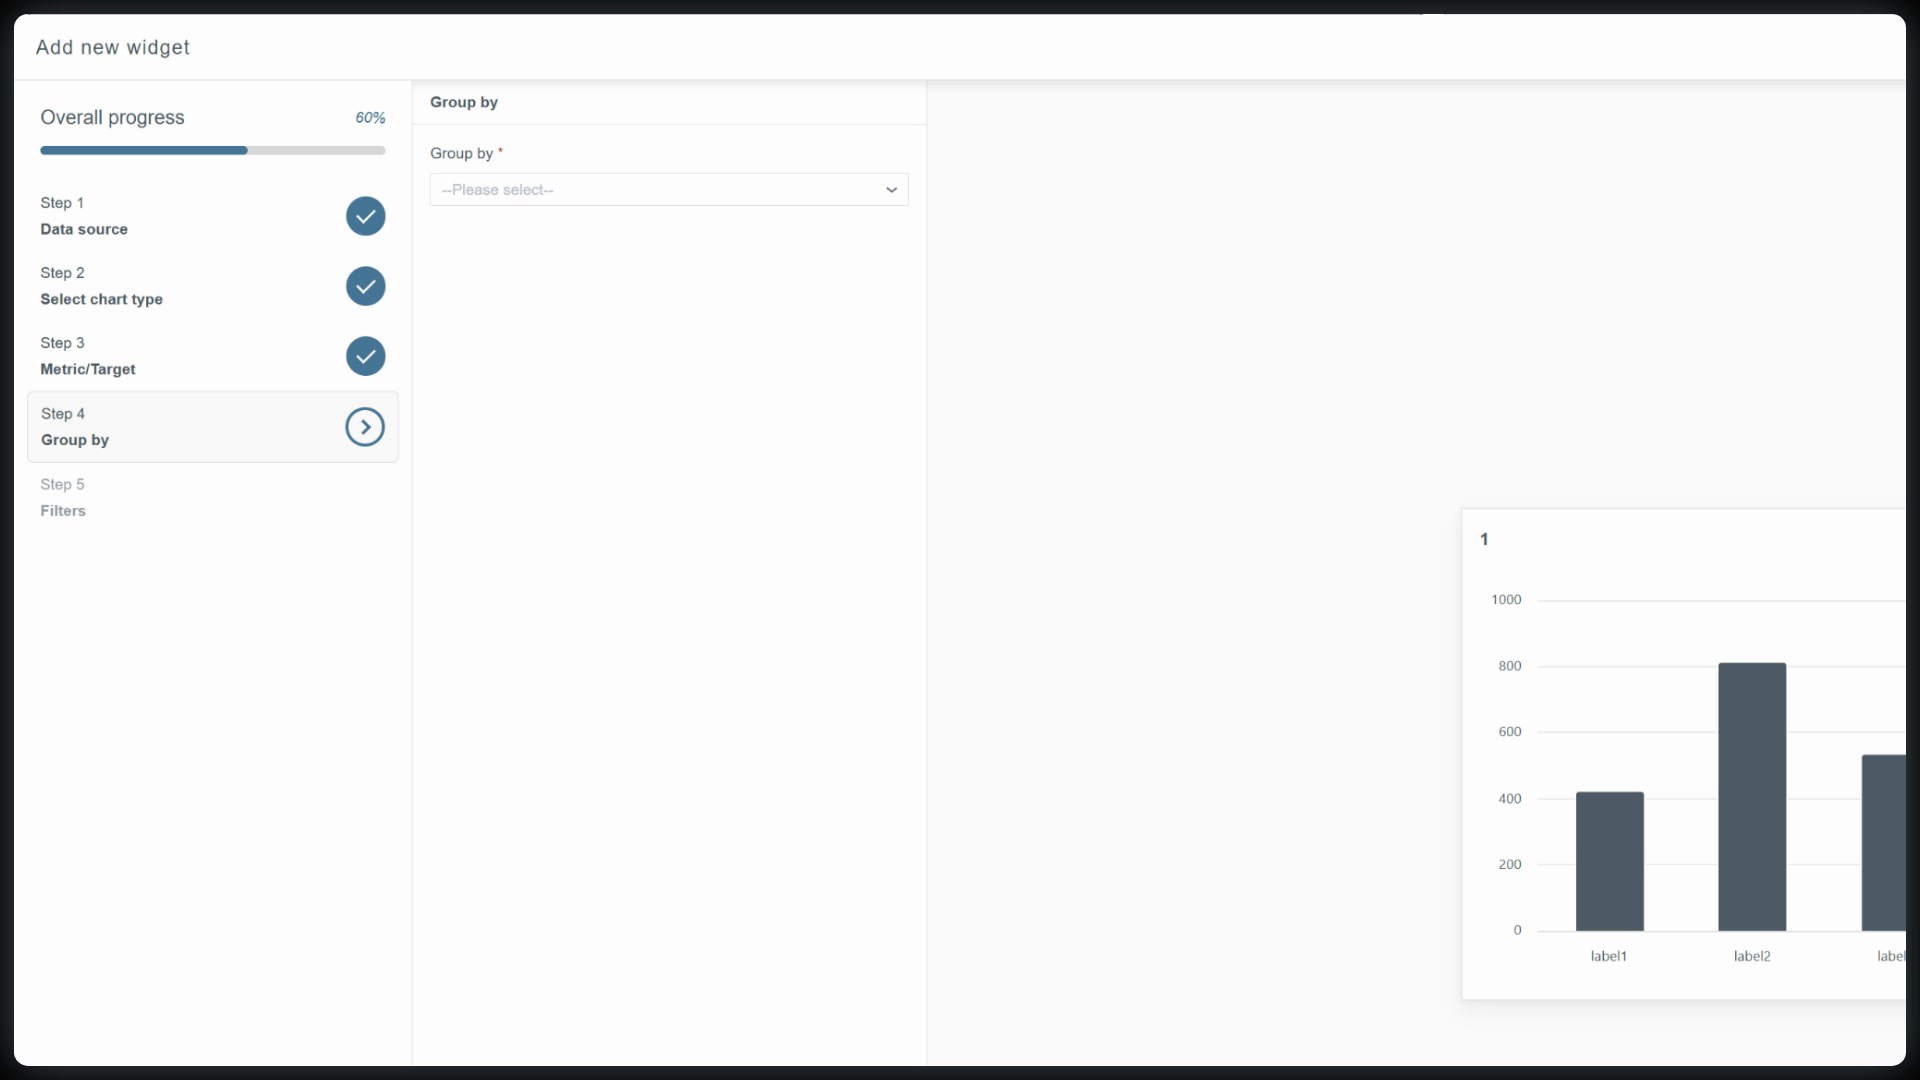
Step 4: Group by.
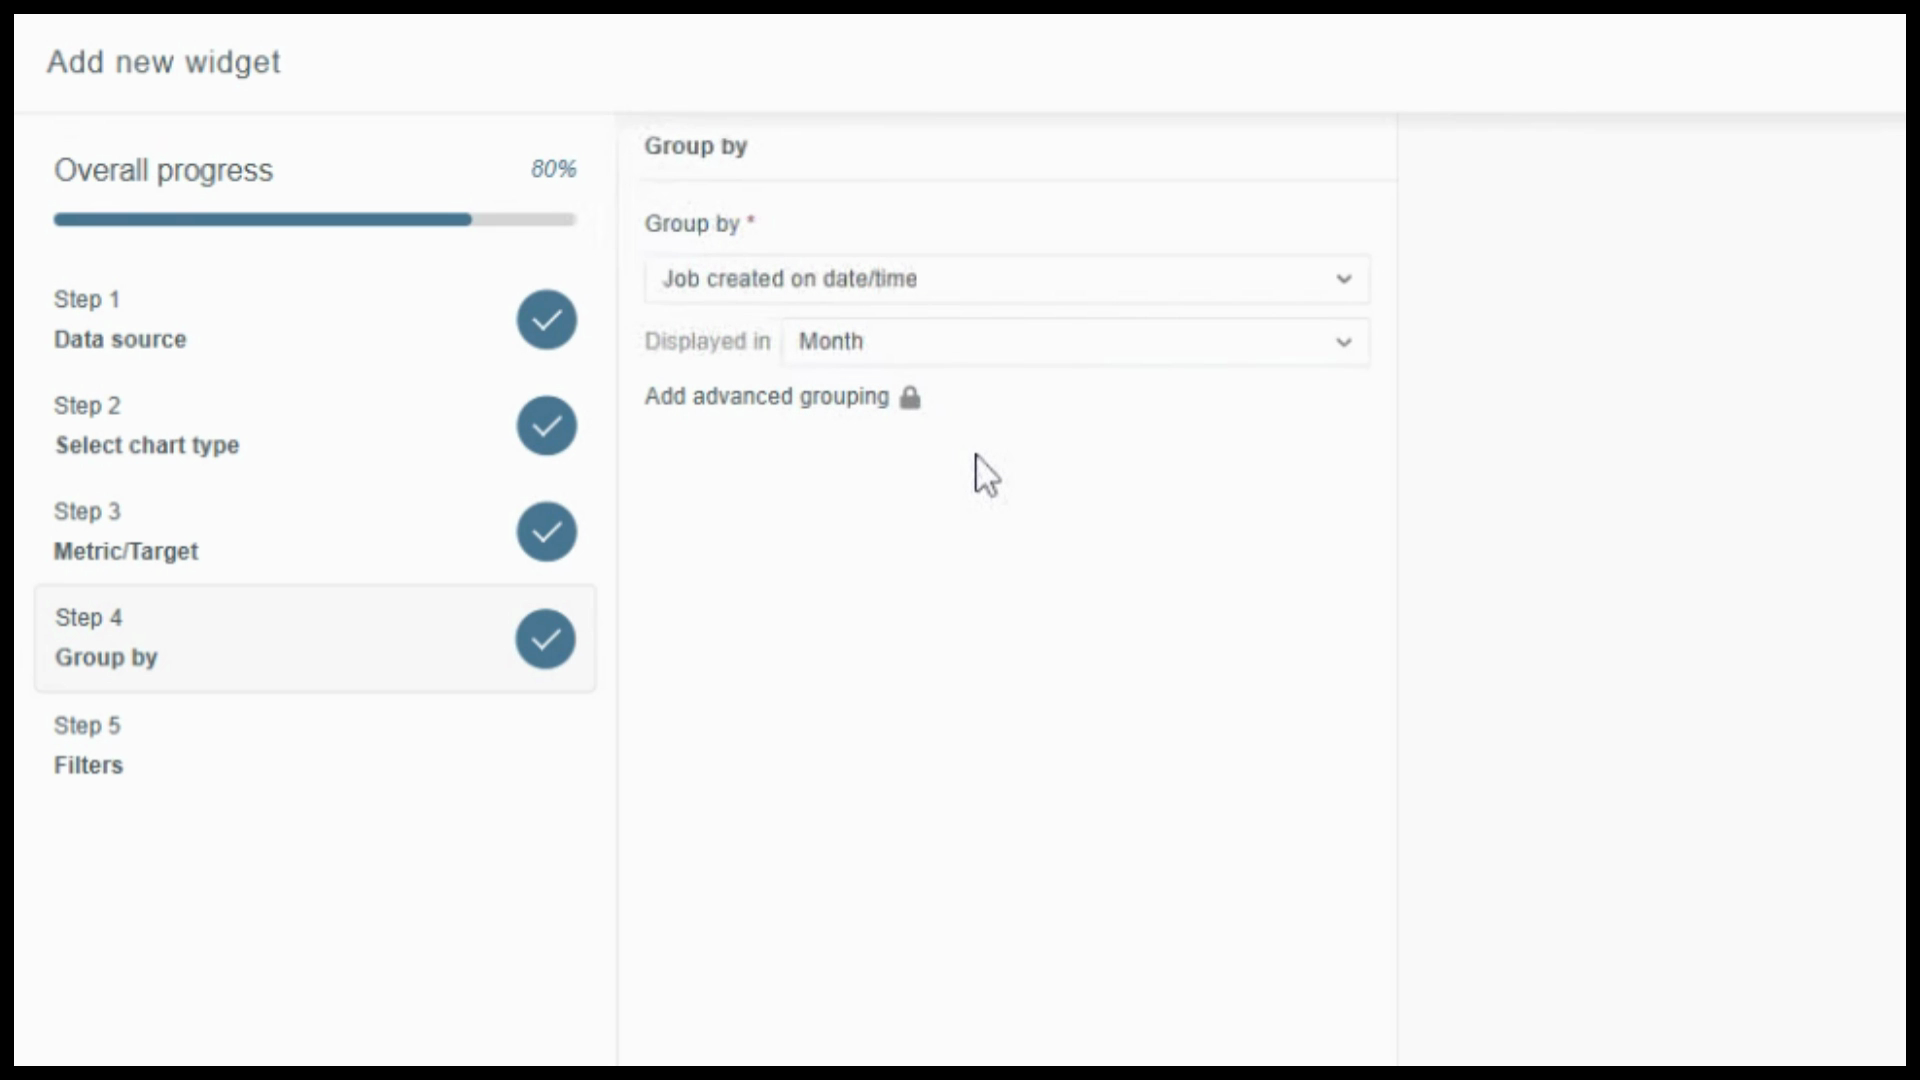
Define how data appears on the chart’s axis. You’ll see all fields connected to your chosen data source, from general dates to detailed job info.
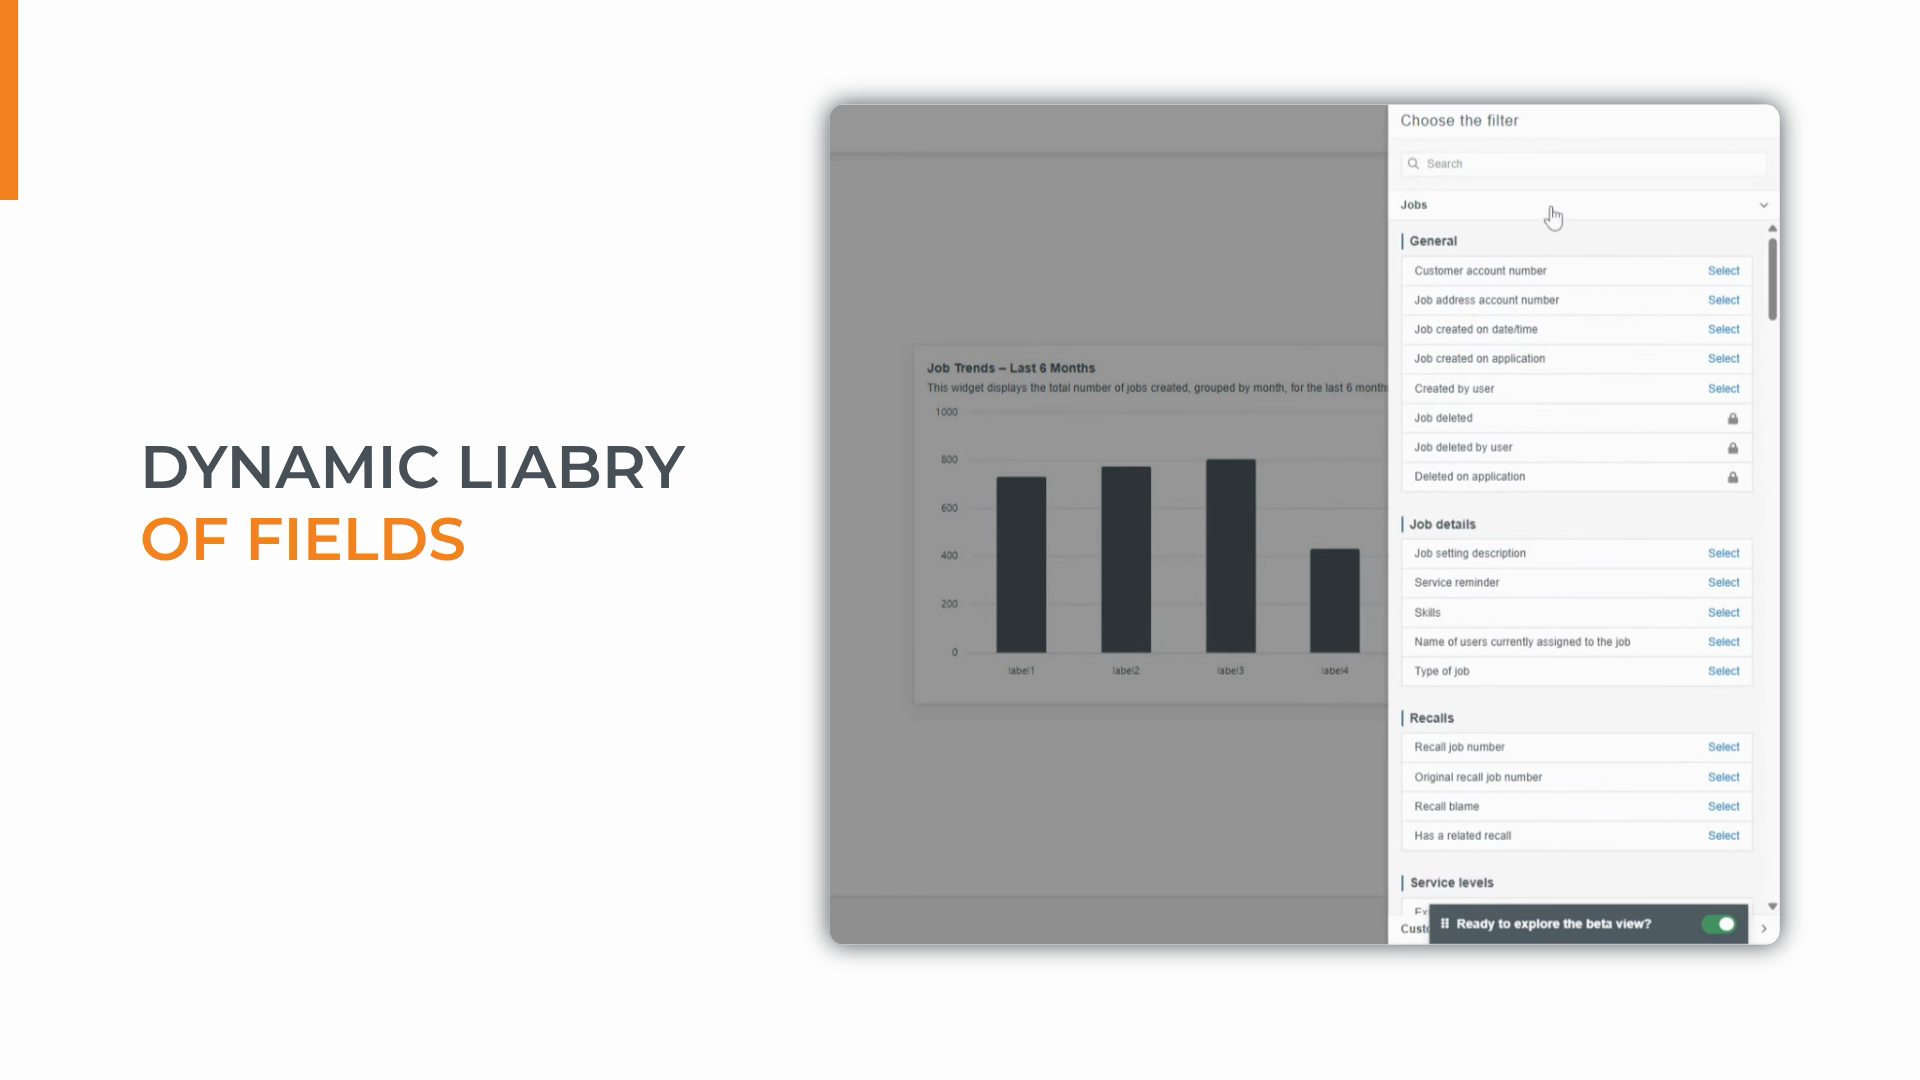
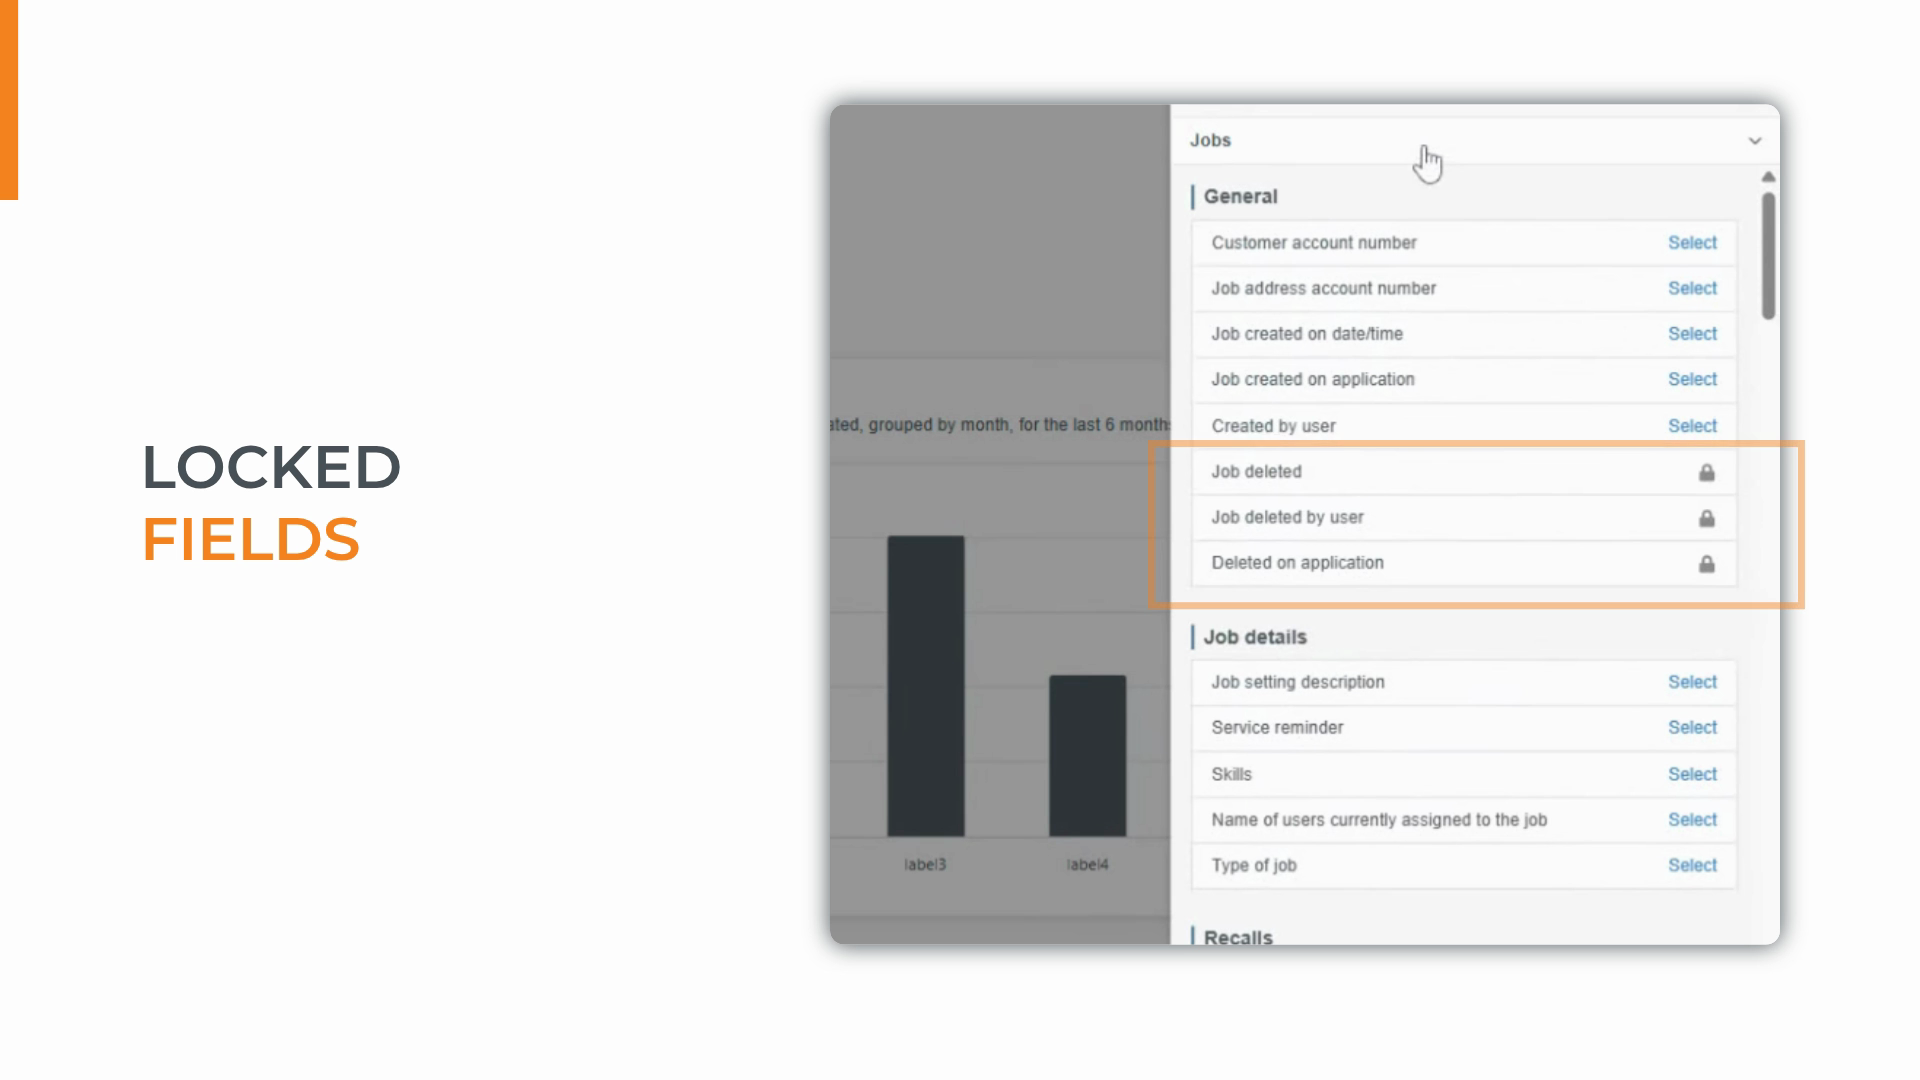
Fields with padlock icons are advanced data options for Analytics Plus.
To show volume over time, expand General and select Job created on date and time.
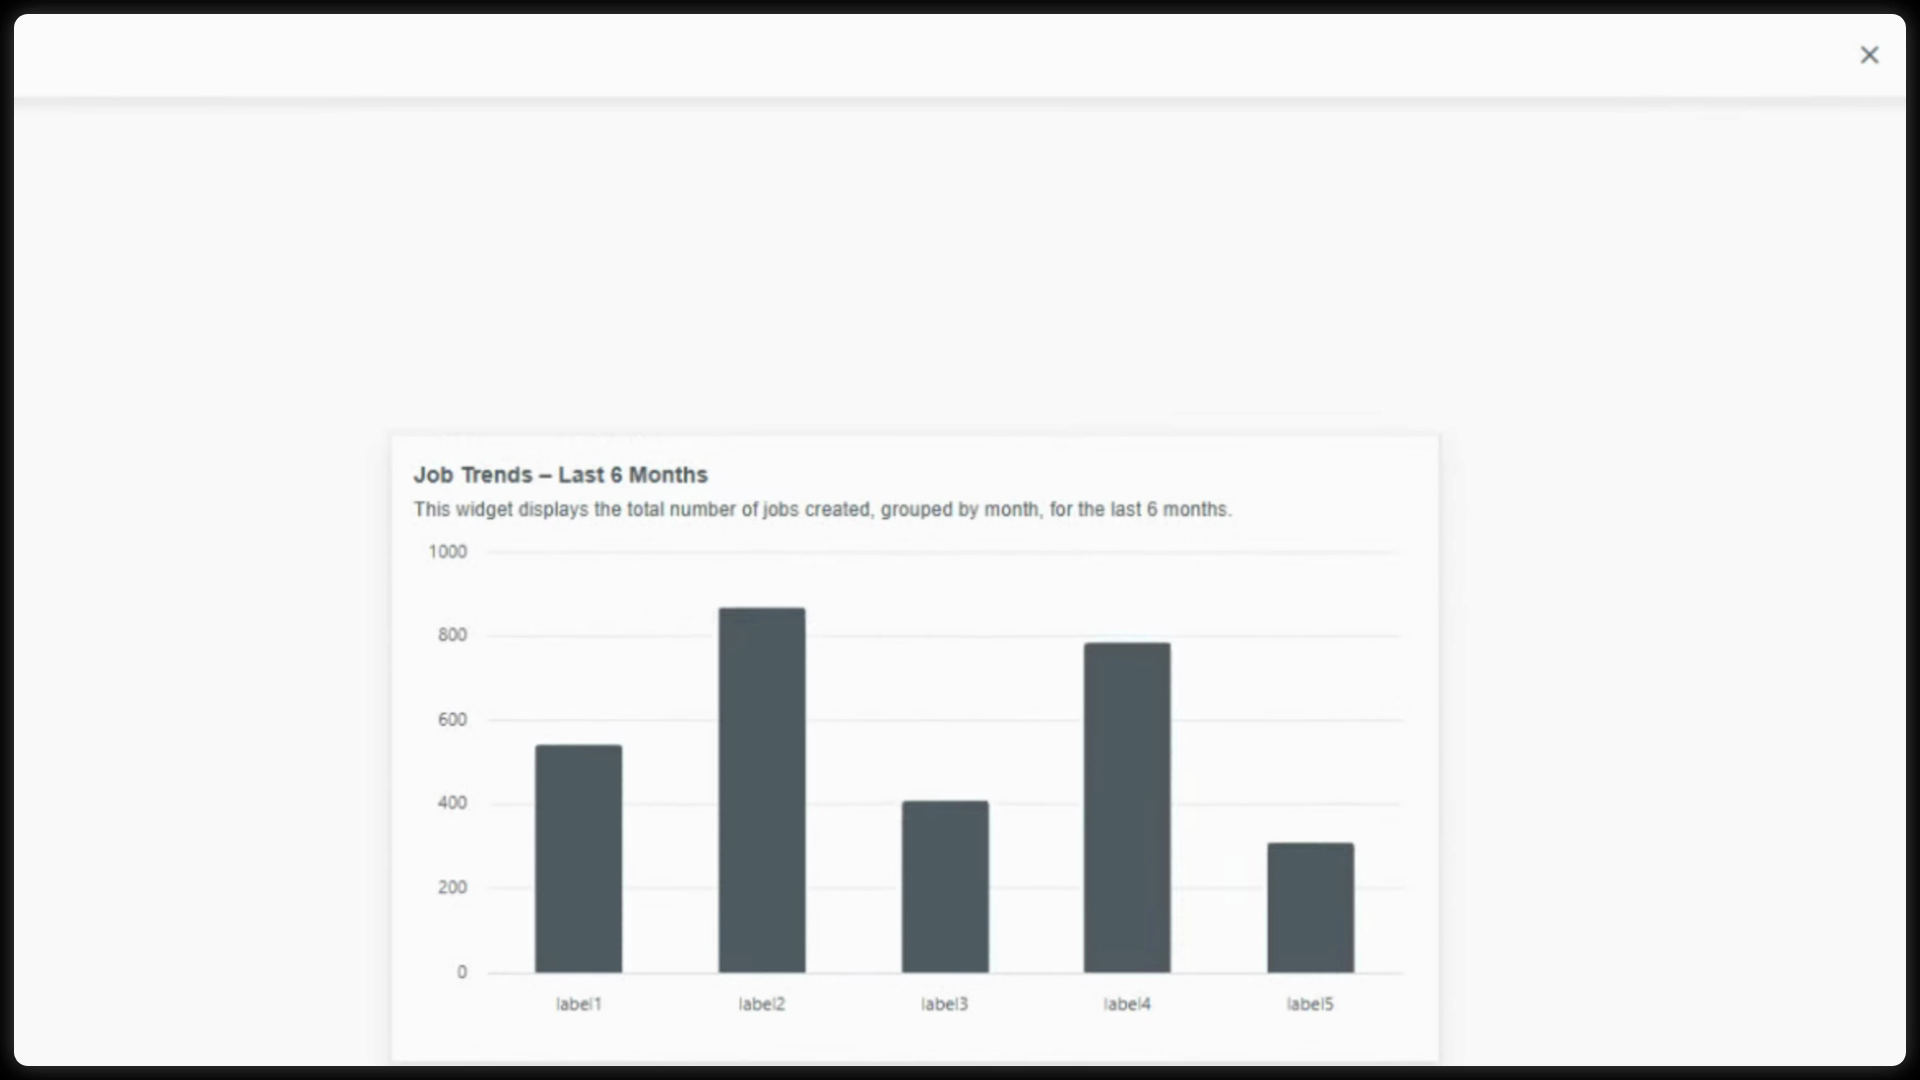
This groups your count chronologically, turning a flat number into a dynamic visual trend.
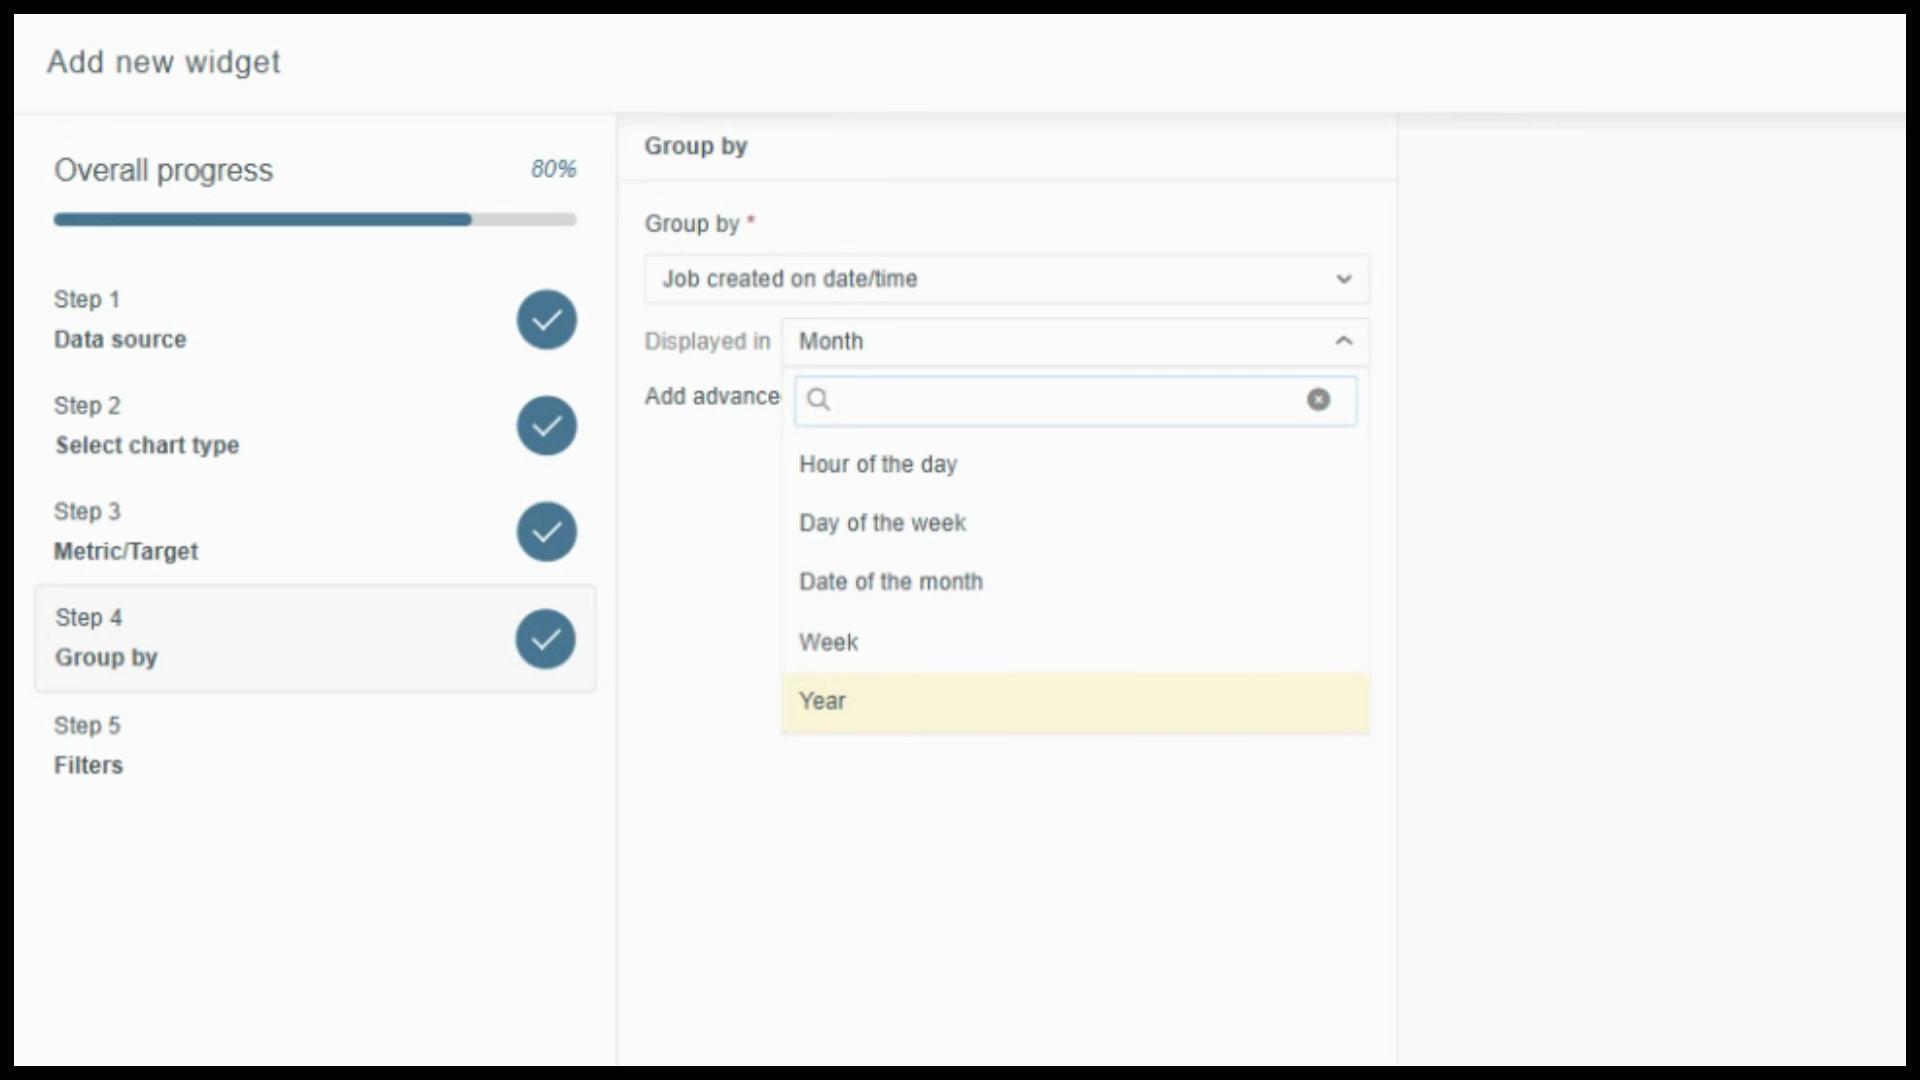
Once you pick a date field, set the time granularity—day, week, month, or year—using the displayed in dropdown. For a clear trend, choose Month.
Step 5: Apply filters.
Filters keep your data focused and actionable. Start with the Master Date Filter to control the tracked event and timeframe—set it to “Job created on date and time: last six months.”
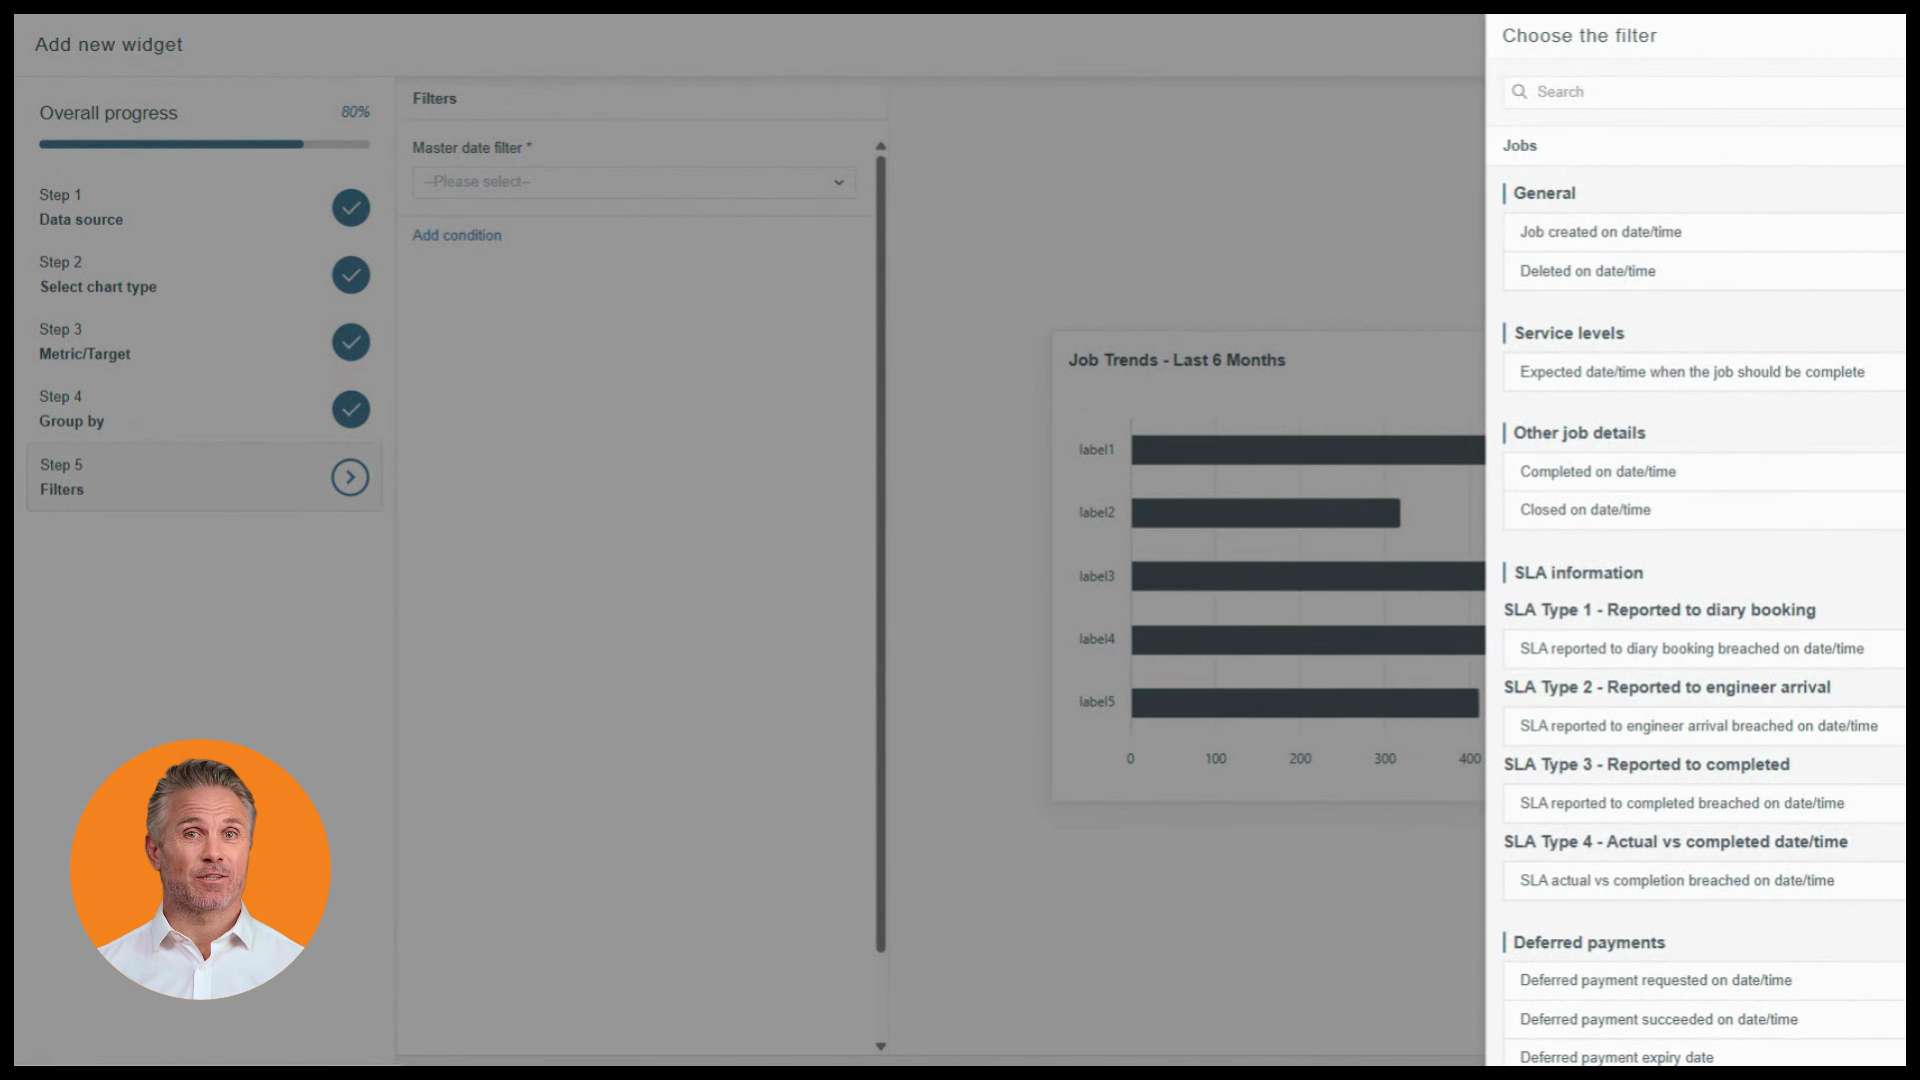
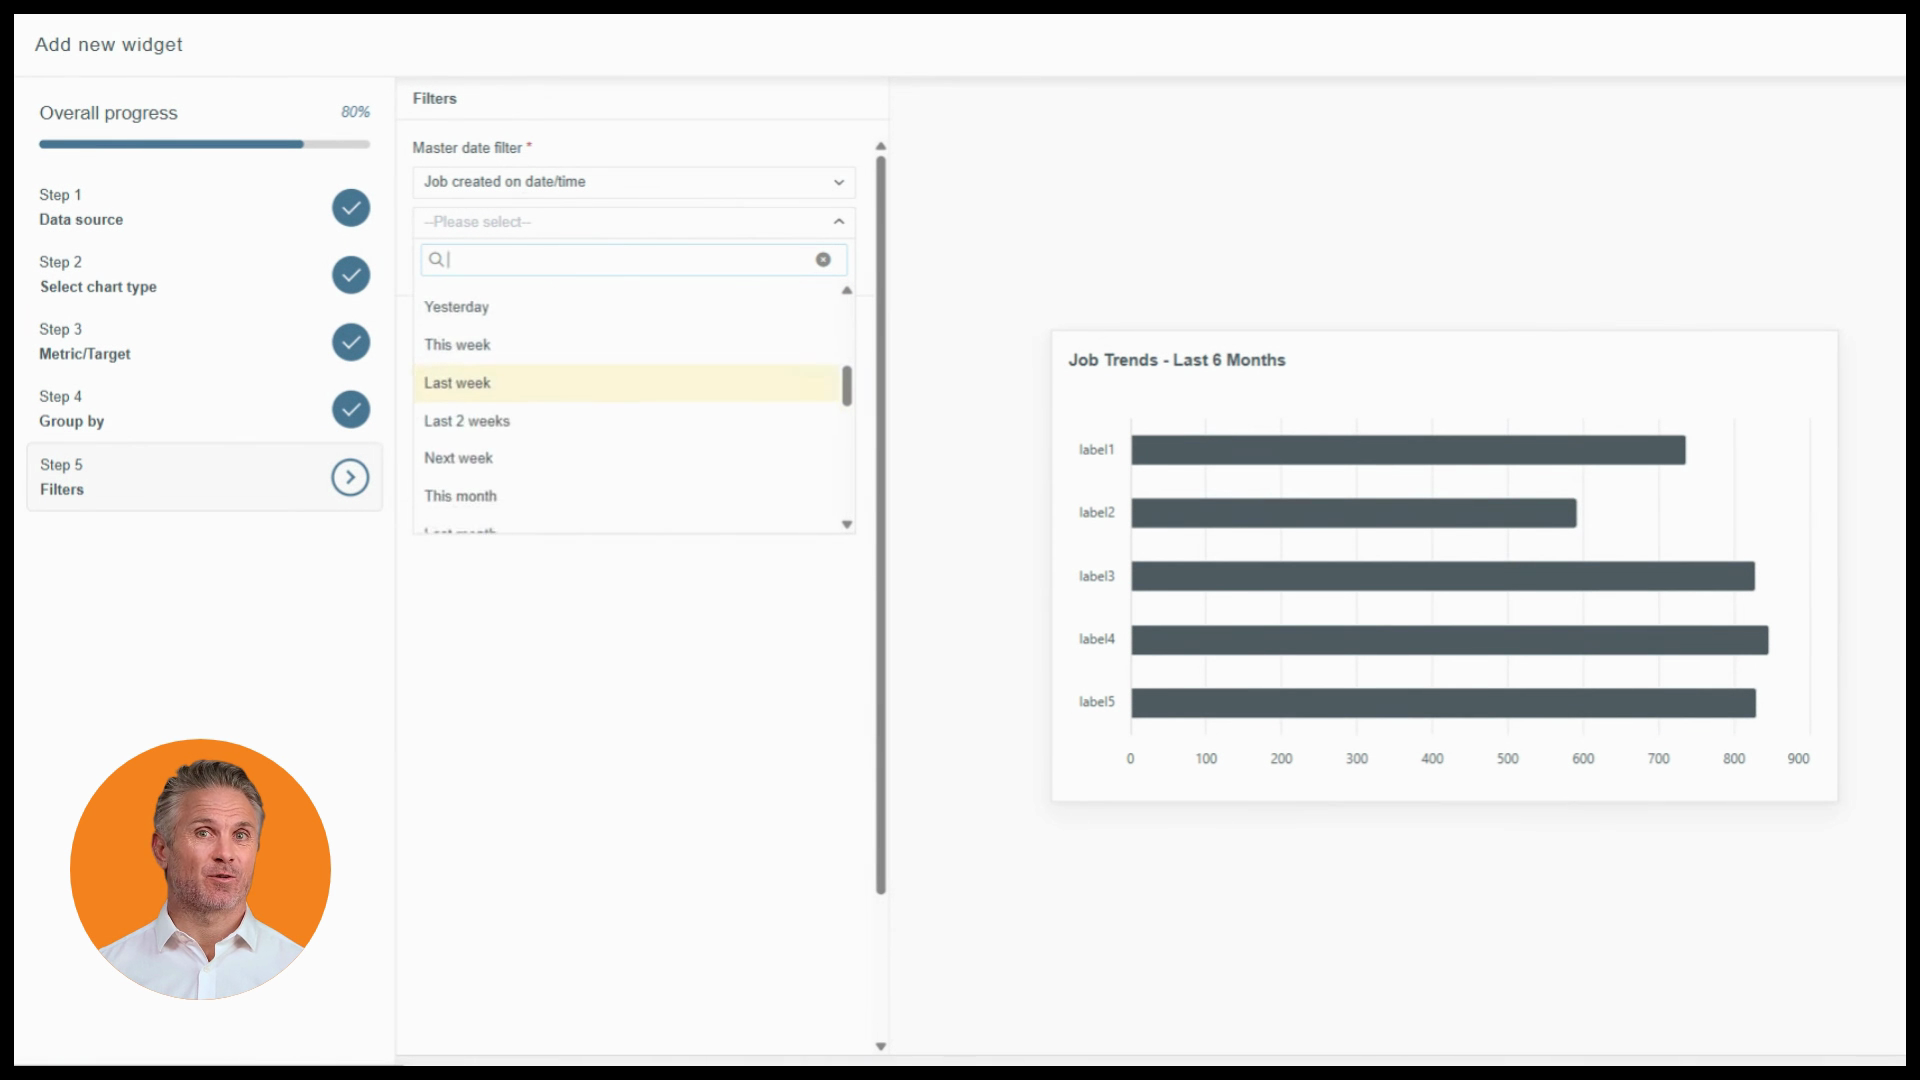
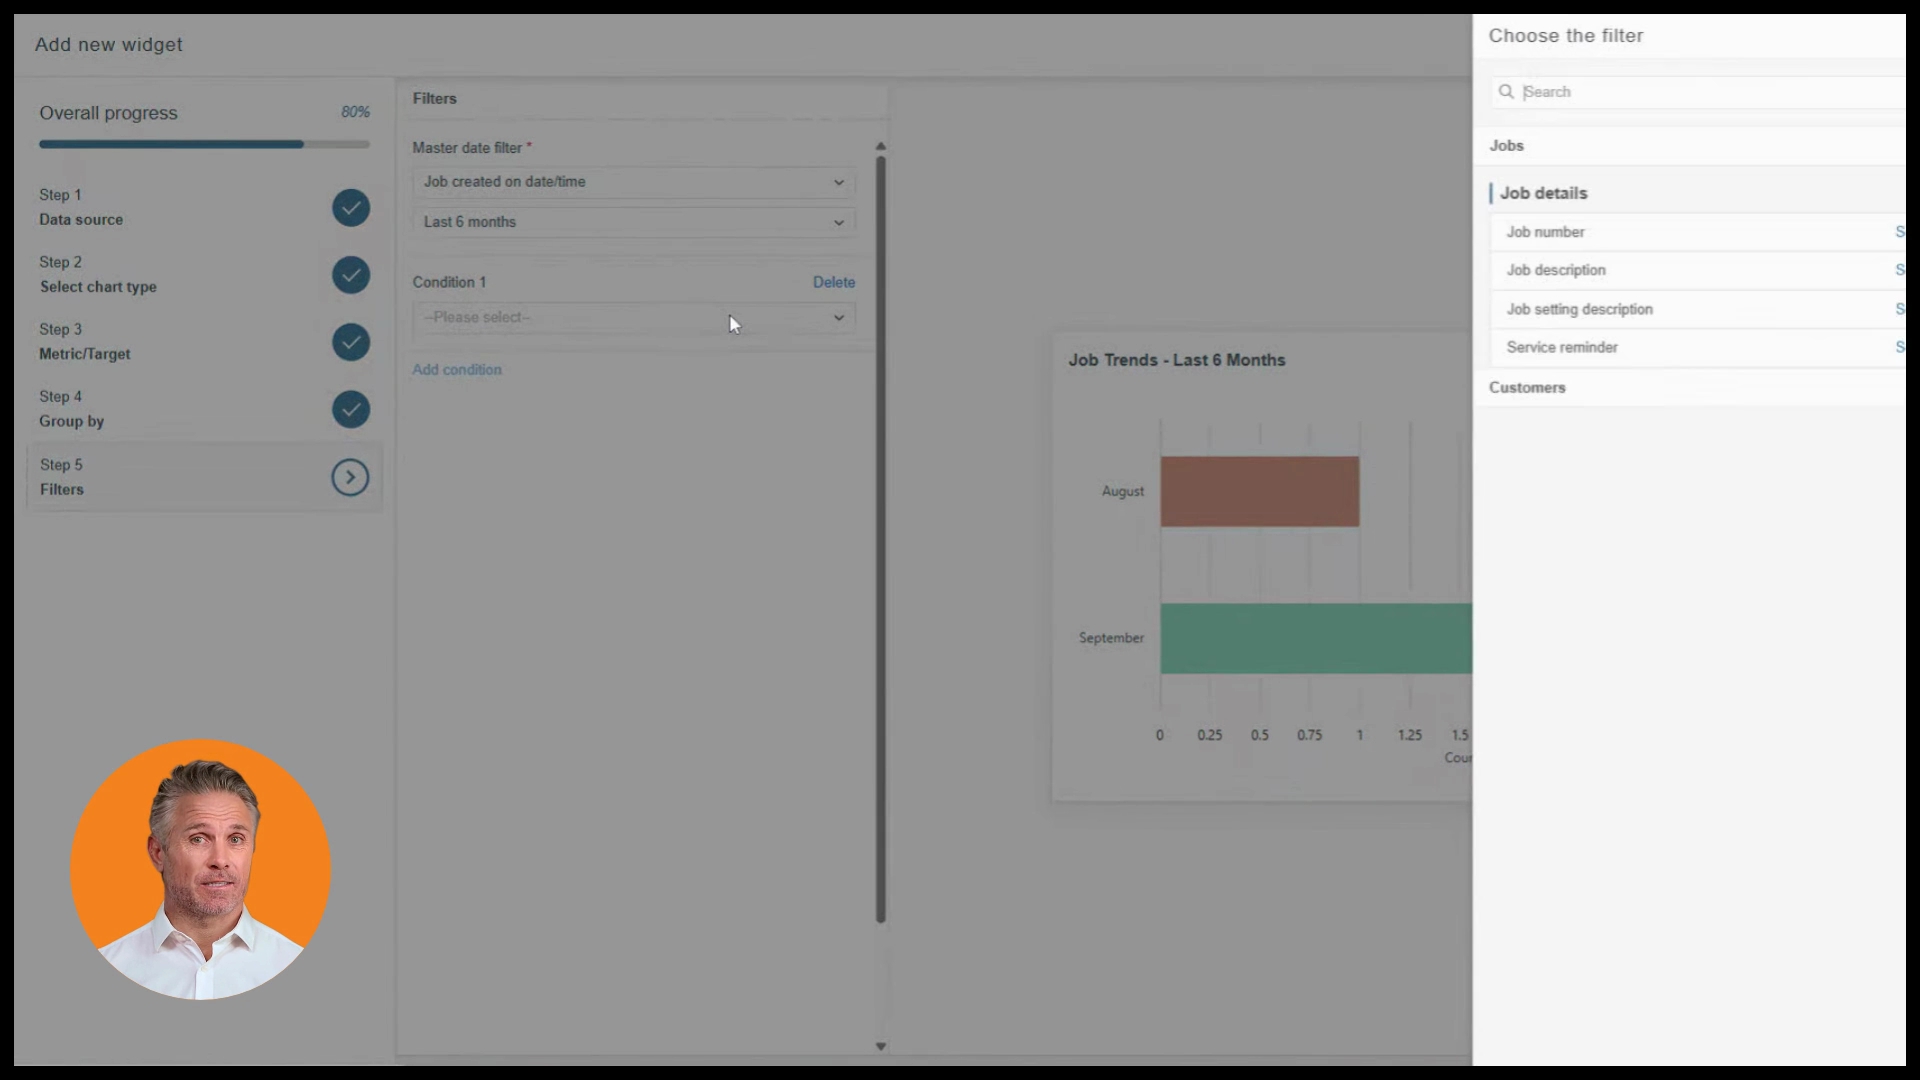
To refine more, use Add Condition. For example, limit results to only closed and completed jobs. Watch your chart update live as you adjust each setting.
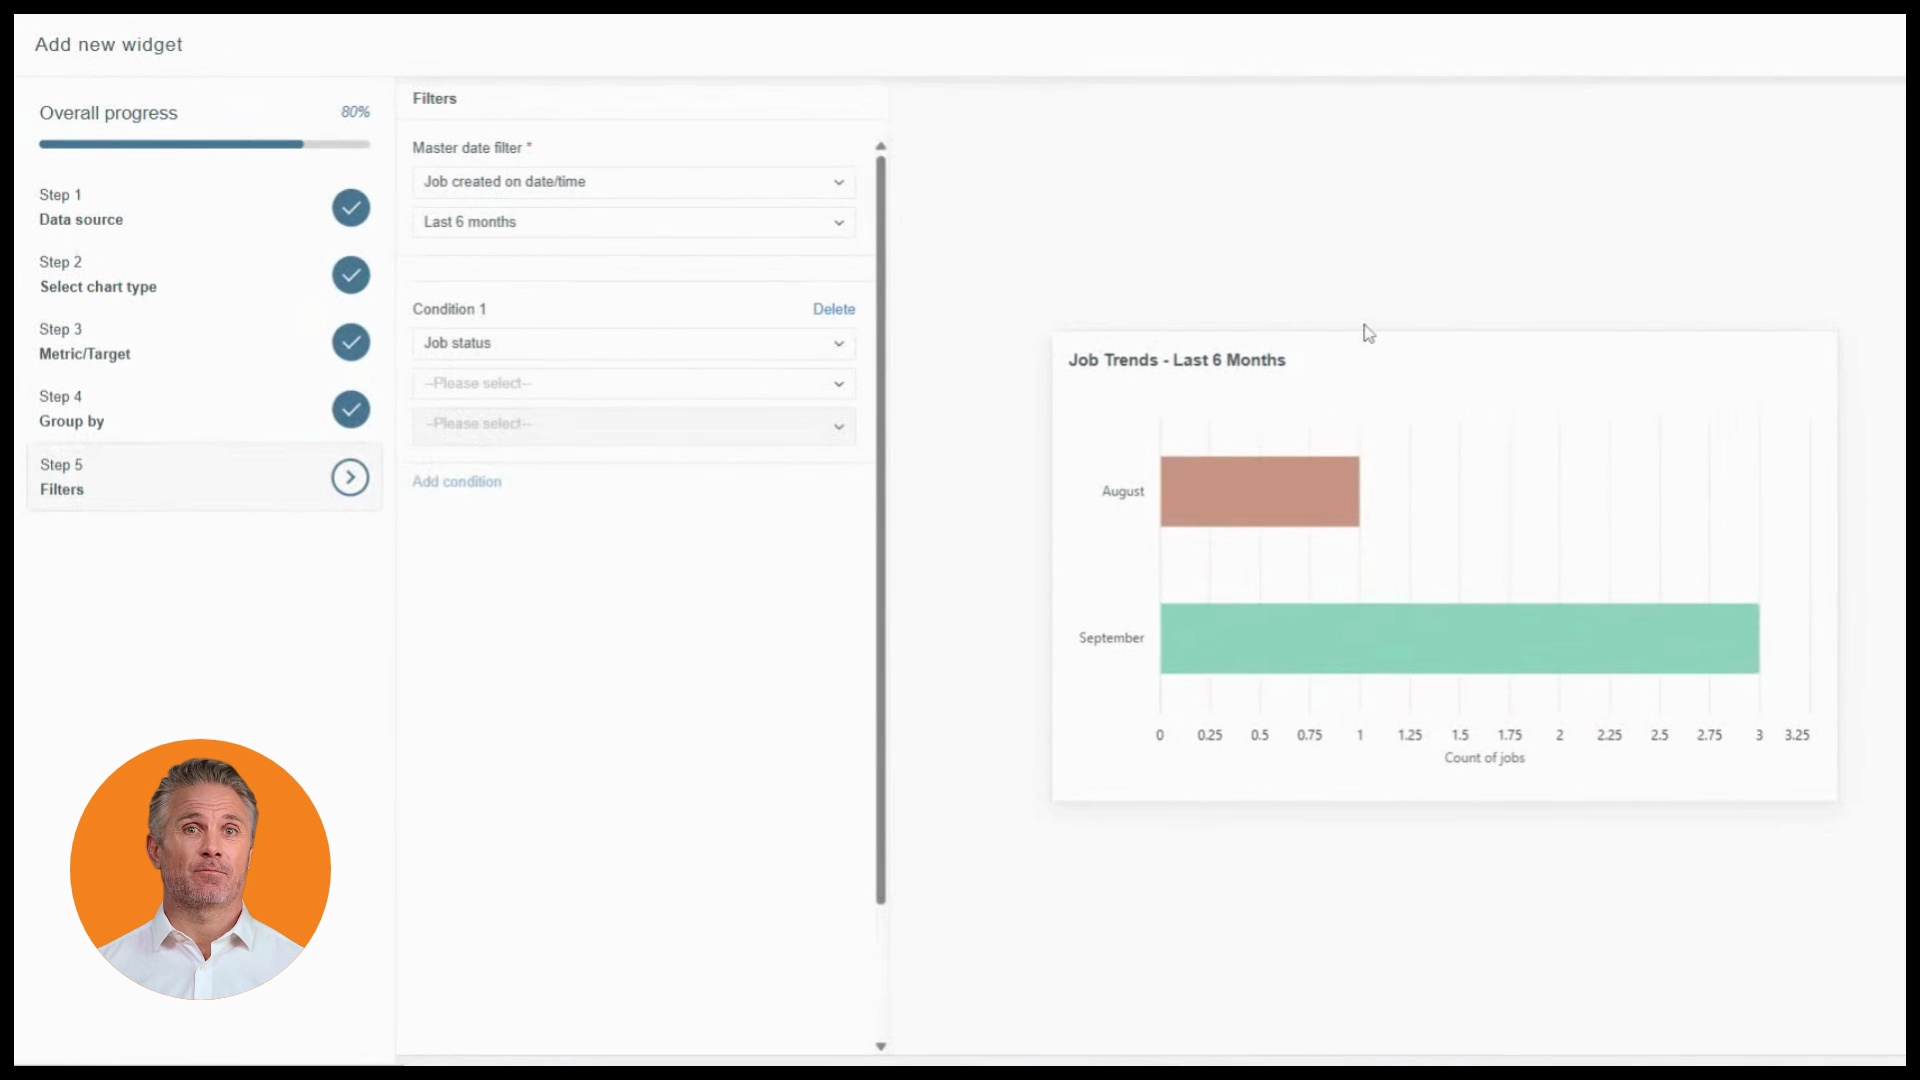
When your widget preview looks right, click Save.
Your custom widget is now live. The column chart instantly shows job volume patterns—whether you’re seeing growth, dips, or stability—giving you the clarity to plan ahead instead of just reacting.
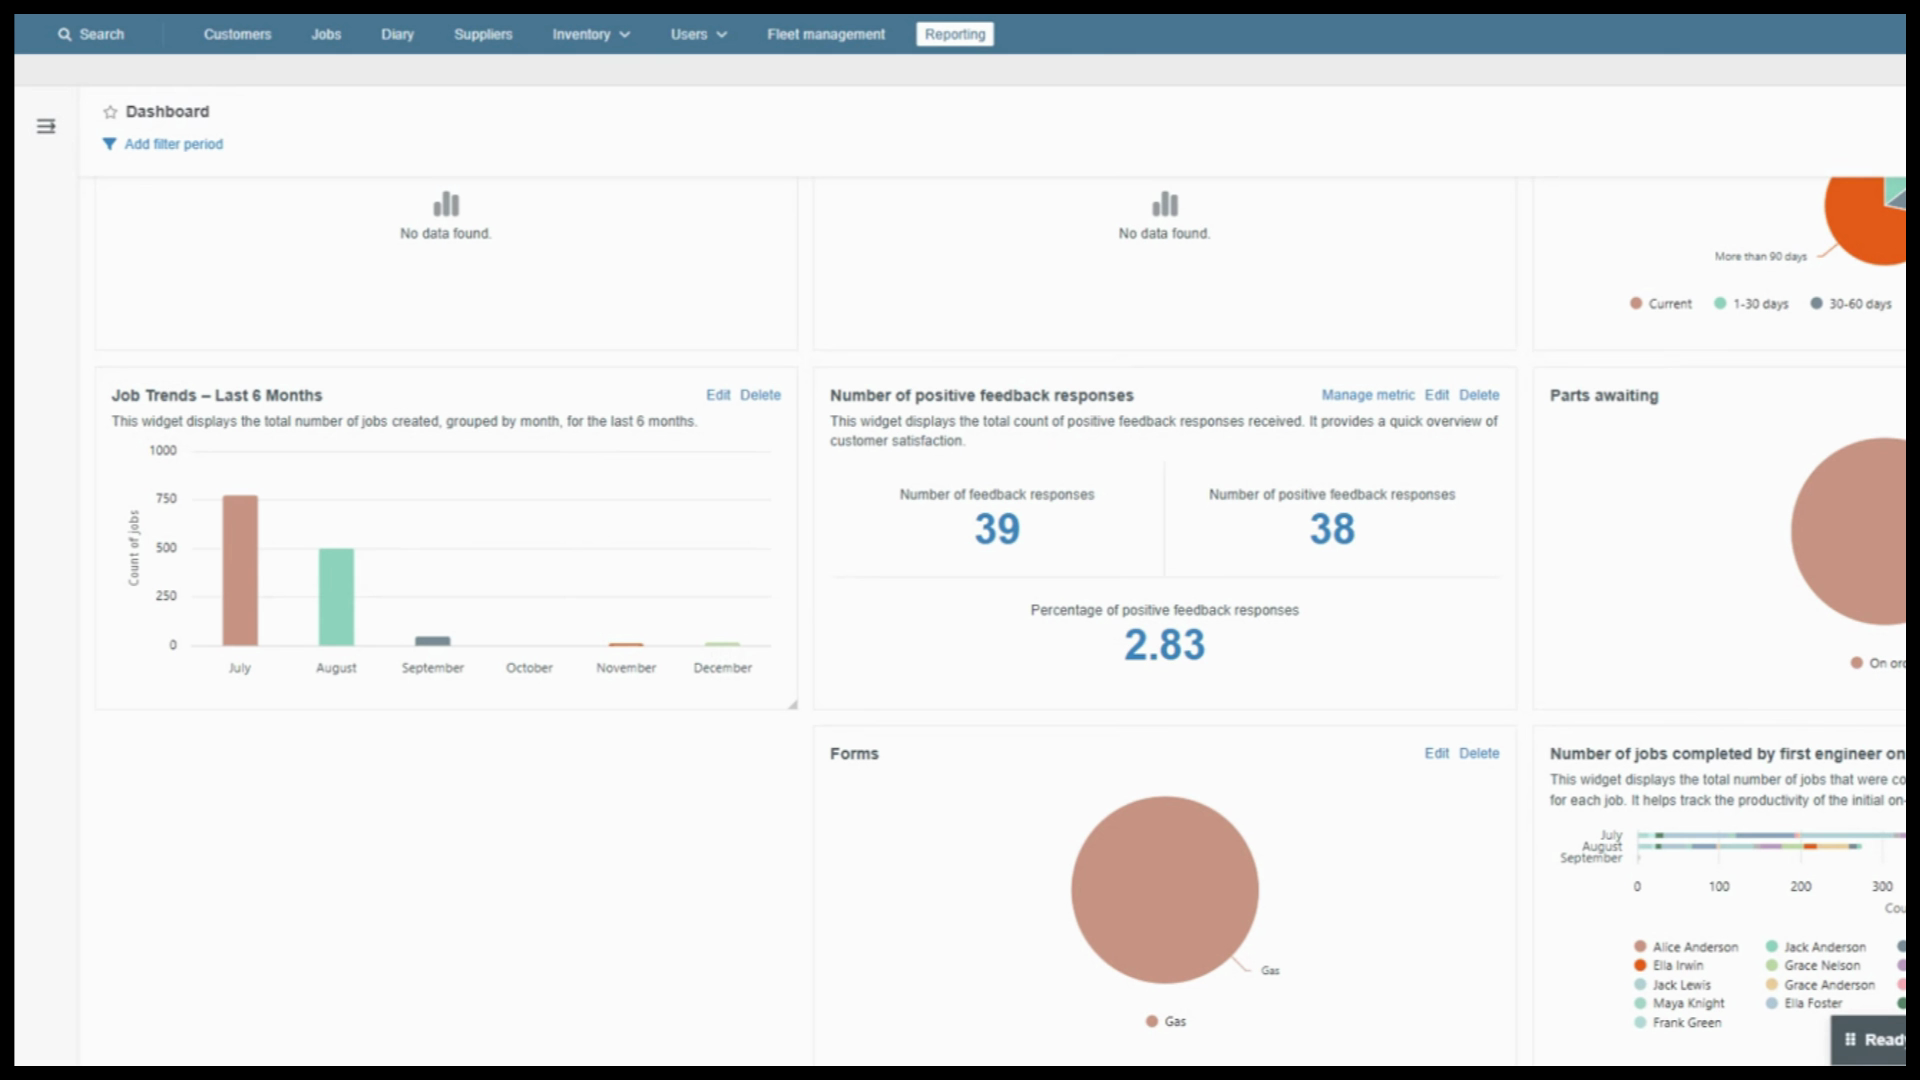
You’ve built a robust custom widget from scratch, leveraging every step: data source, chart type, metric, group by, and filter. Use this flexible tool to answer unique business questions and stay ahead of the curve.
Created on
Did you find this article helpful?