

Step seven is value after setting up the
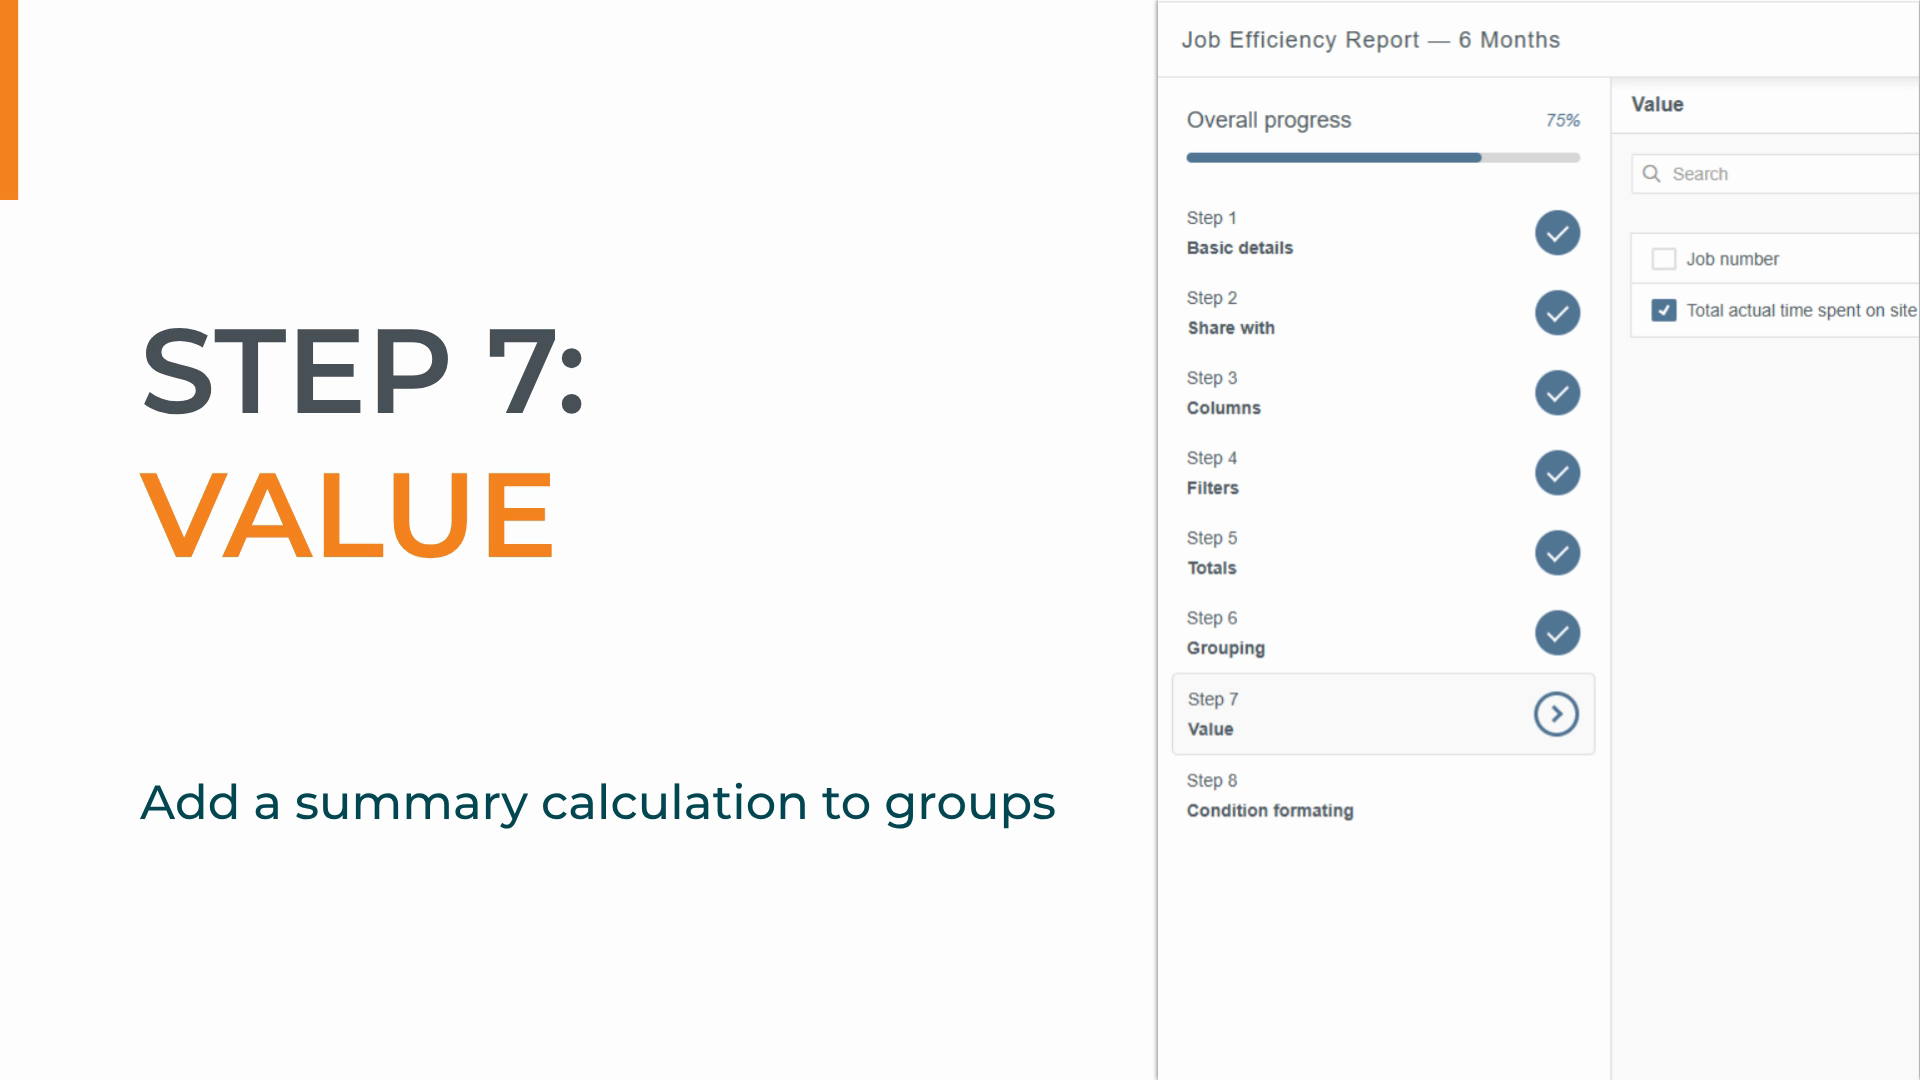
grouping, this step allows us to add a summary calculation to each group, giving us a quick total for each section without having to open and analyze every individual record.
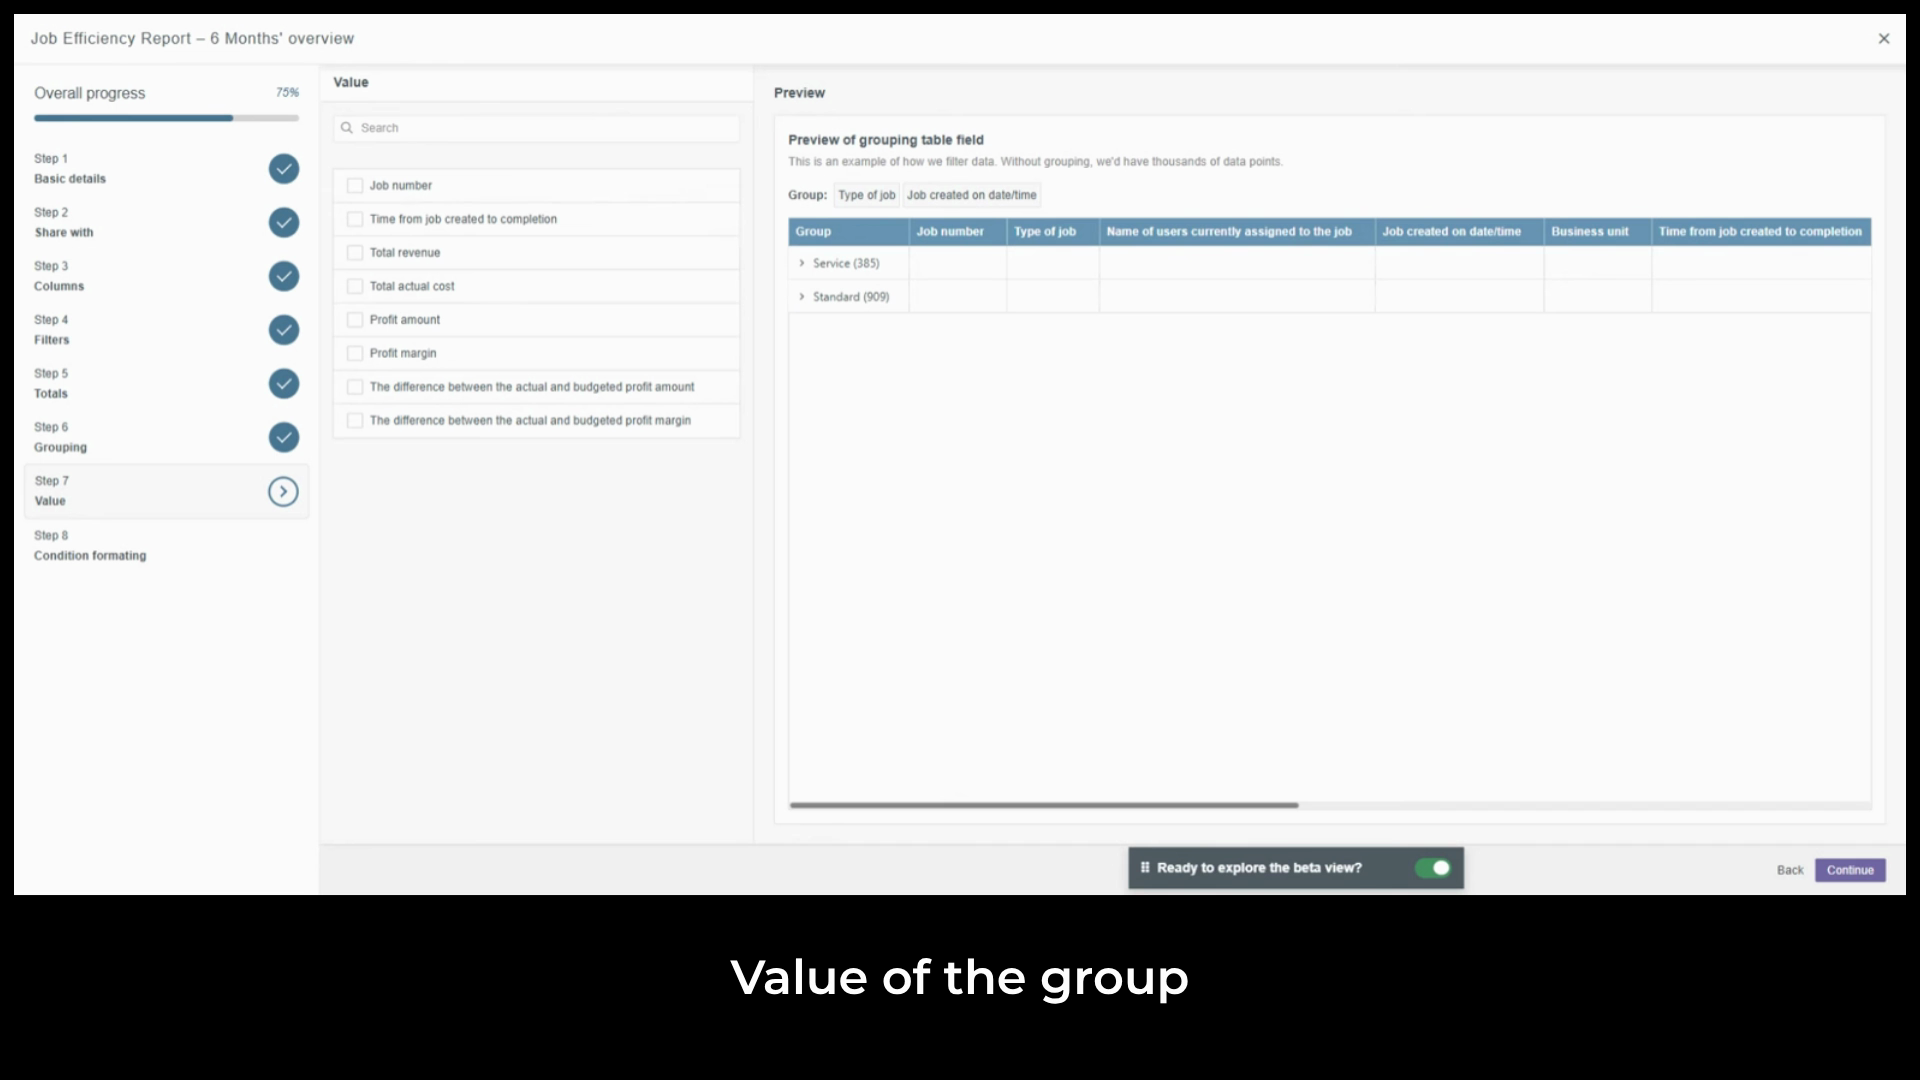
Select profit amount set to sum in the
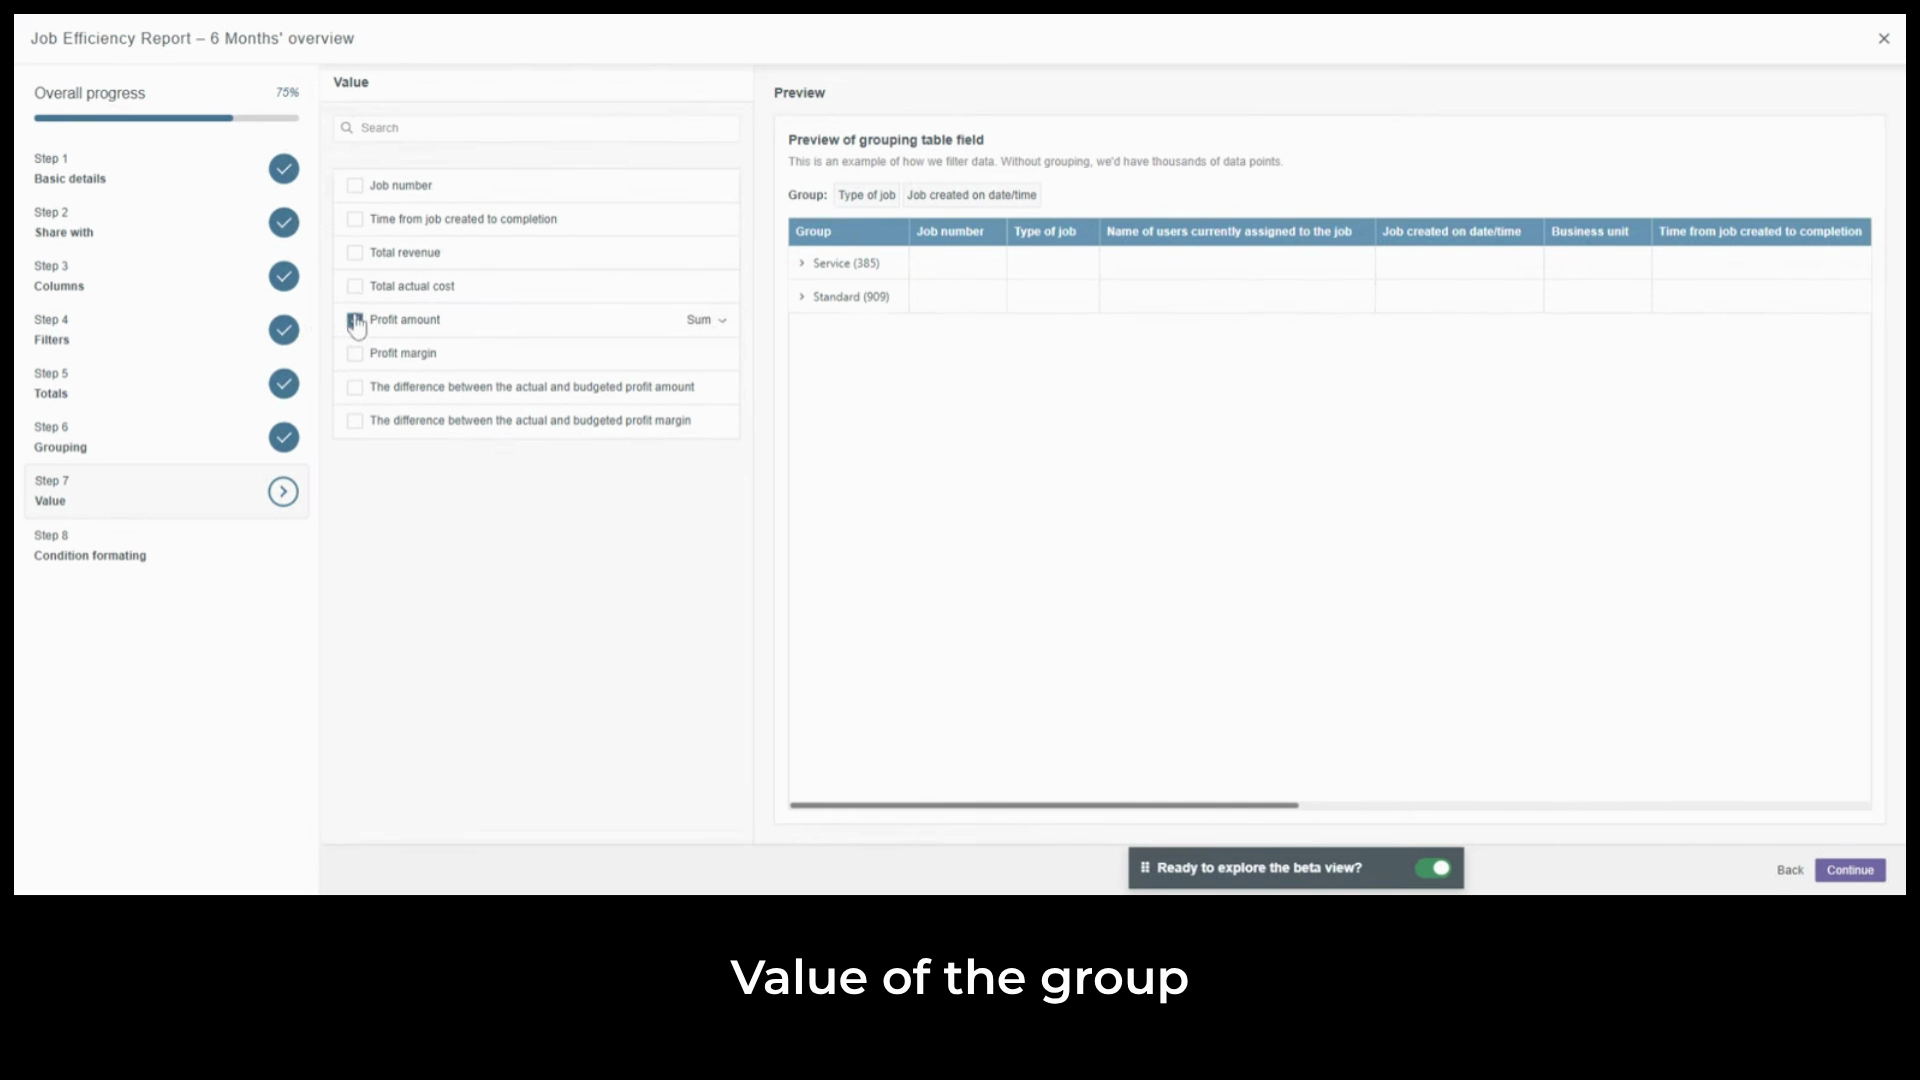
preview. The report now shows total profit for each
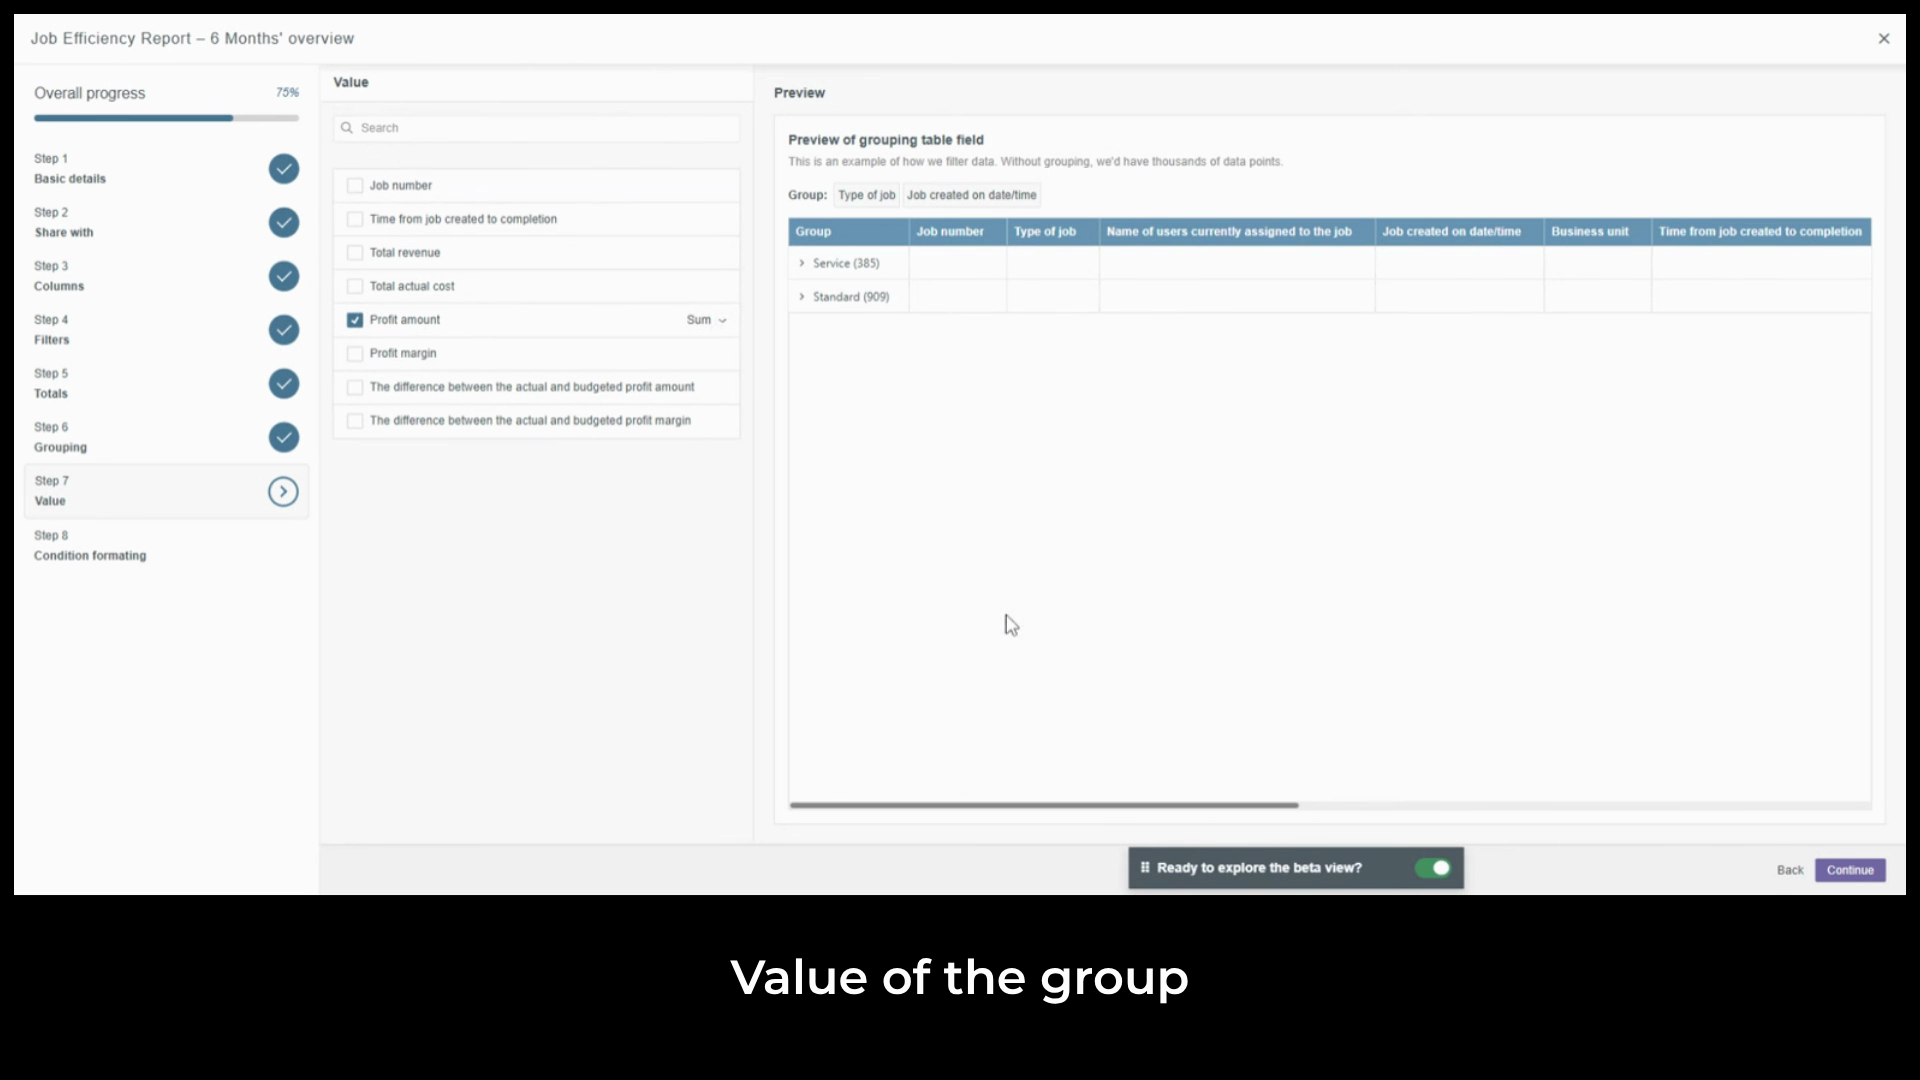
job type at the primary grouping level and the profit for each month within that job type at the secondary level.
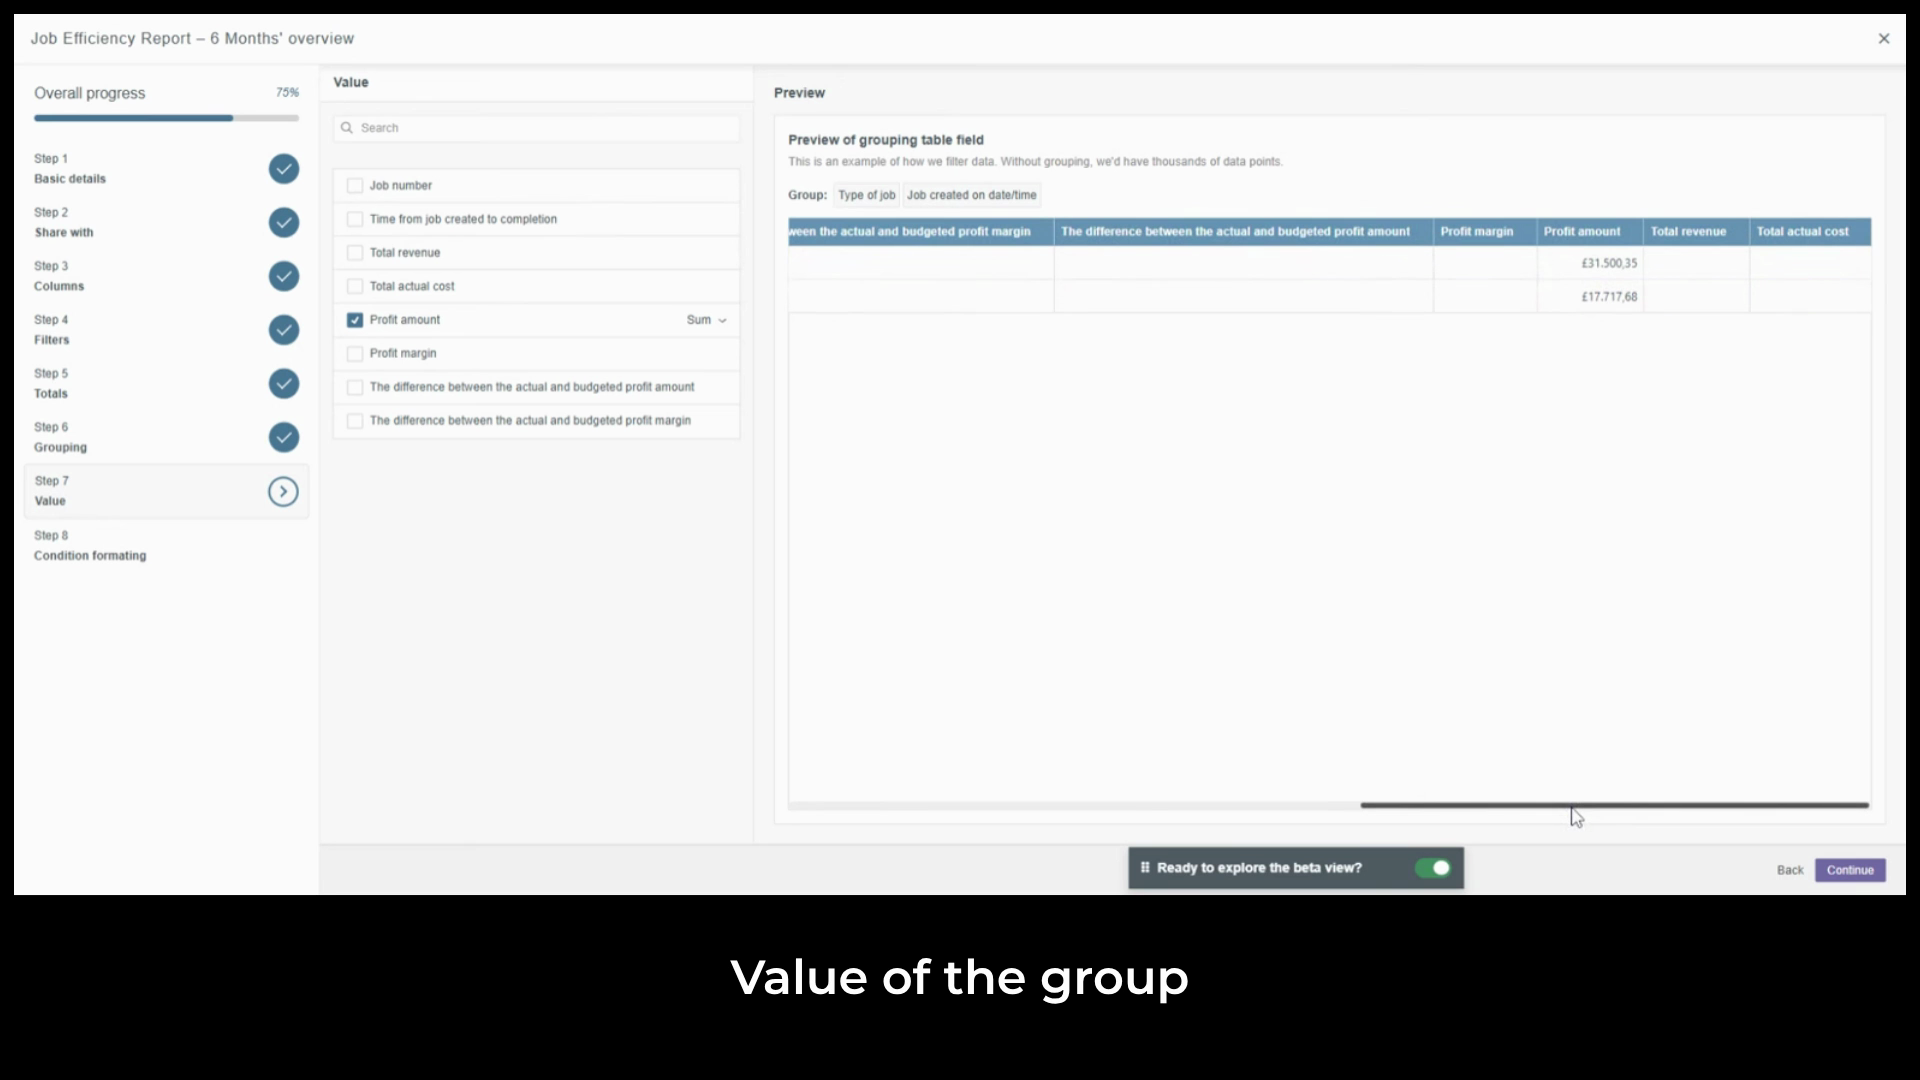
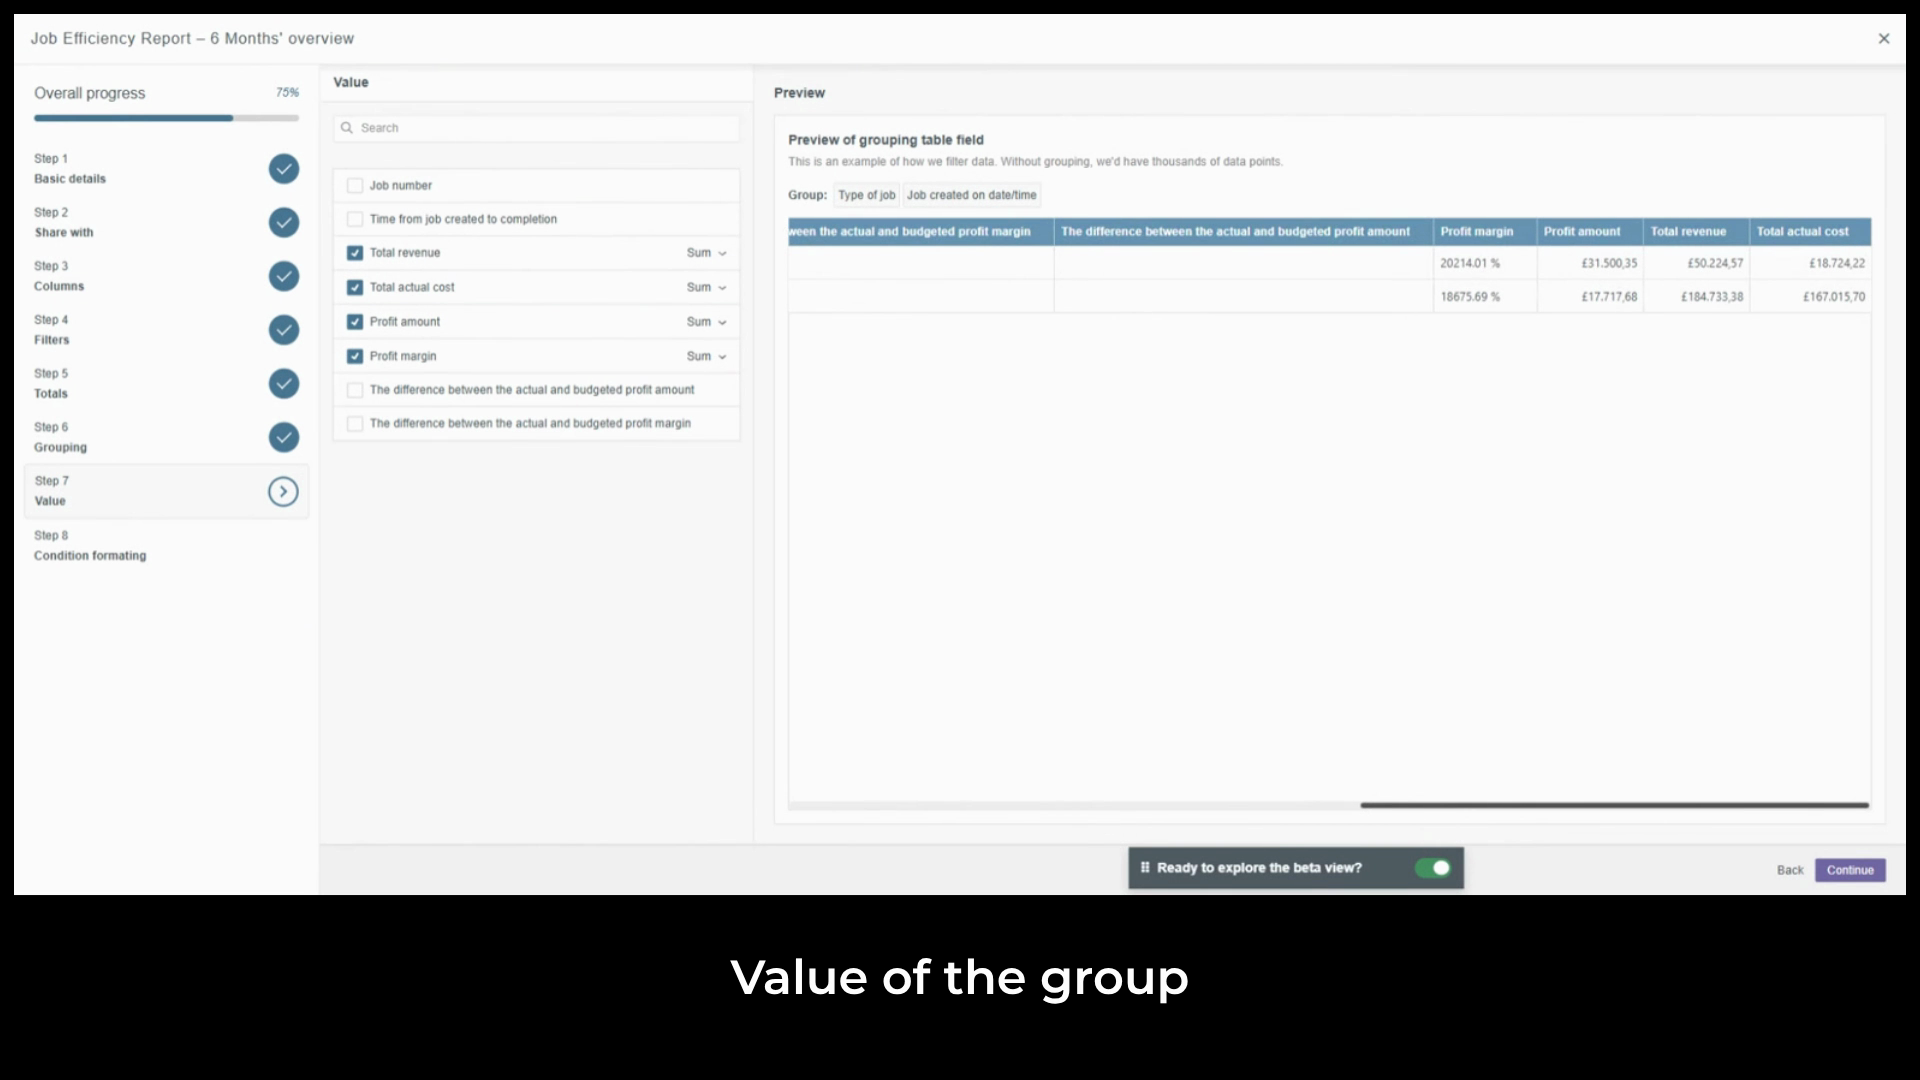
A financial summary at every layer of the report without any manual calculation. We'll add three more total revenue, total actual cost, and profit margin.
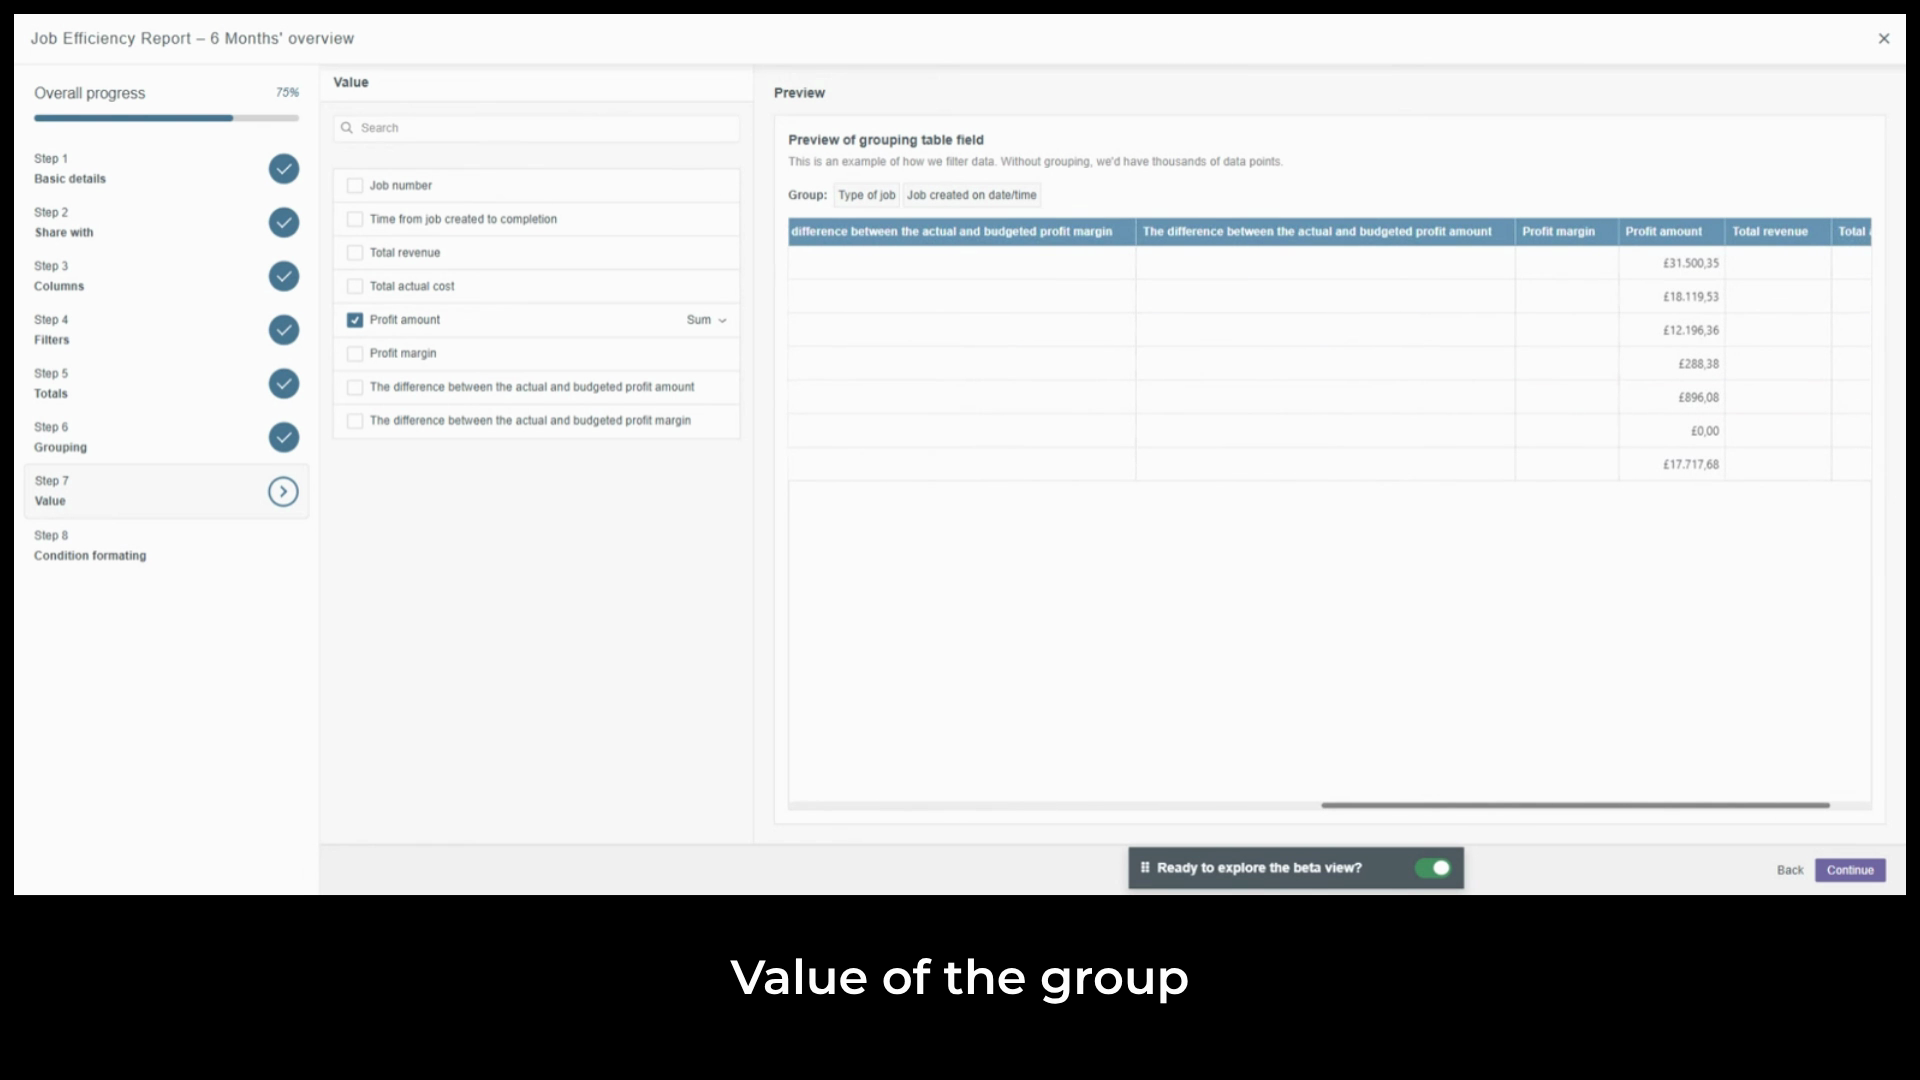
Each appears at every grouping level in the preview, giving managers a clear view of which job types and time periods are delivering strong margins and which need closer attention.
Click Continue. Step eight is conditional formatting, a visual tool that automatically
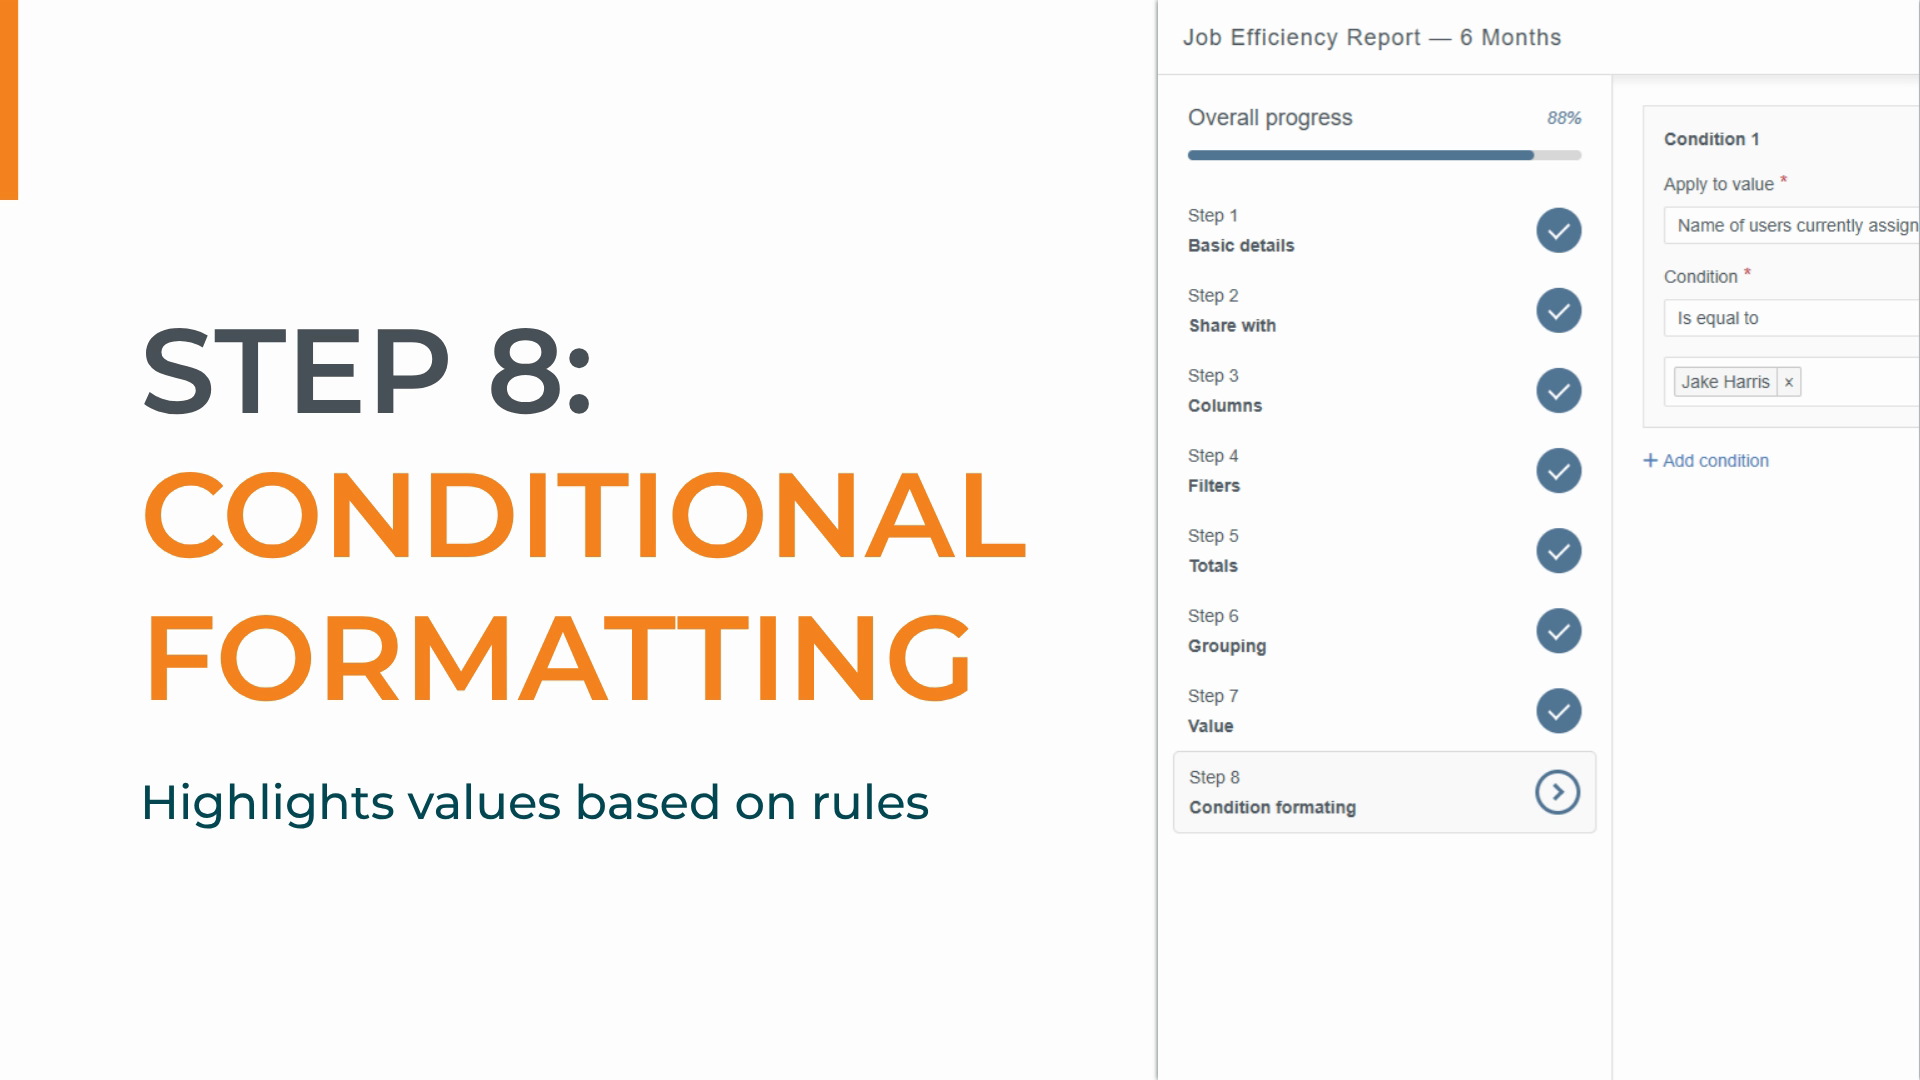
highlights values based on rules we define. It helps us quickly spot important data, trends, or issues at a glance. We can apply it to any numerical or time based column to draw attention to values that need action.
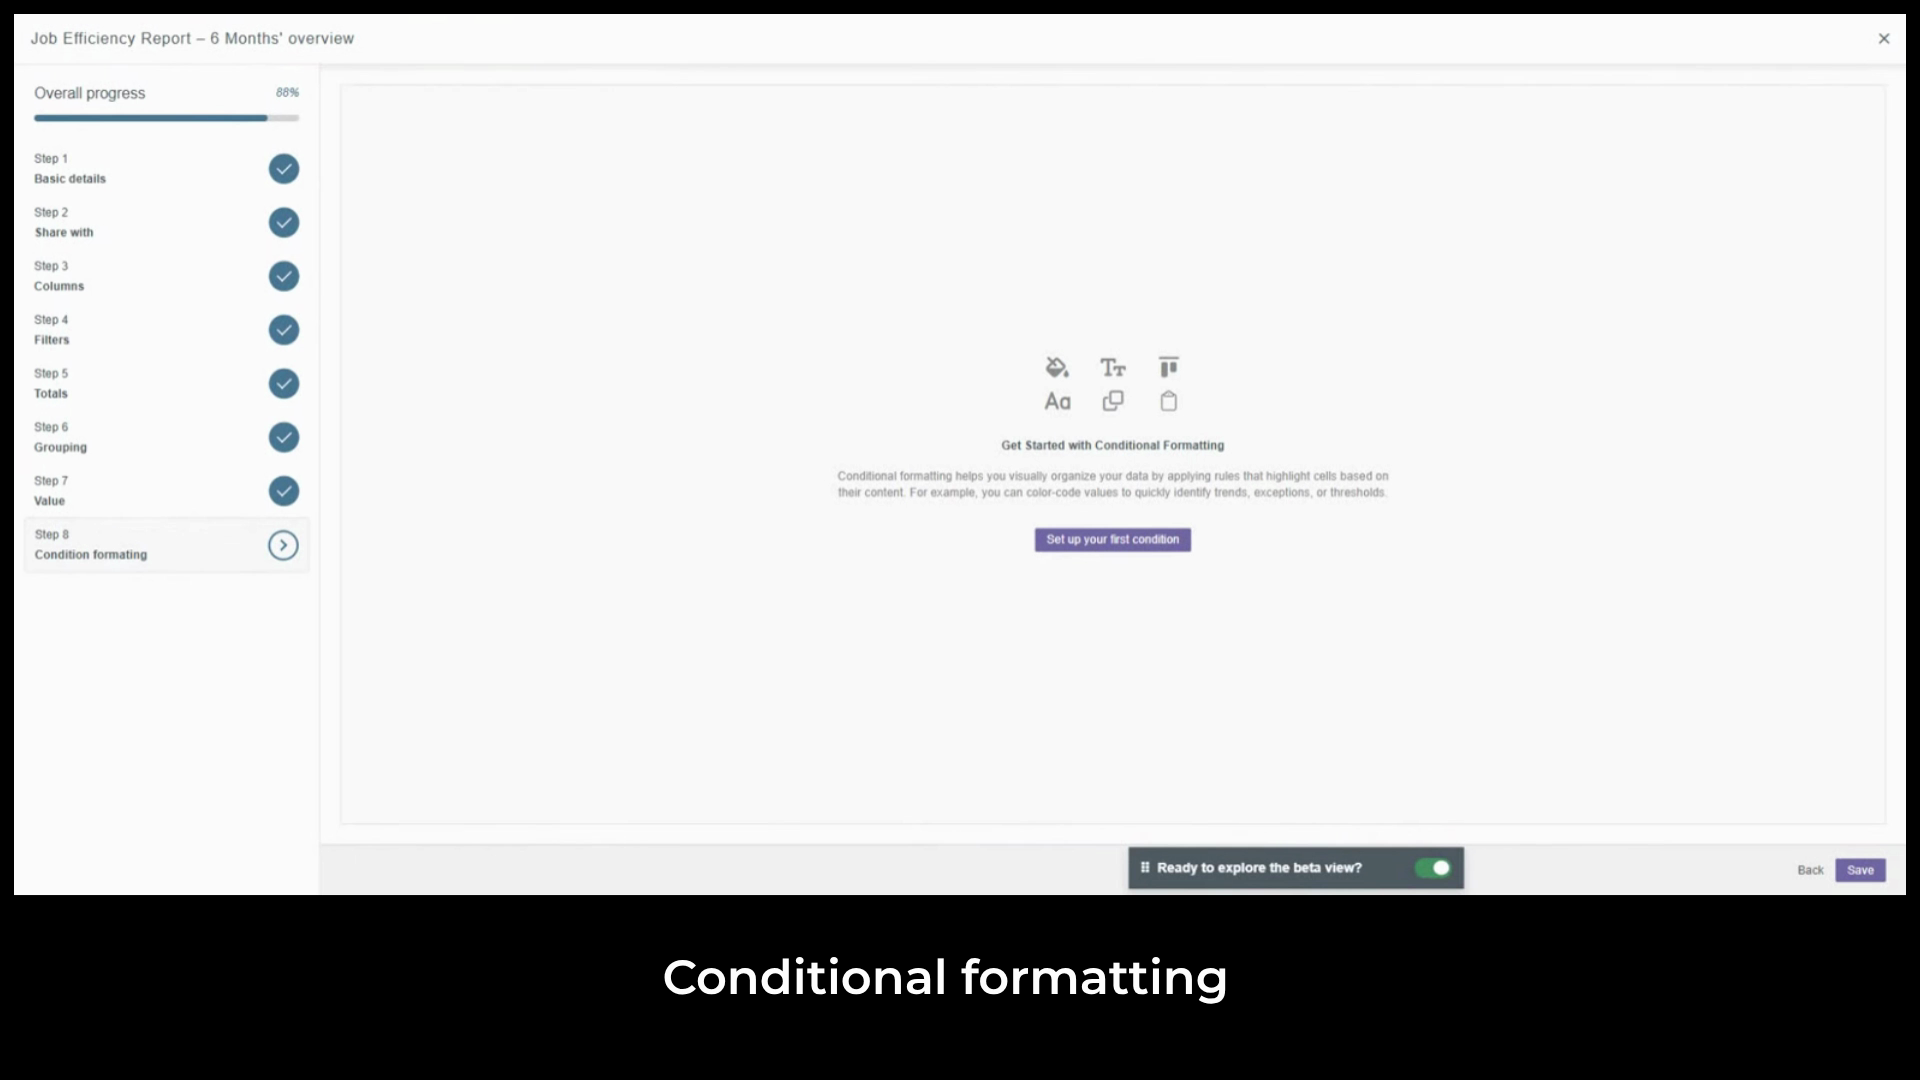
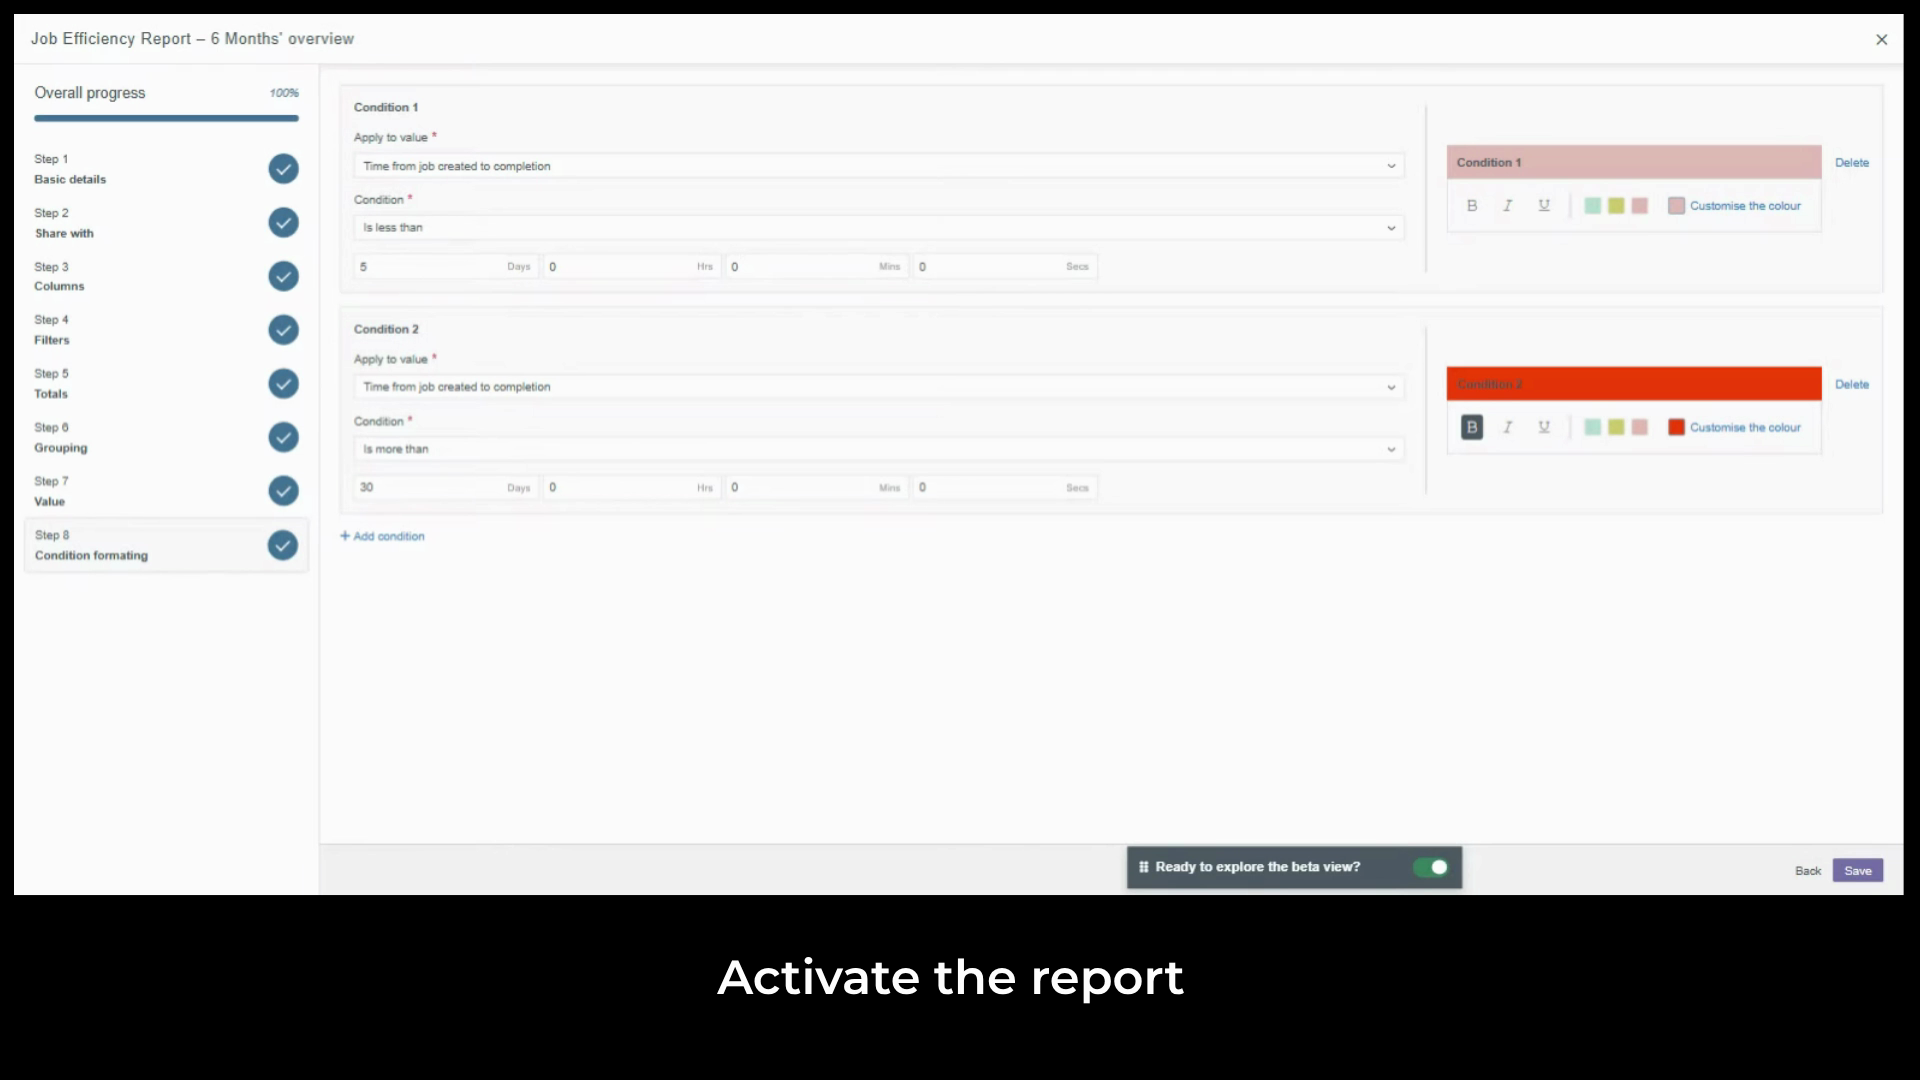
Click Set up your first condition. We'll highlight jobs completed in under five days.
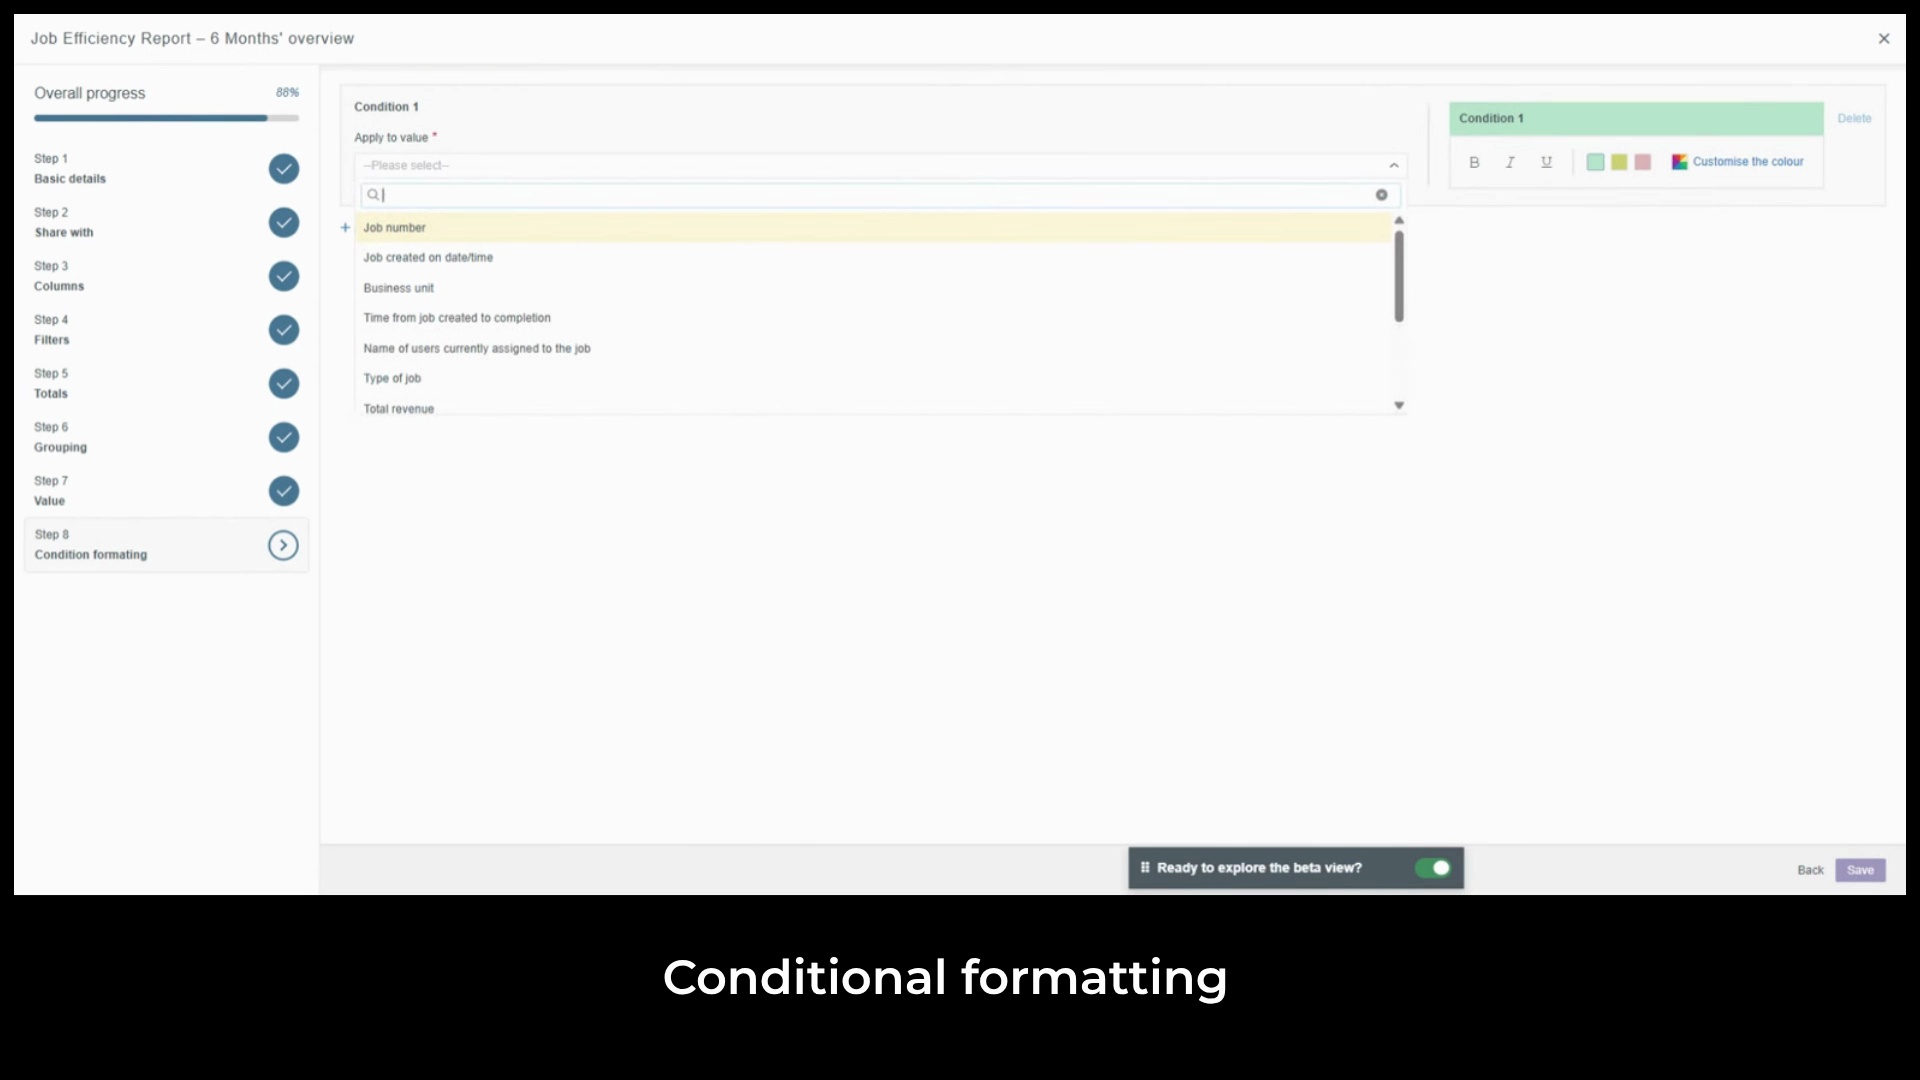
Select time from job created to completion.
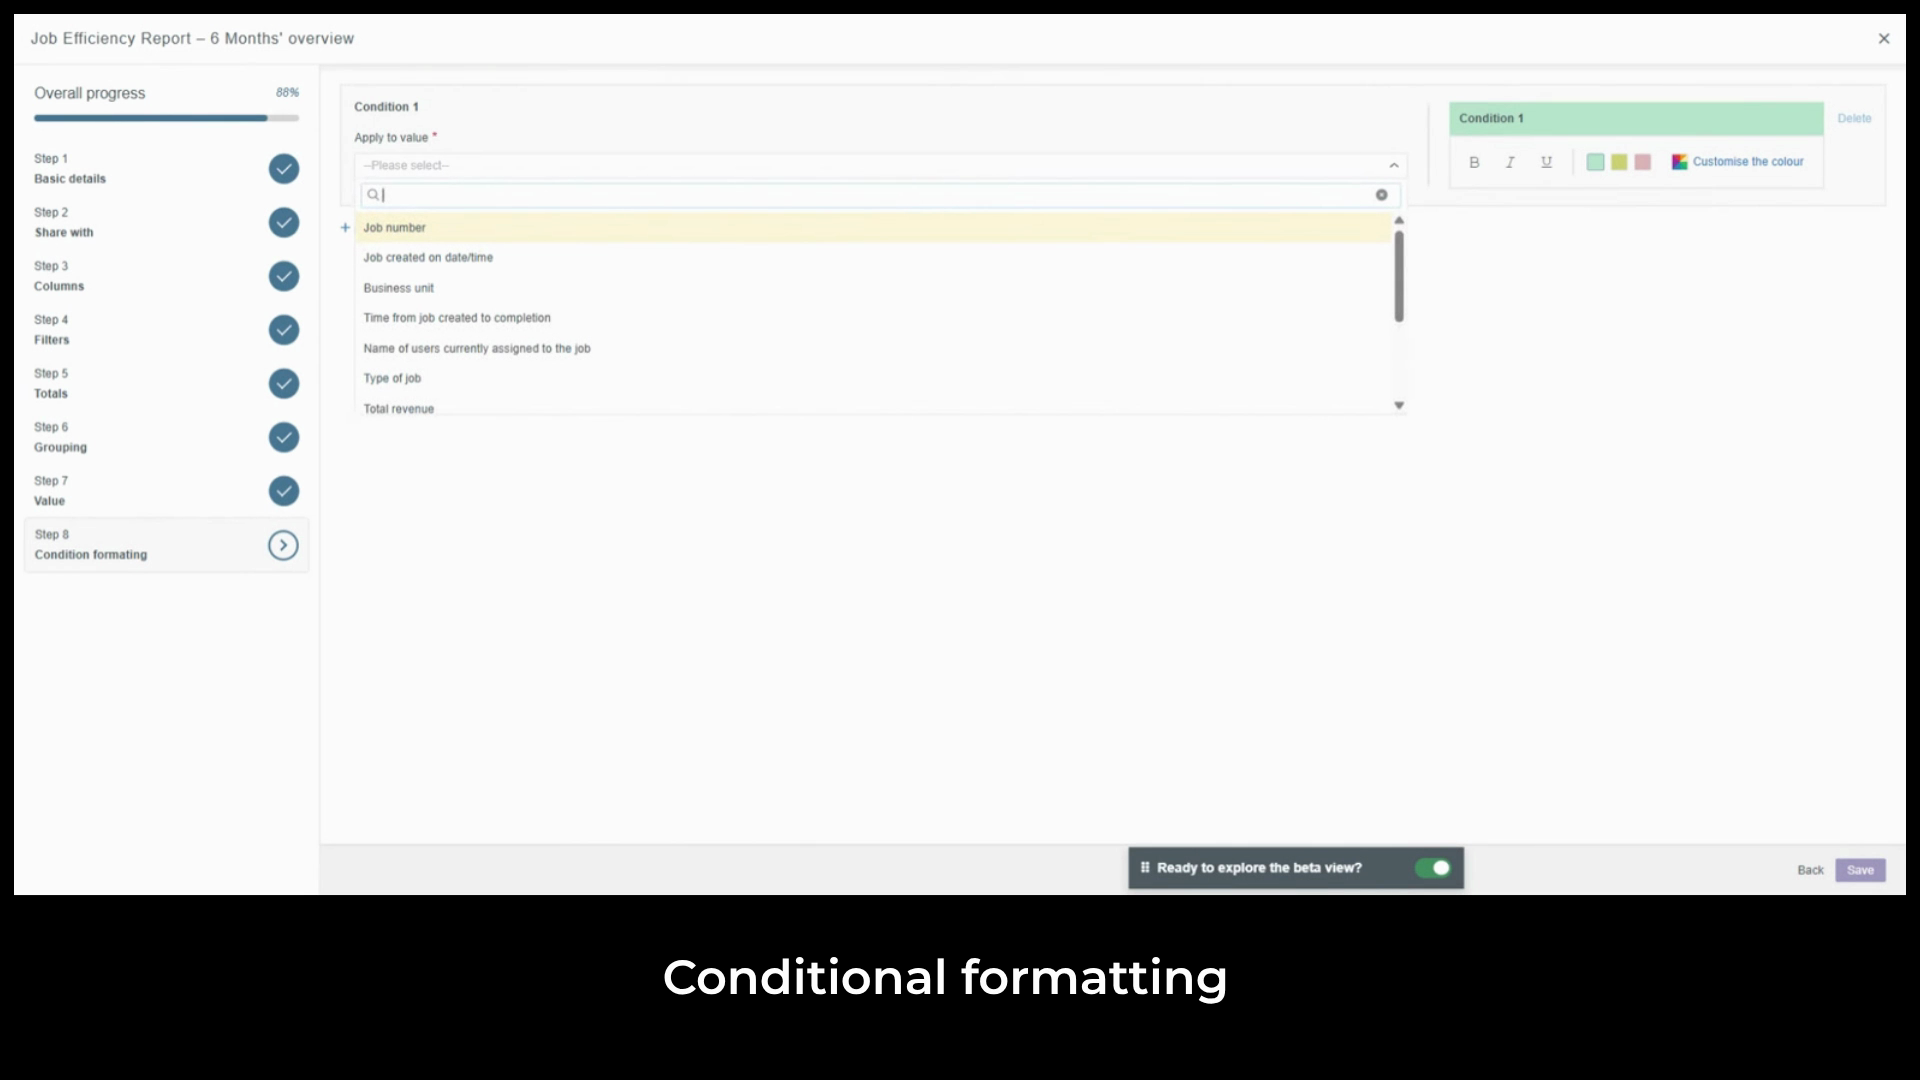
Set the condition to is less than.
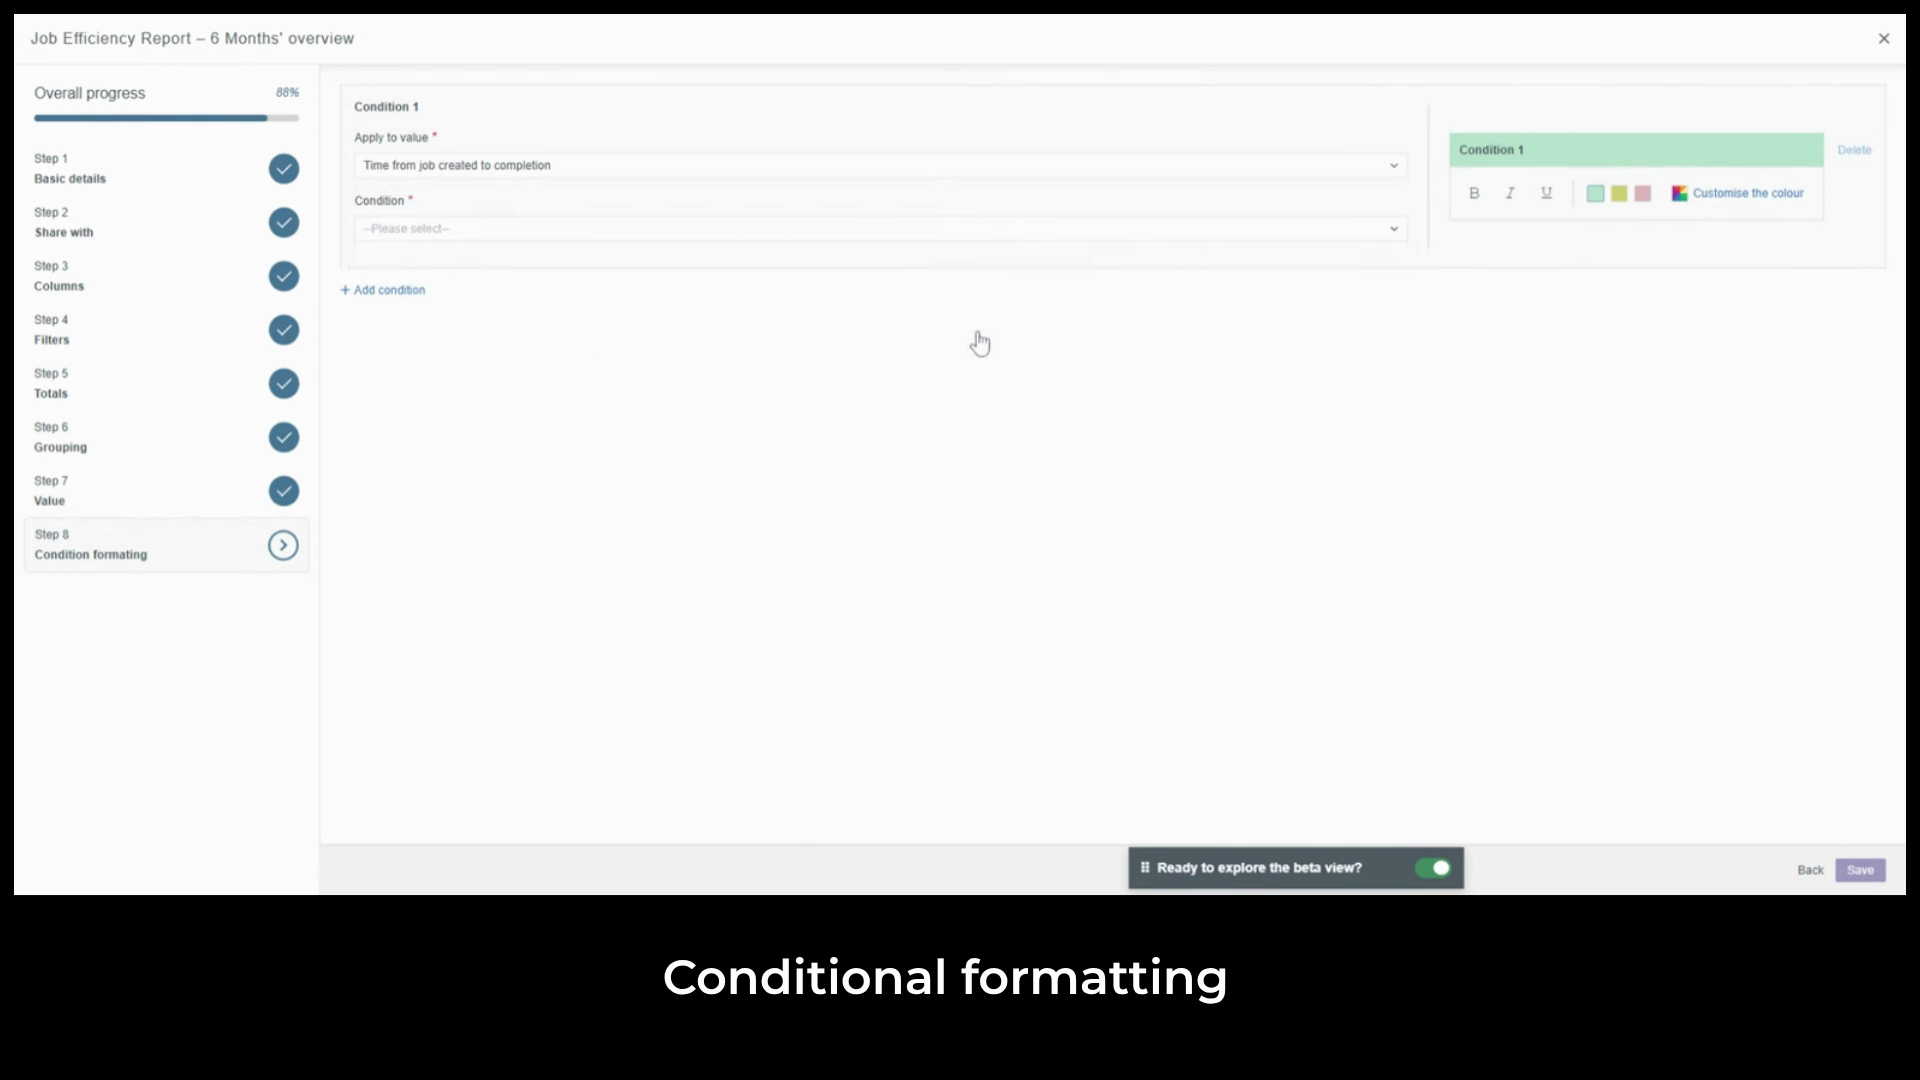
Enter five days and choose a highlight color. This immediately surfaces your most efficiently completed work without anyone having to scan the report manually.
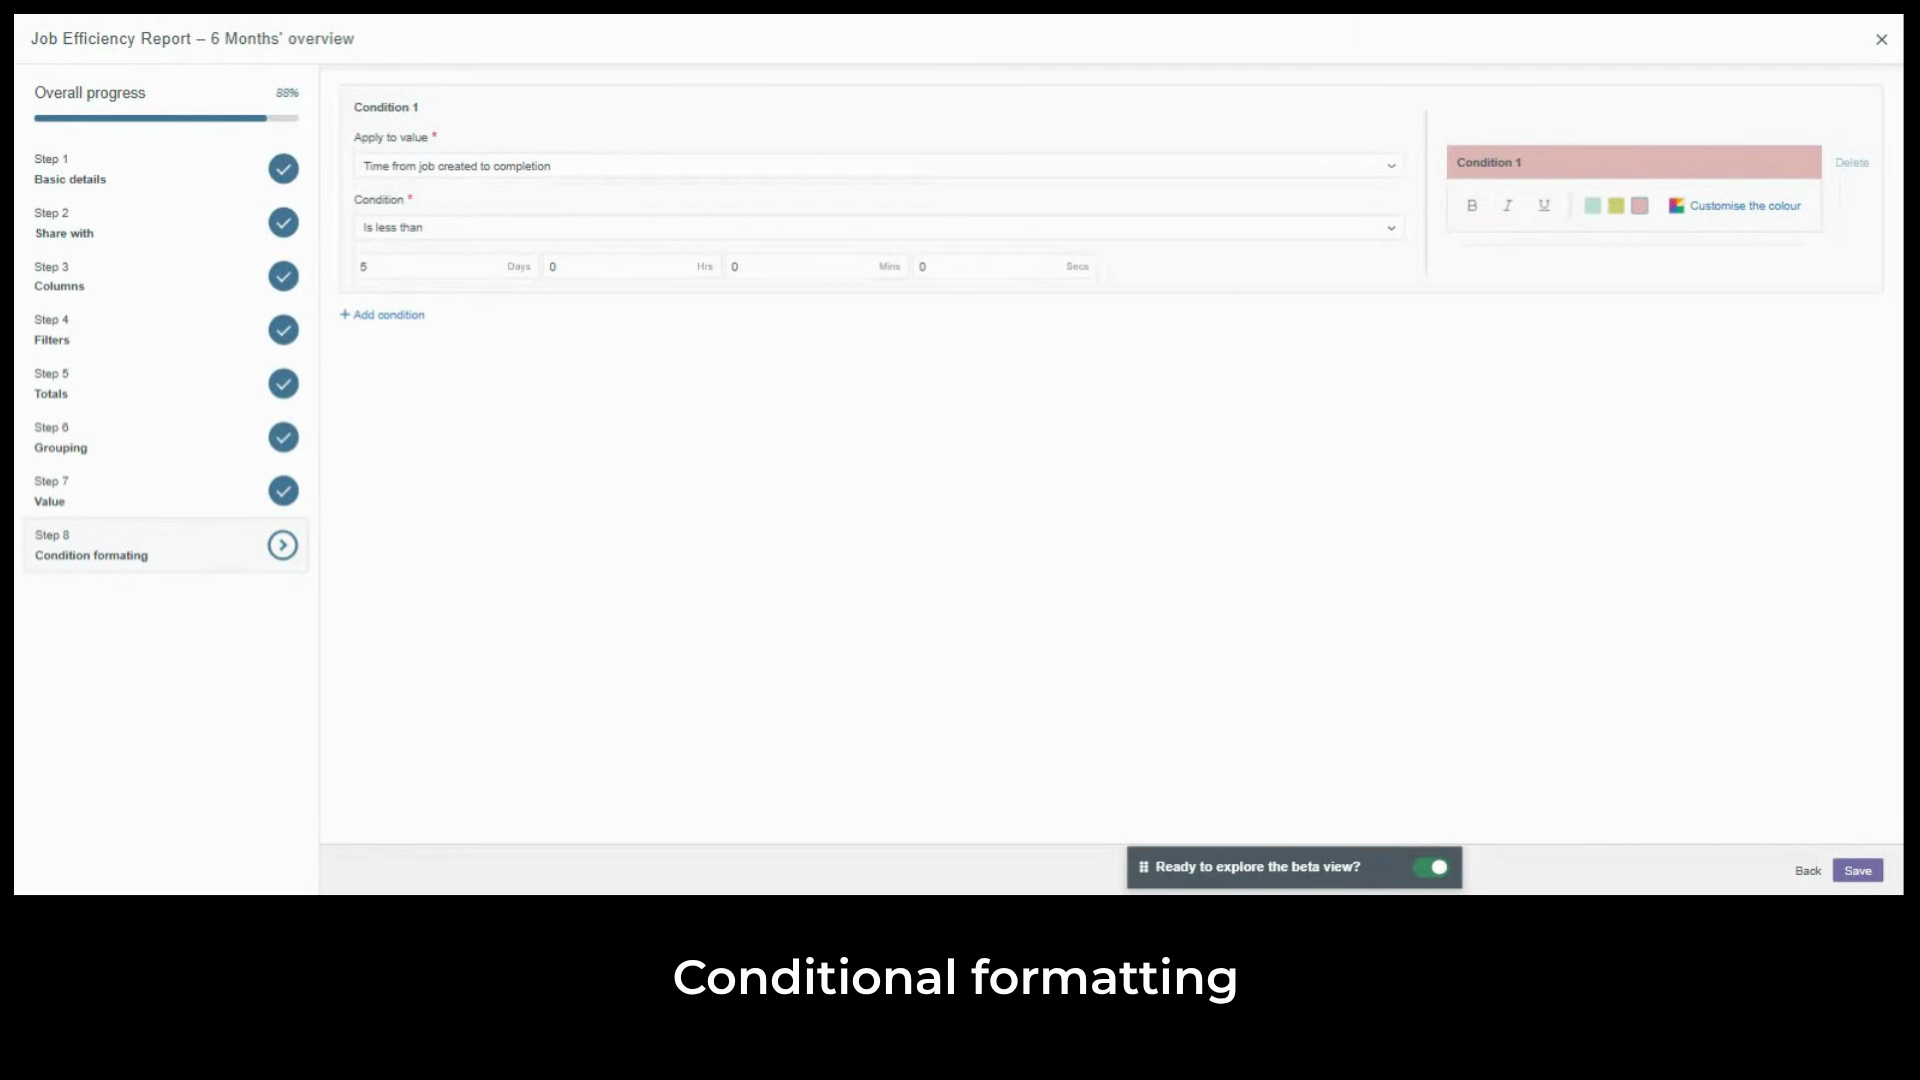
Add a second condition for jobs taking longer than 30 days.
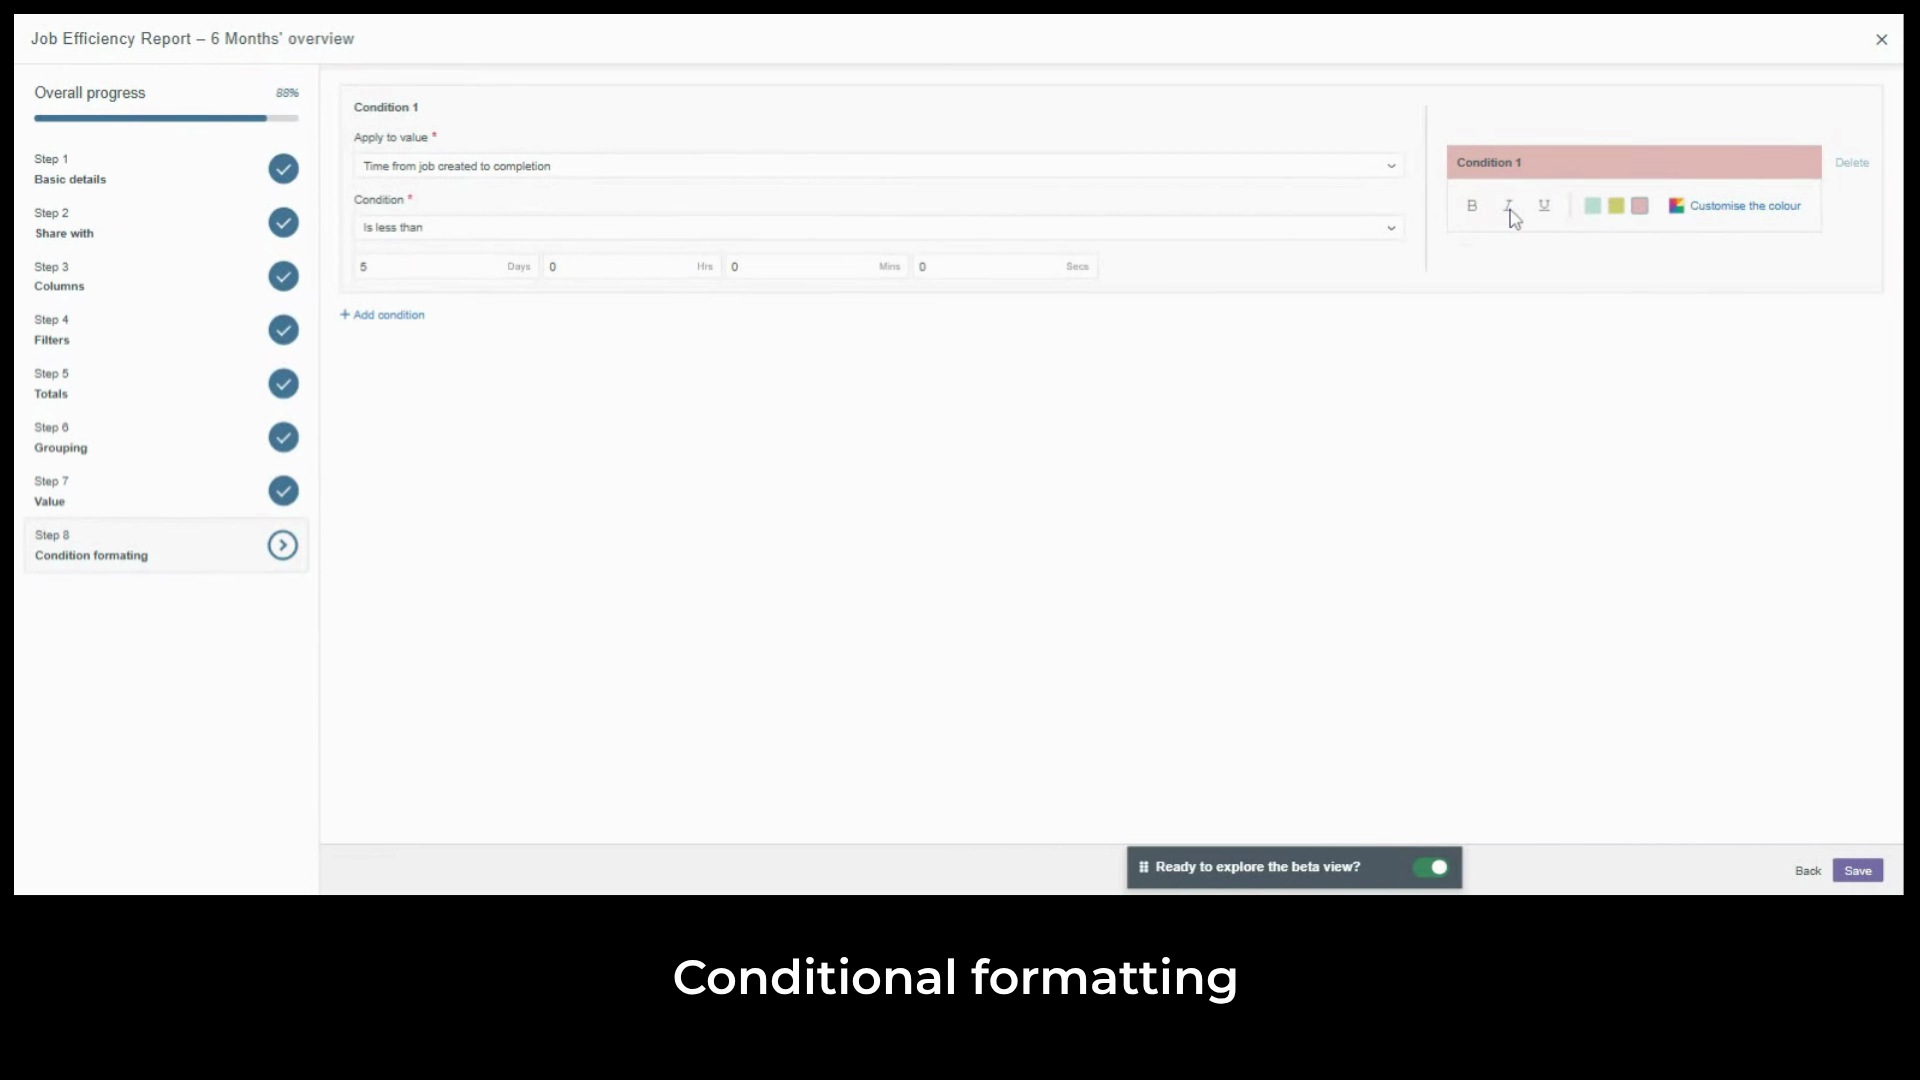
Same column more than 30 days, a contrasting color and bold formatting with both rules
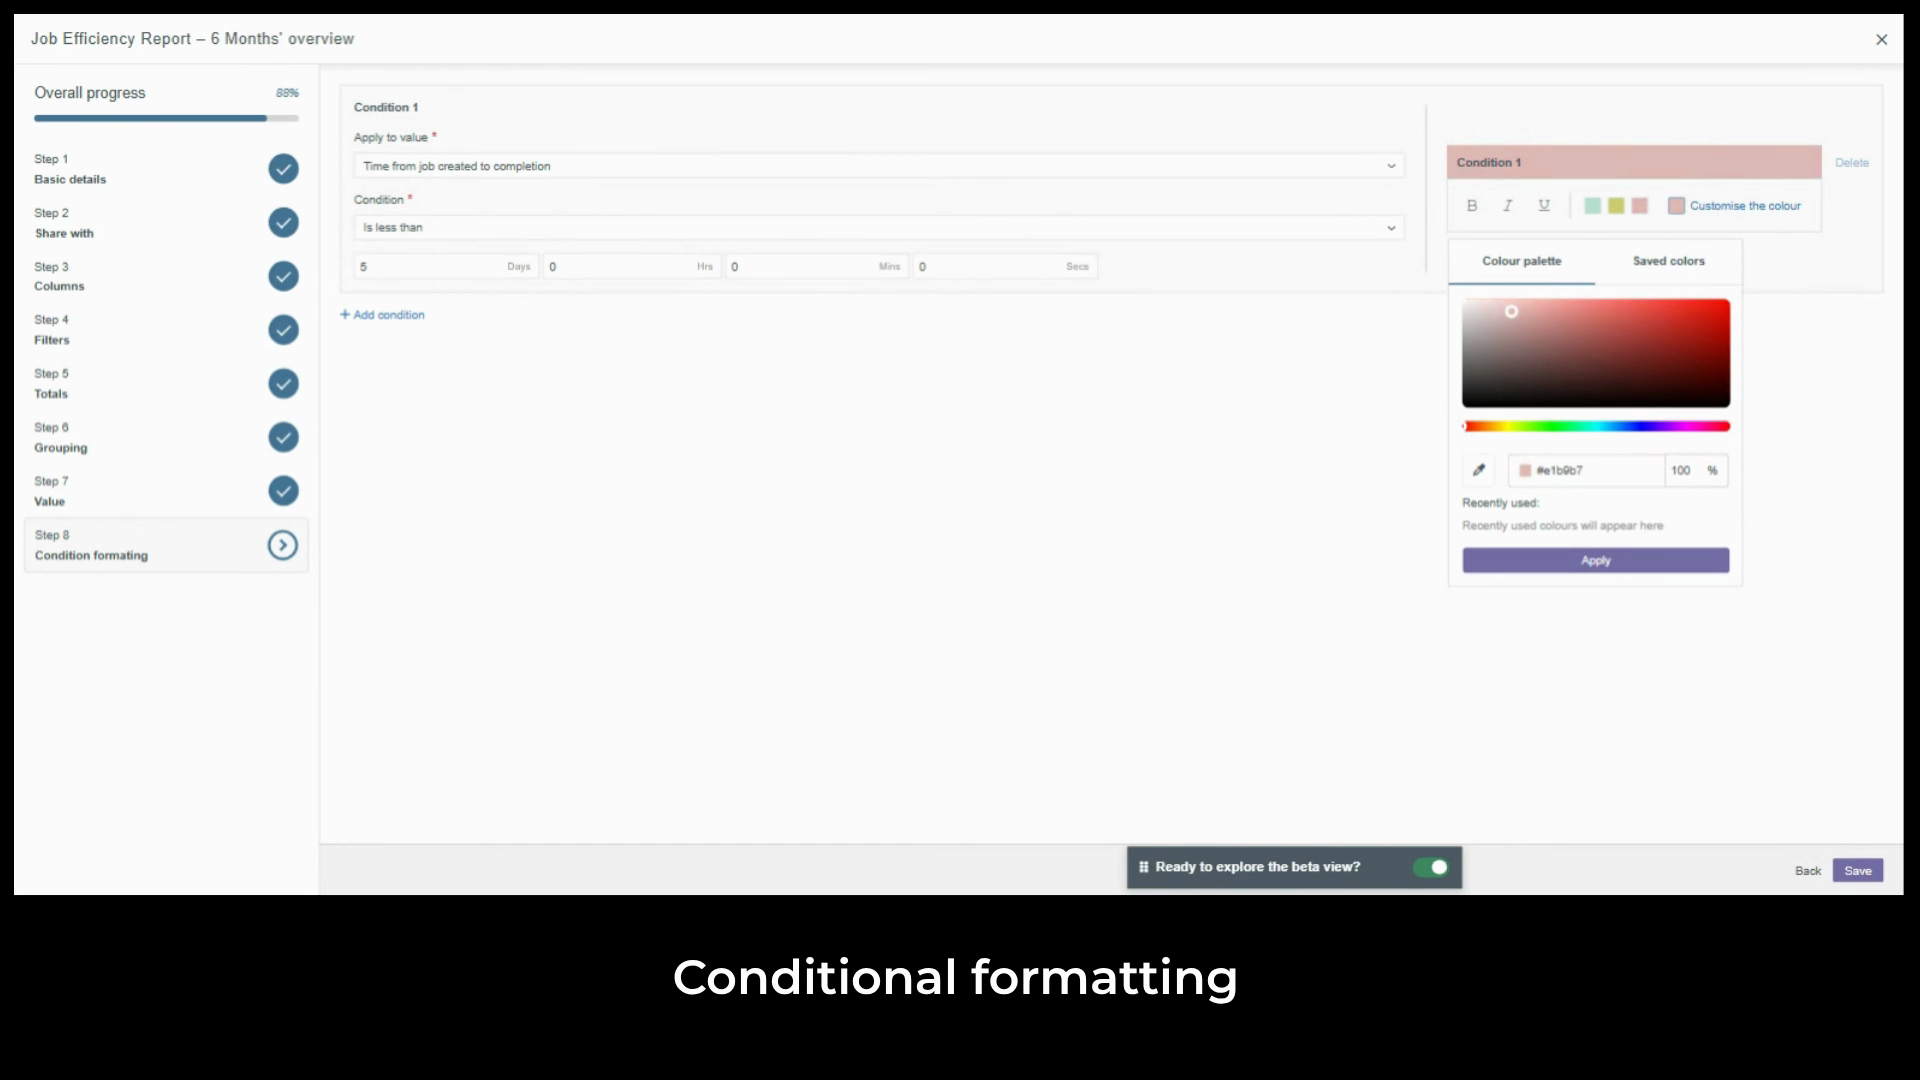
active, the report gives an instant visual signal of where jobs completed quickly and where they stalled the kind of visibility that used to require a separate analysis.
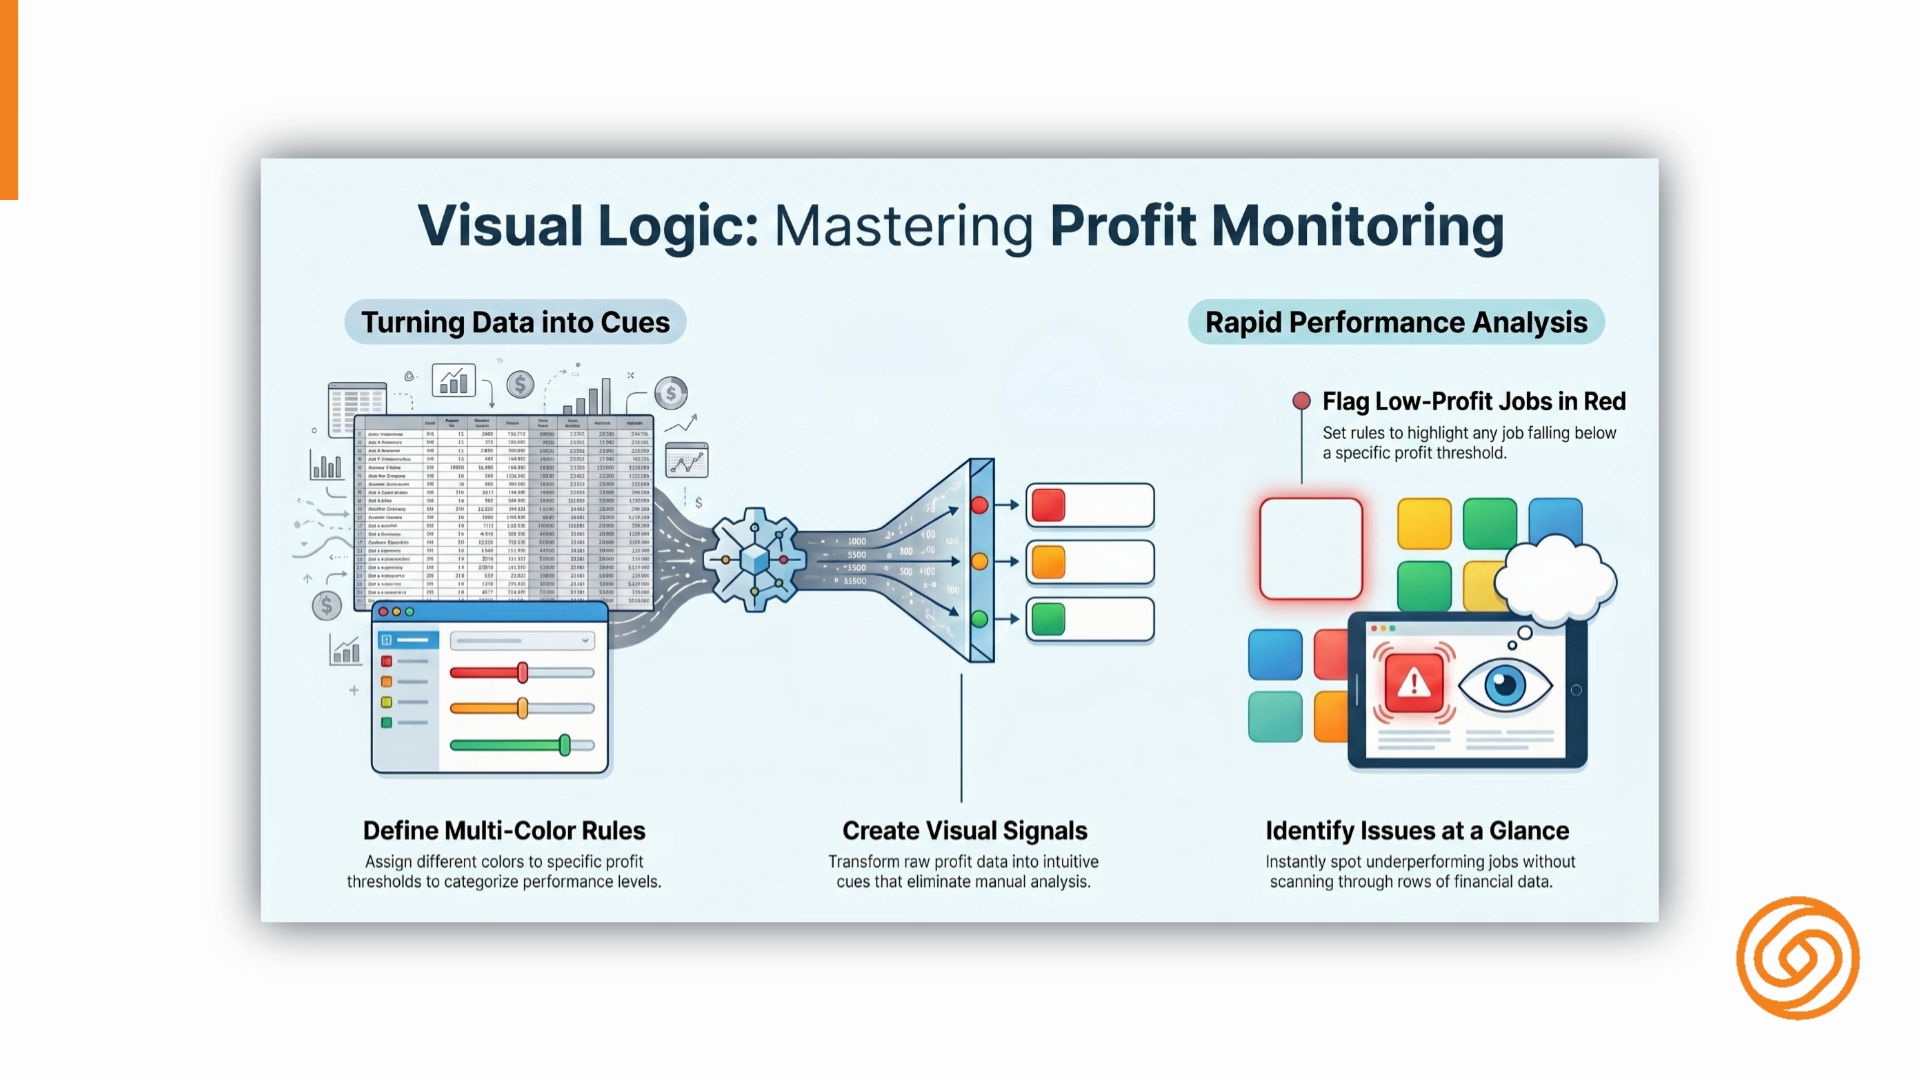
We can set multiple rules with different colors. The key is to turn data into a visual cue. For example,
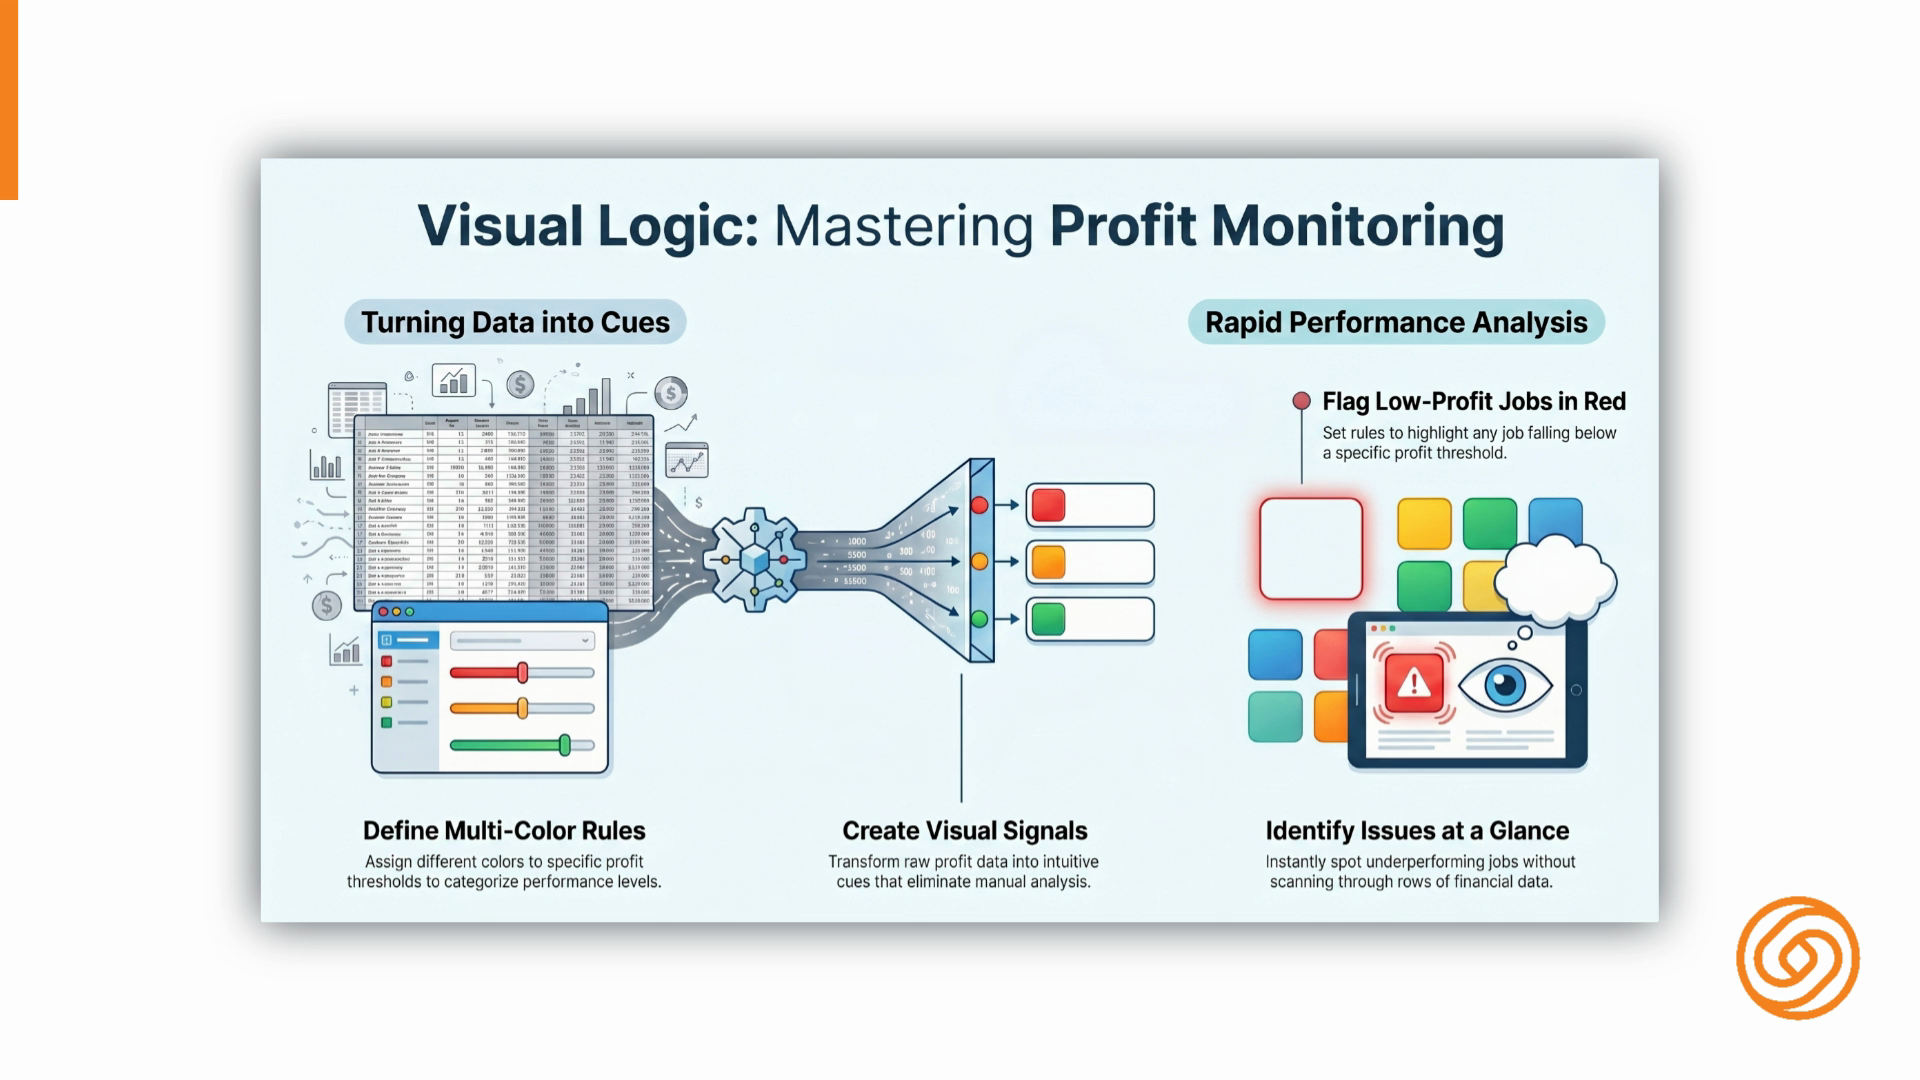
setting a rule that highlights all jobs with a profit amount below
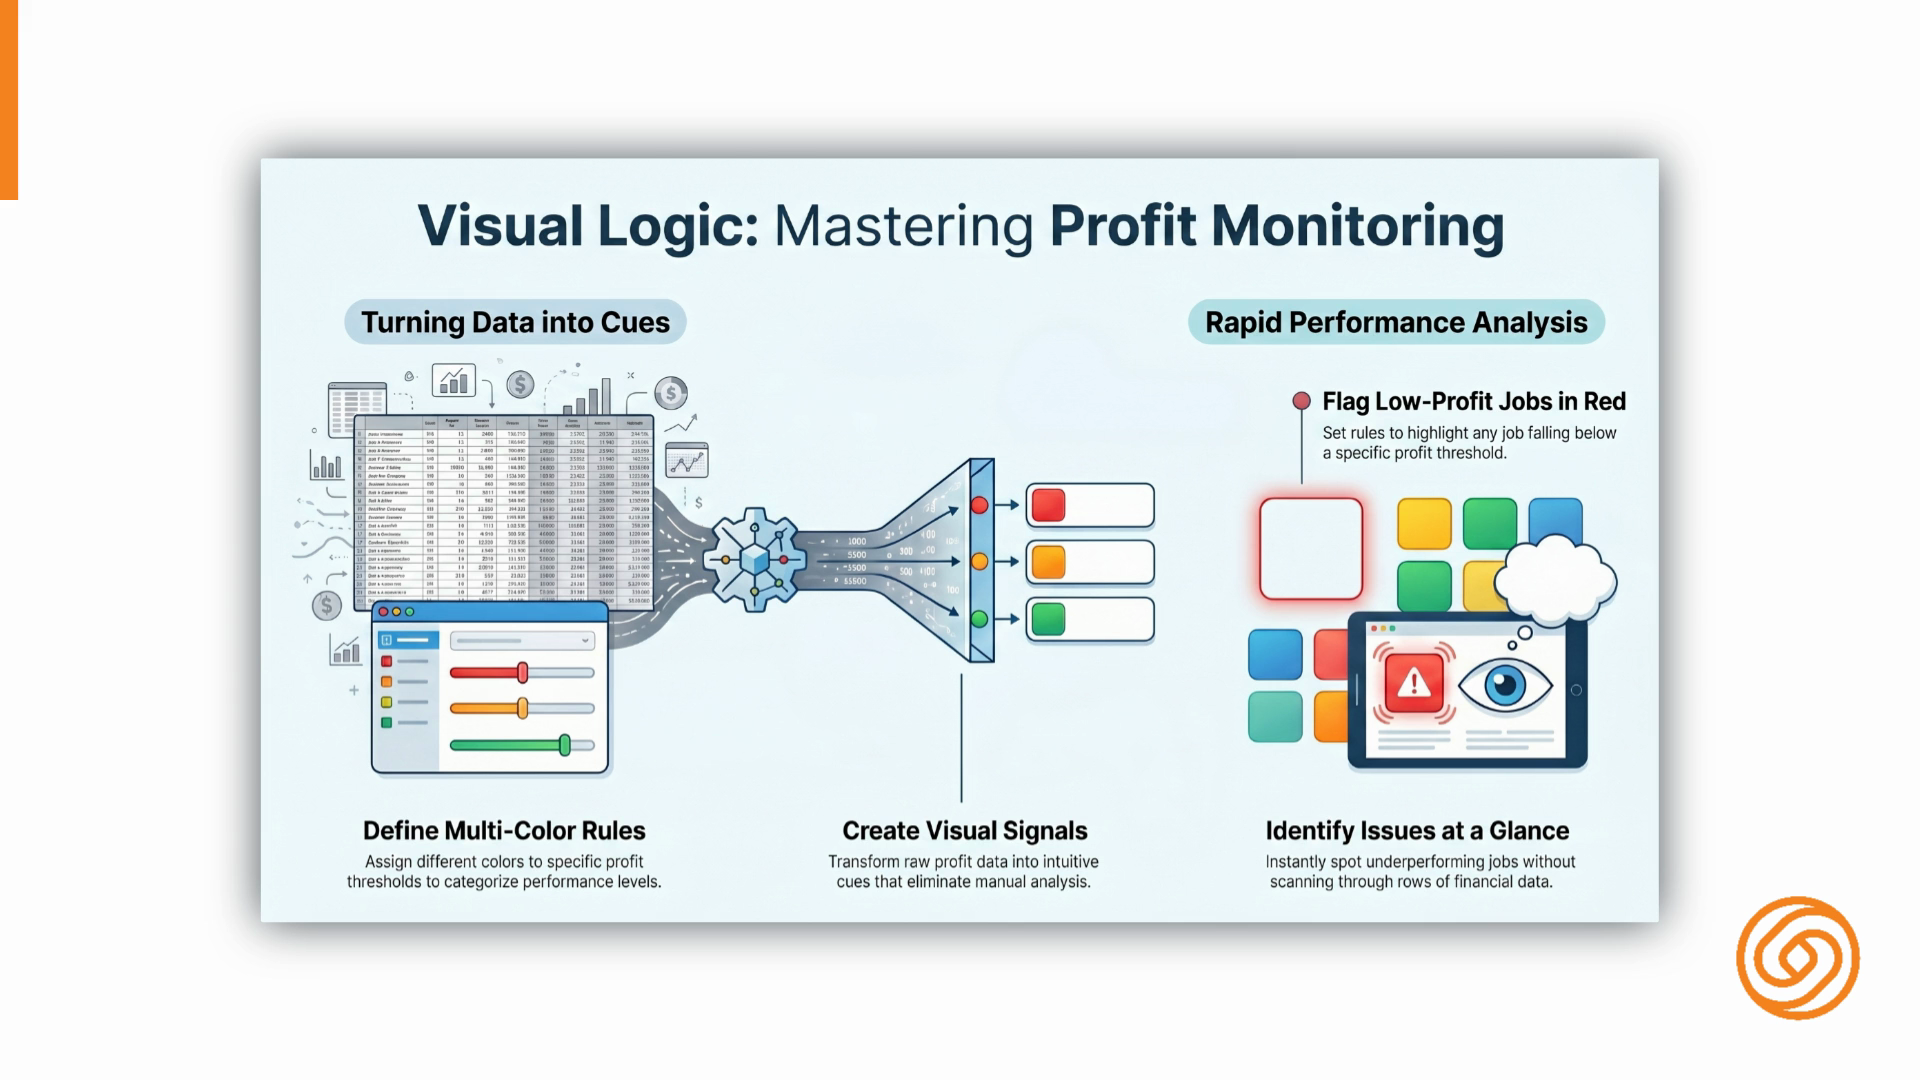
a certain threshold in red means we can instantly identify underperforming jobs at a glance. Once complete,
click Save. You'll see two options. Type Activate and
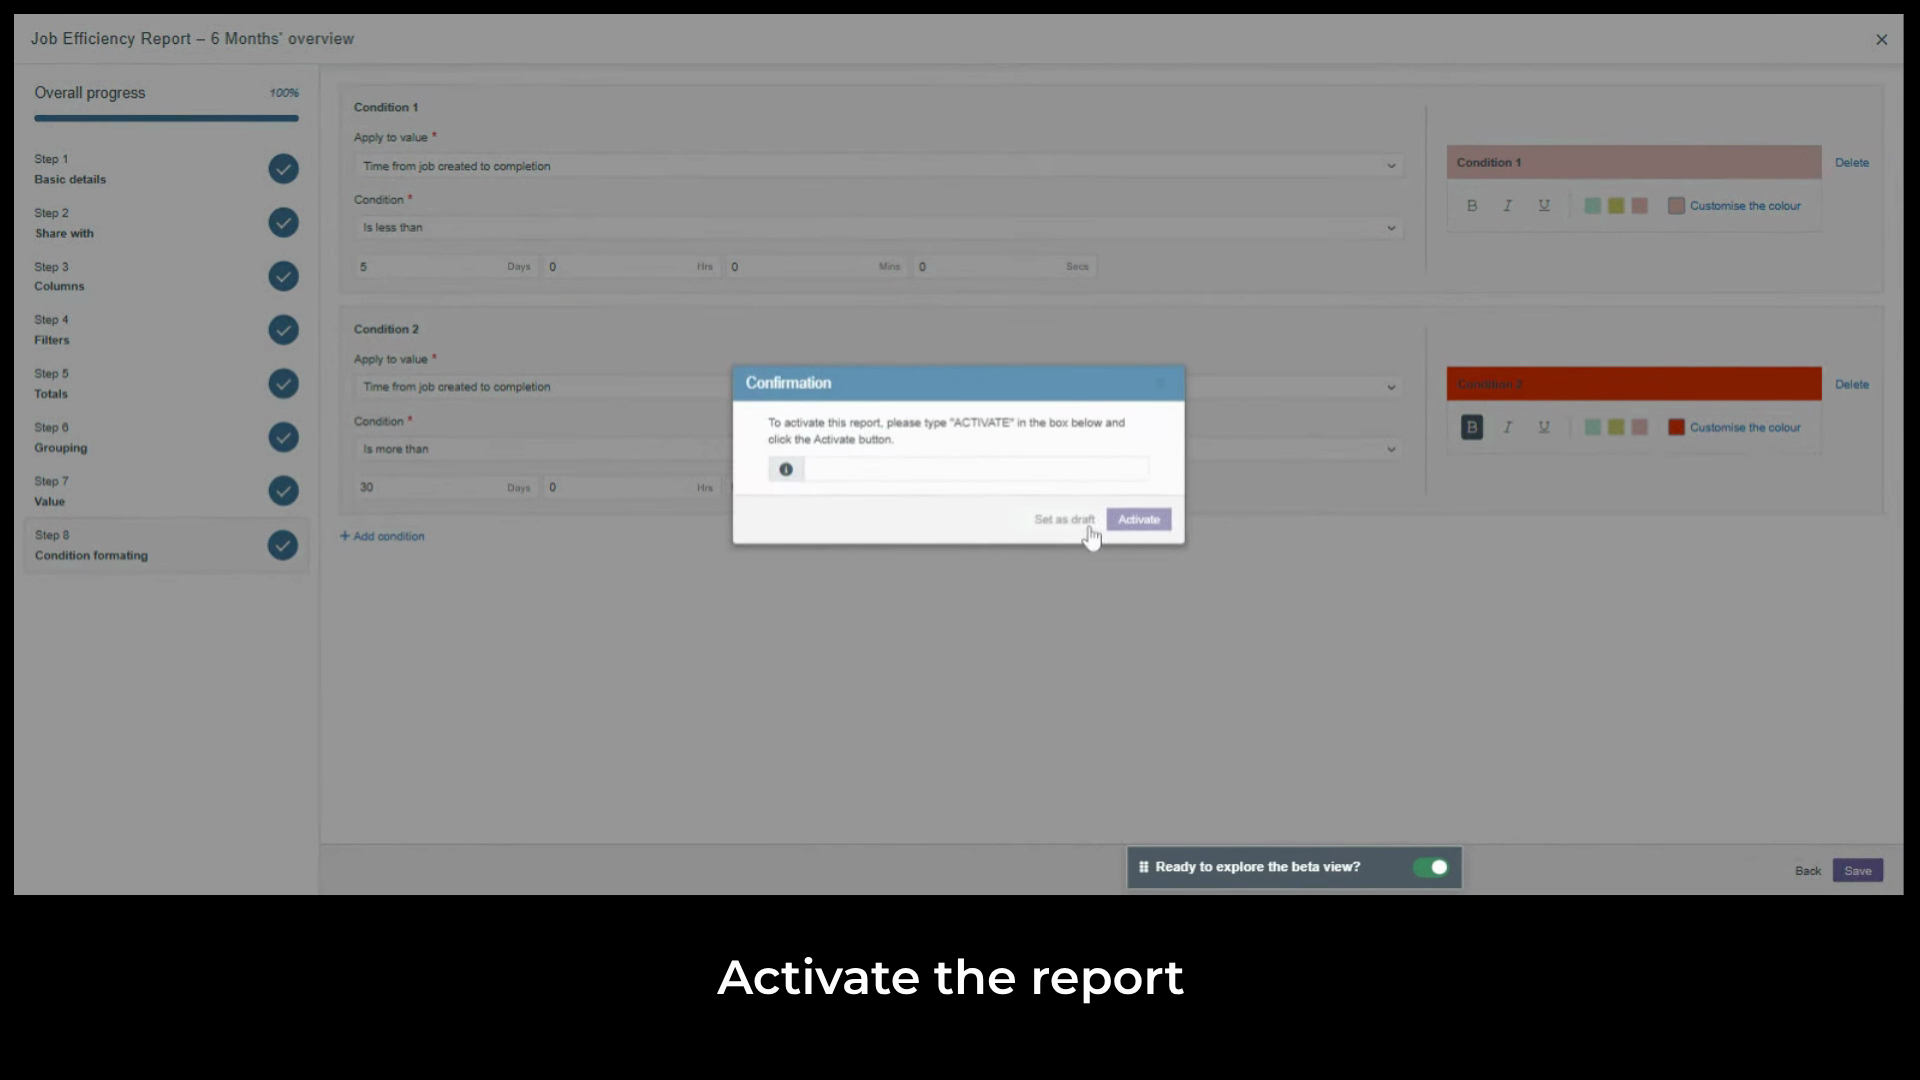
click the Activate to publish the report and make it live or Save as Draft to keep working on it. Draft reports
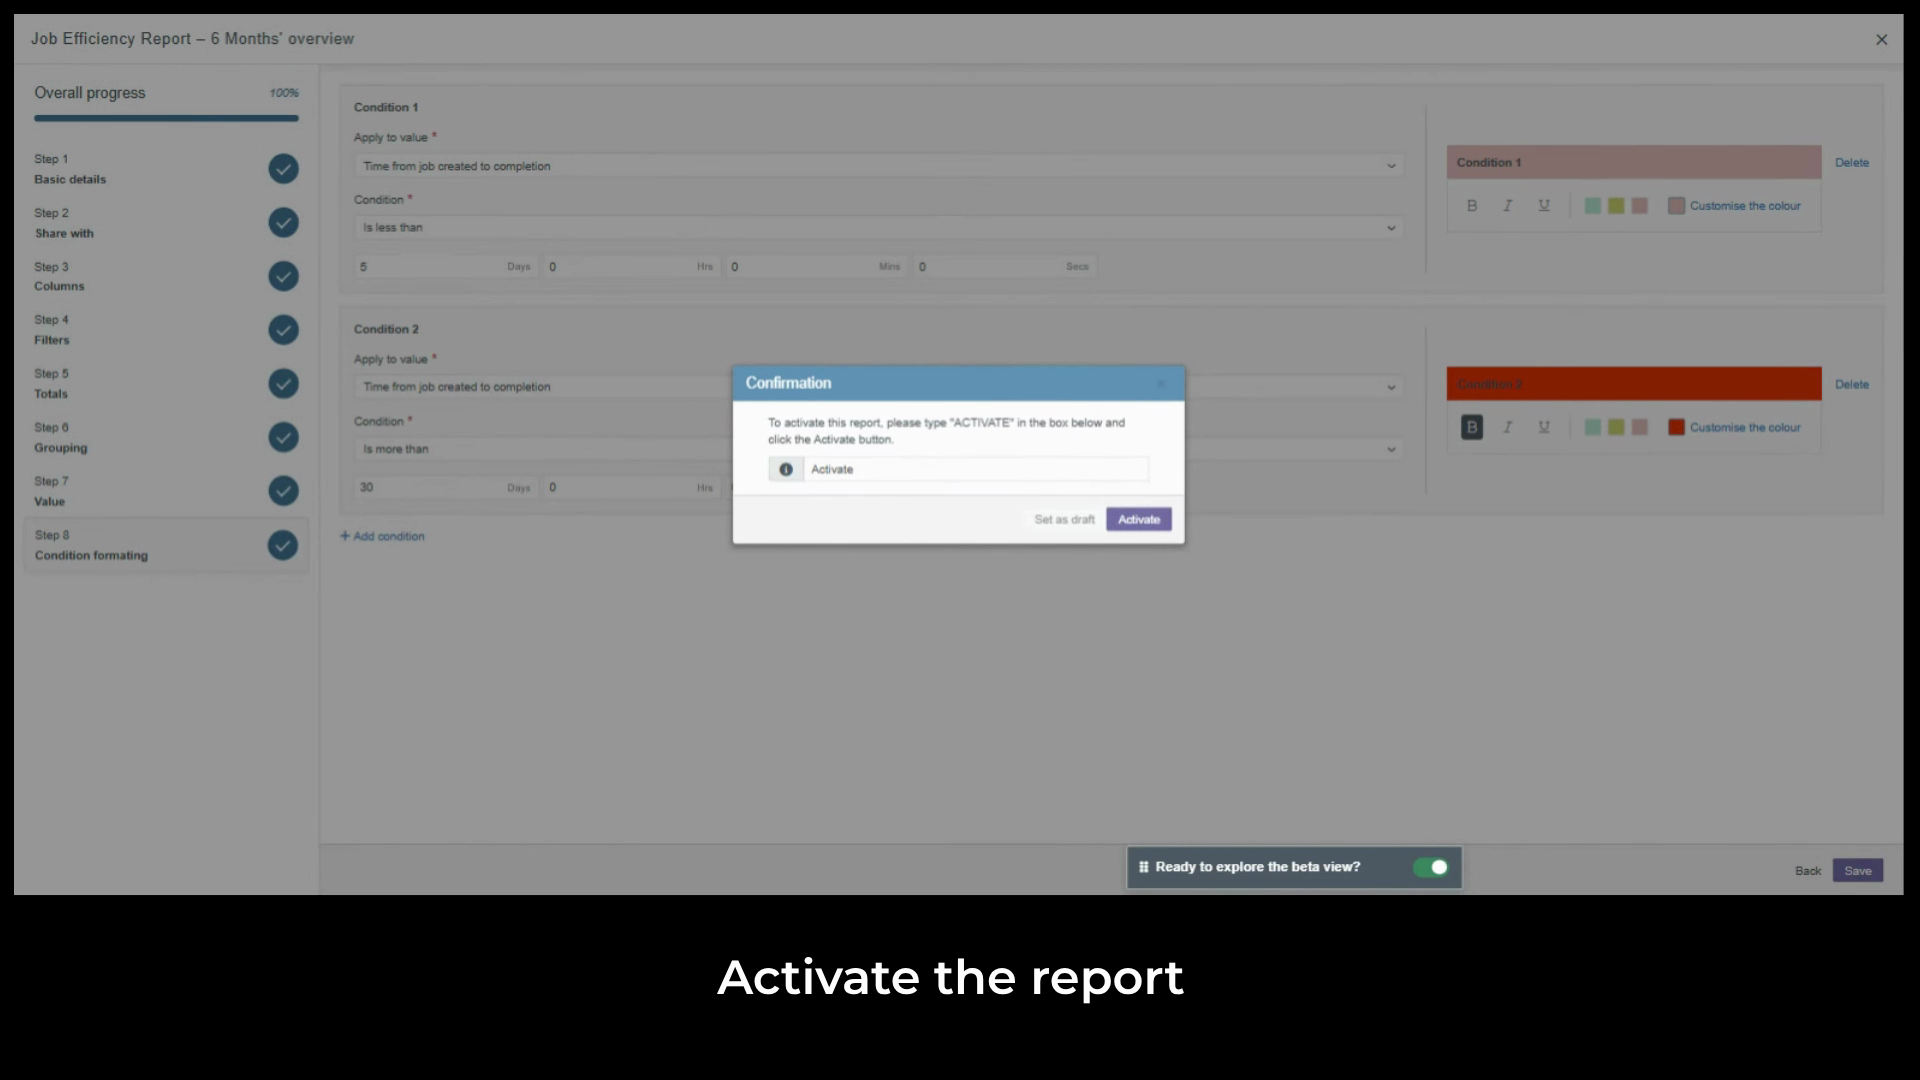
show a label in the report list, so they're easy to identify. We'll
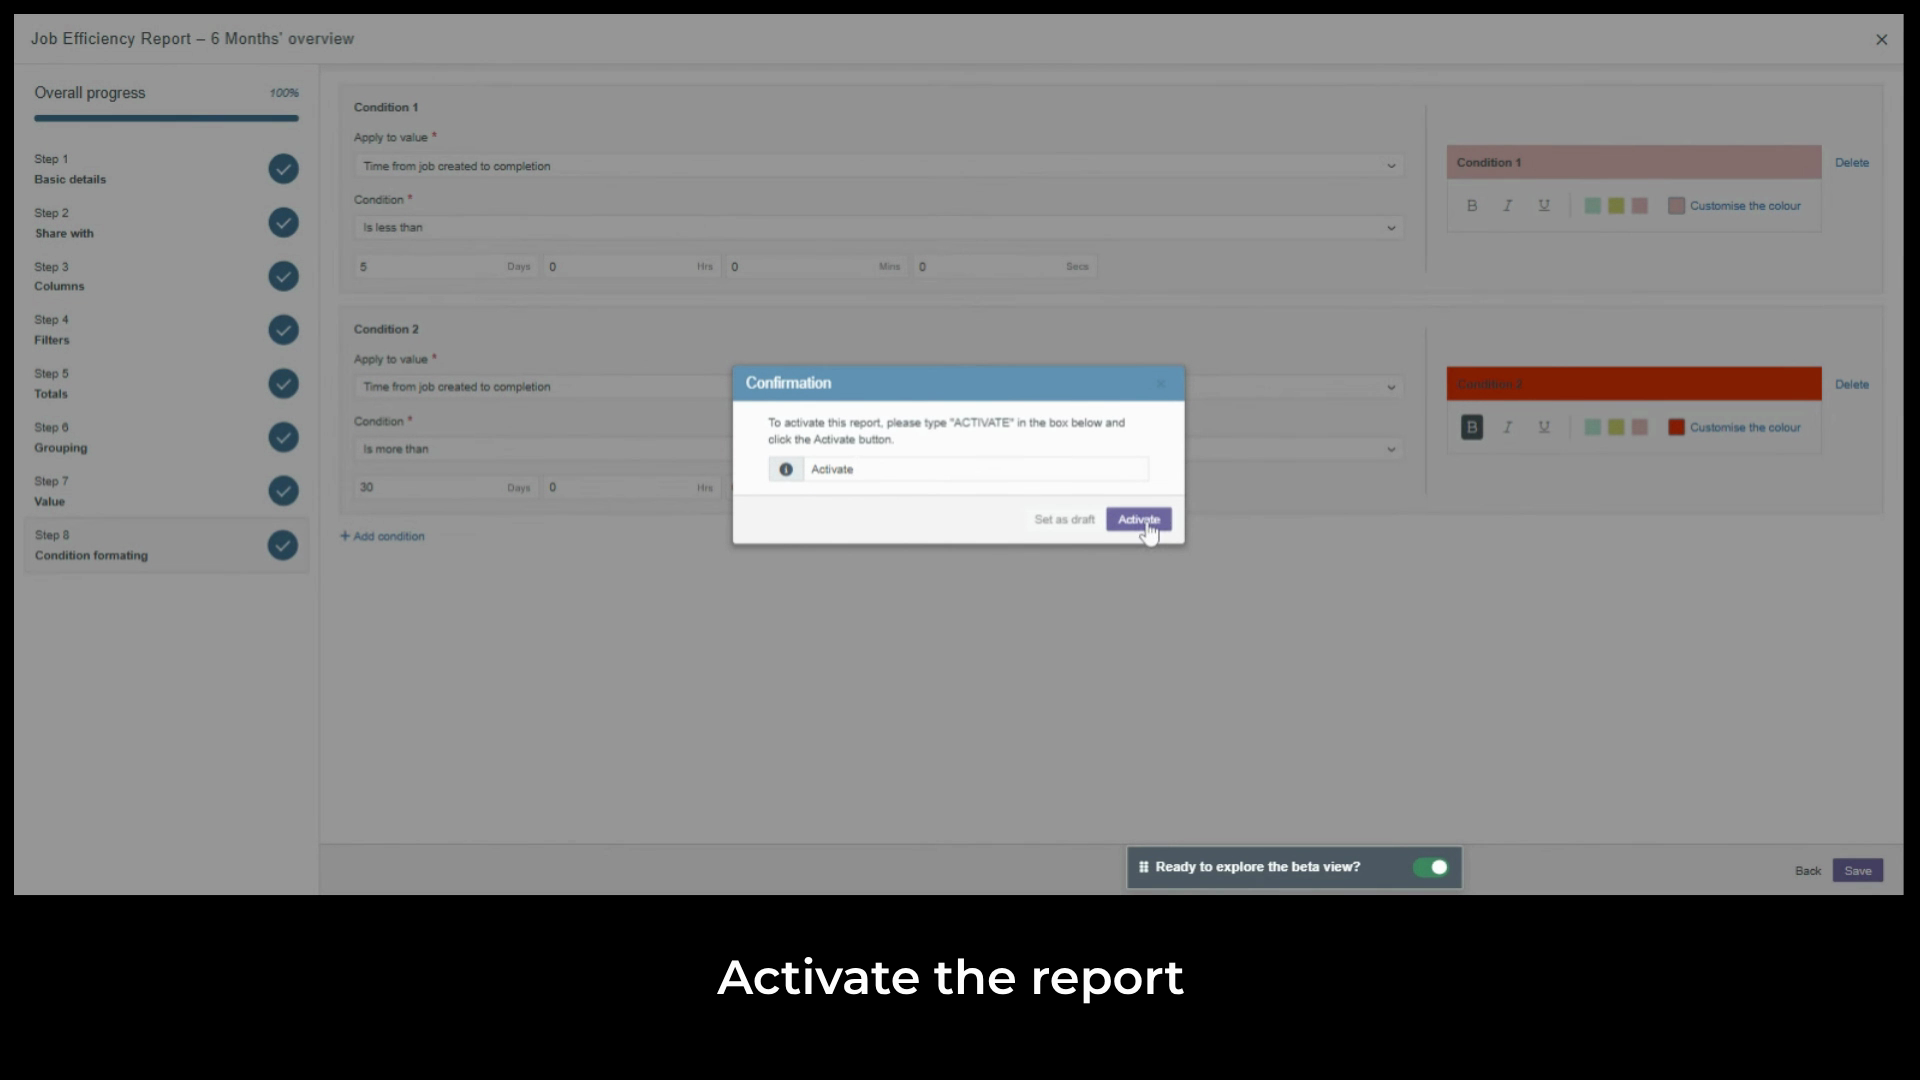
activate ours now.
Created on
Did you find this article helpful?