

Once you
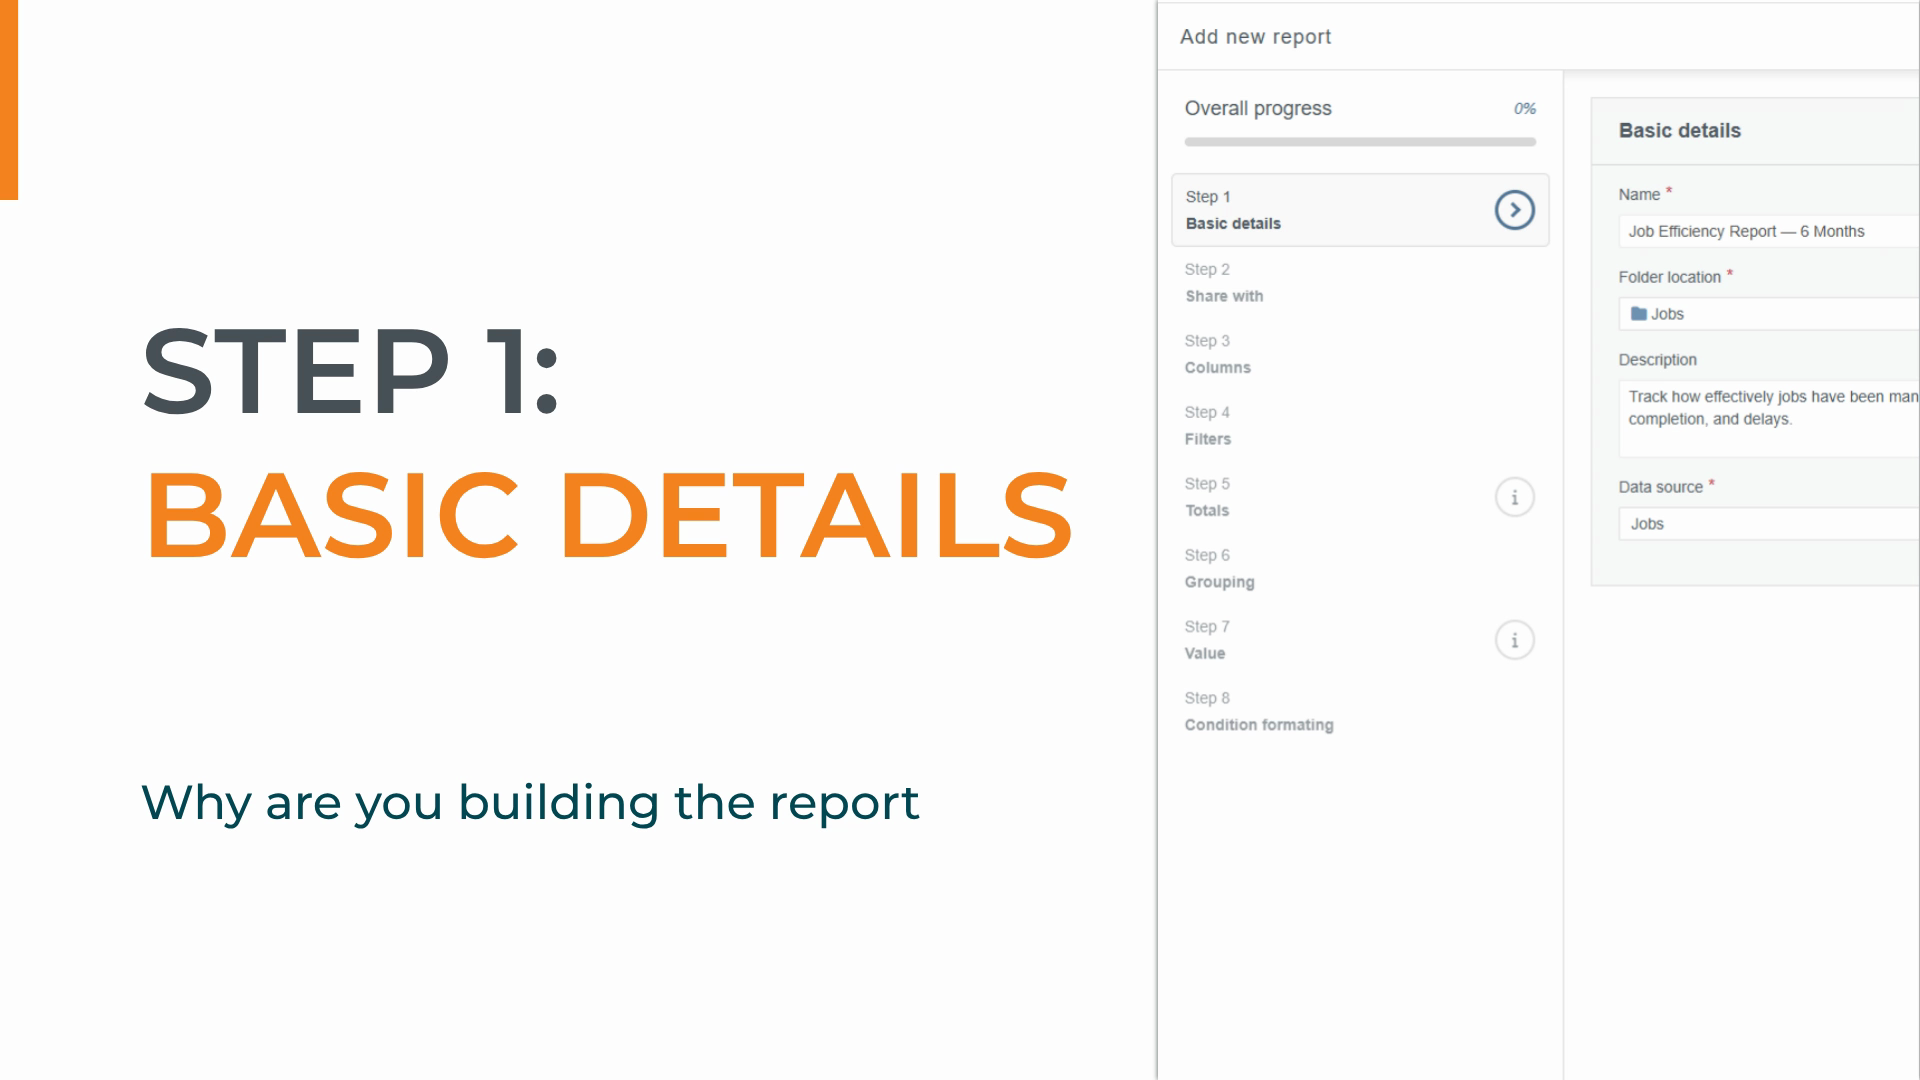
click Add, the Report Builder
opens with a progress menu on the left, tracking your position across all the steps. Let's take a
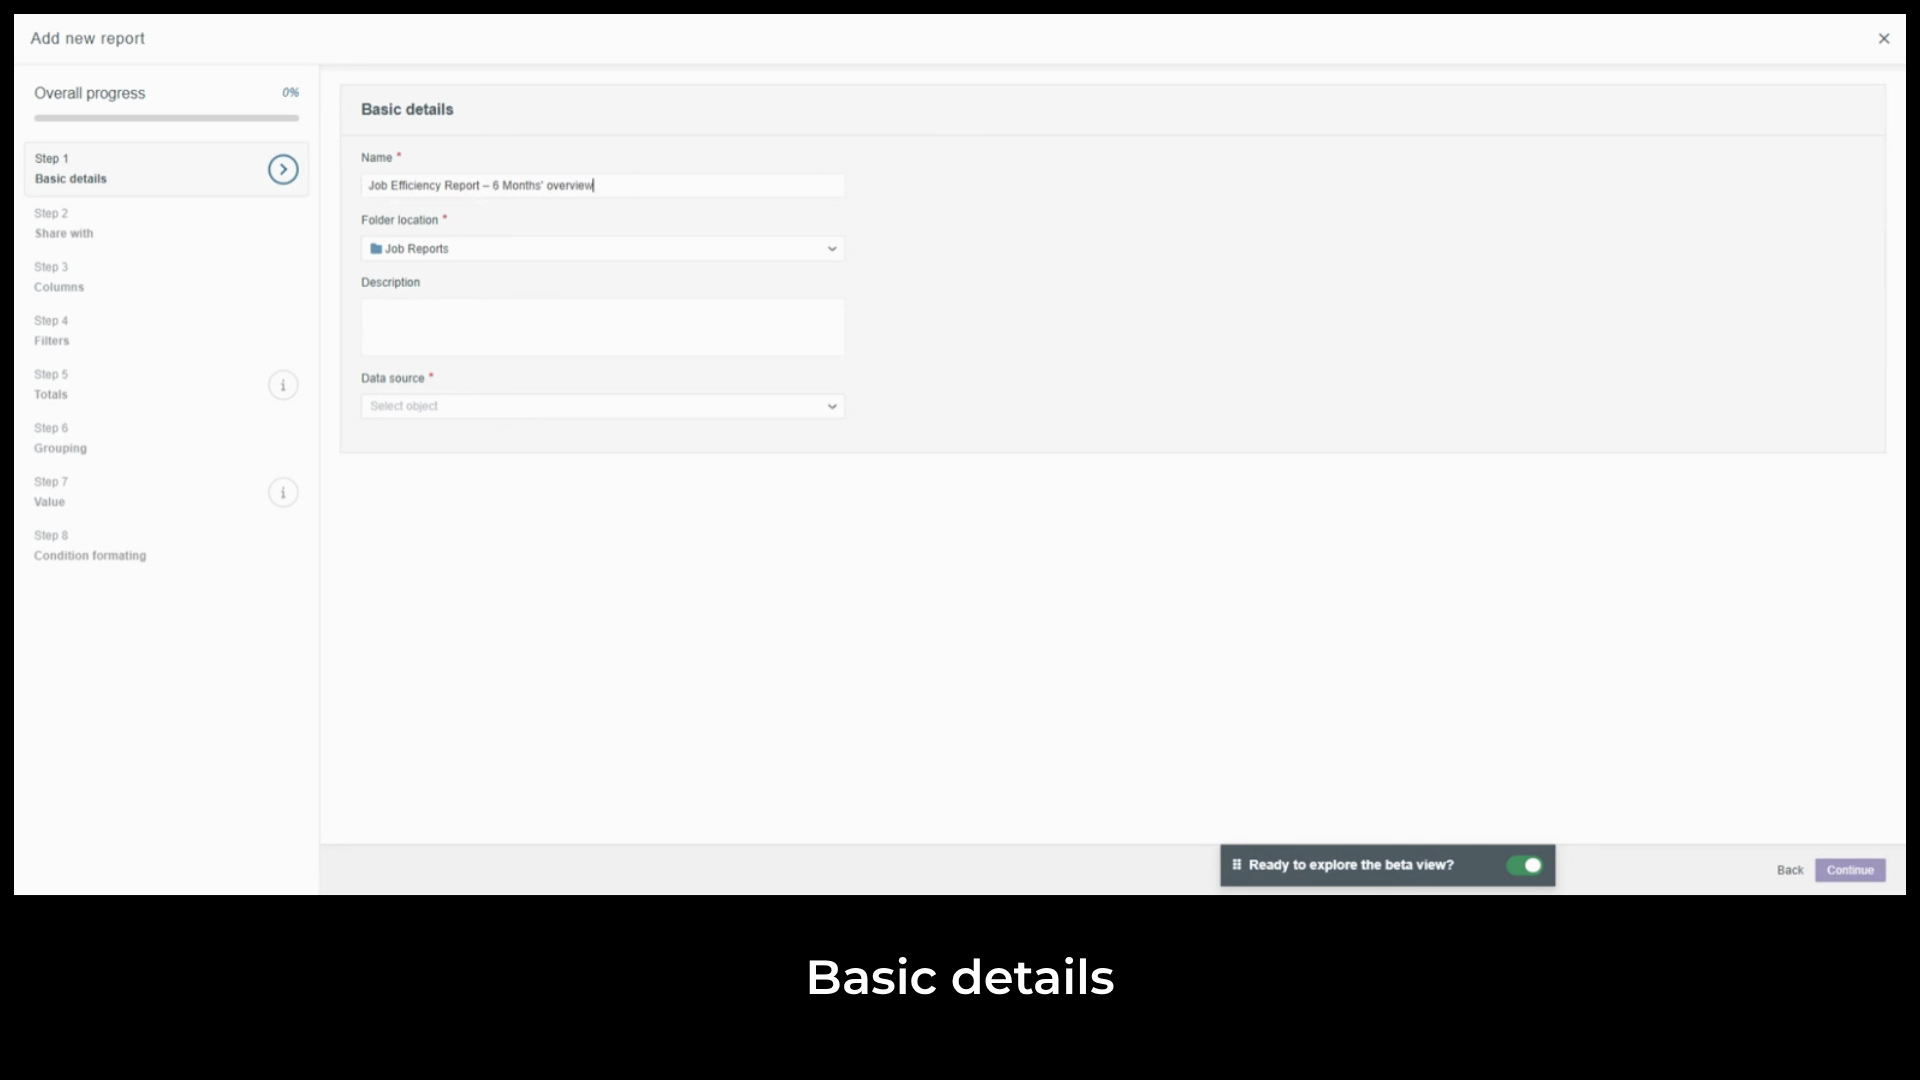
Job Efficiency report as our example. Step one is the basics. We'll name it
Job Efficiency Report six Months and add a short
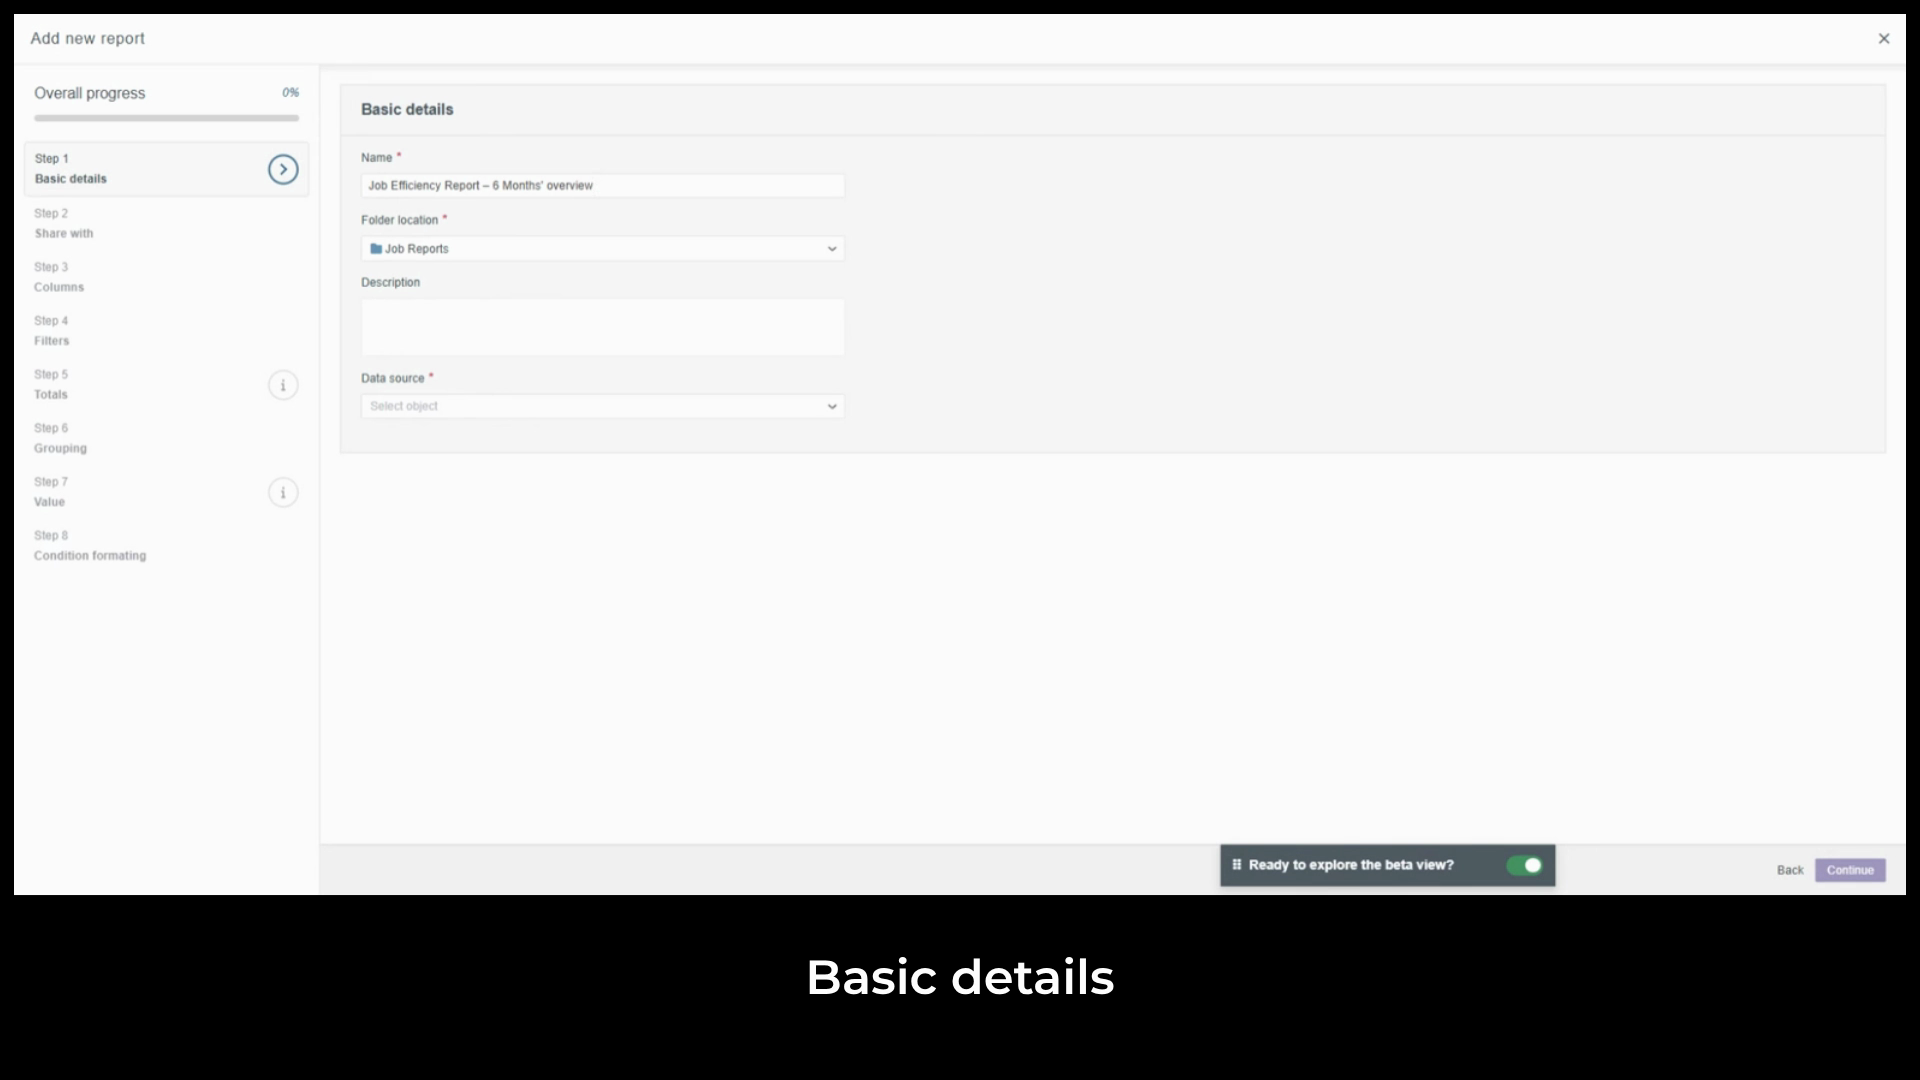
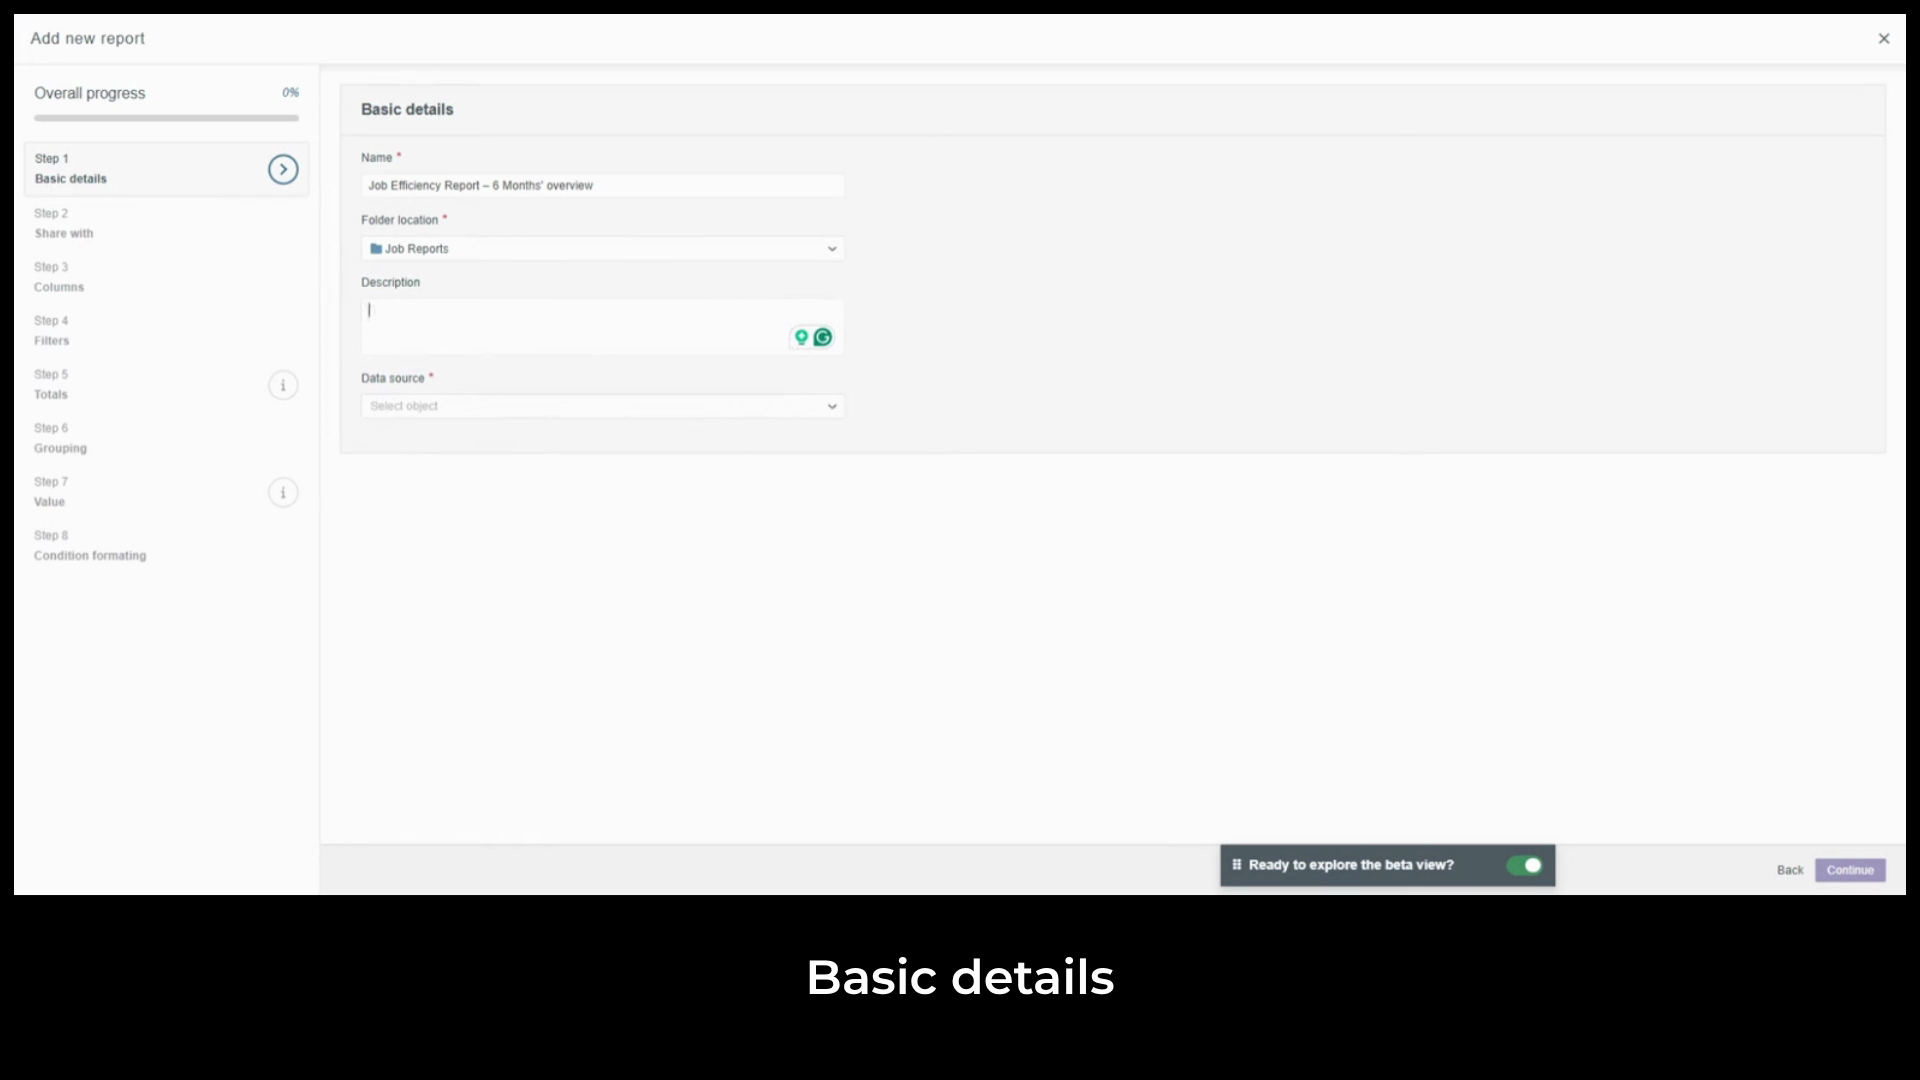
description. We aim to see how jobs have been managed over the past six months, tracking progress and delays to identify trends. The
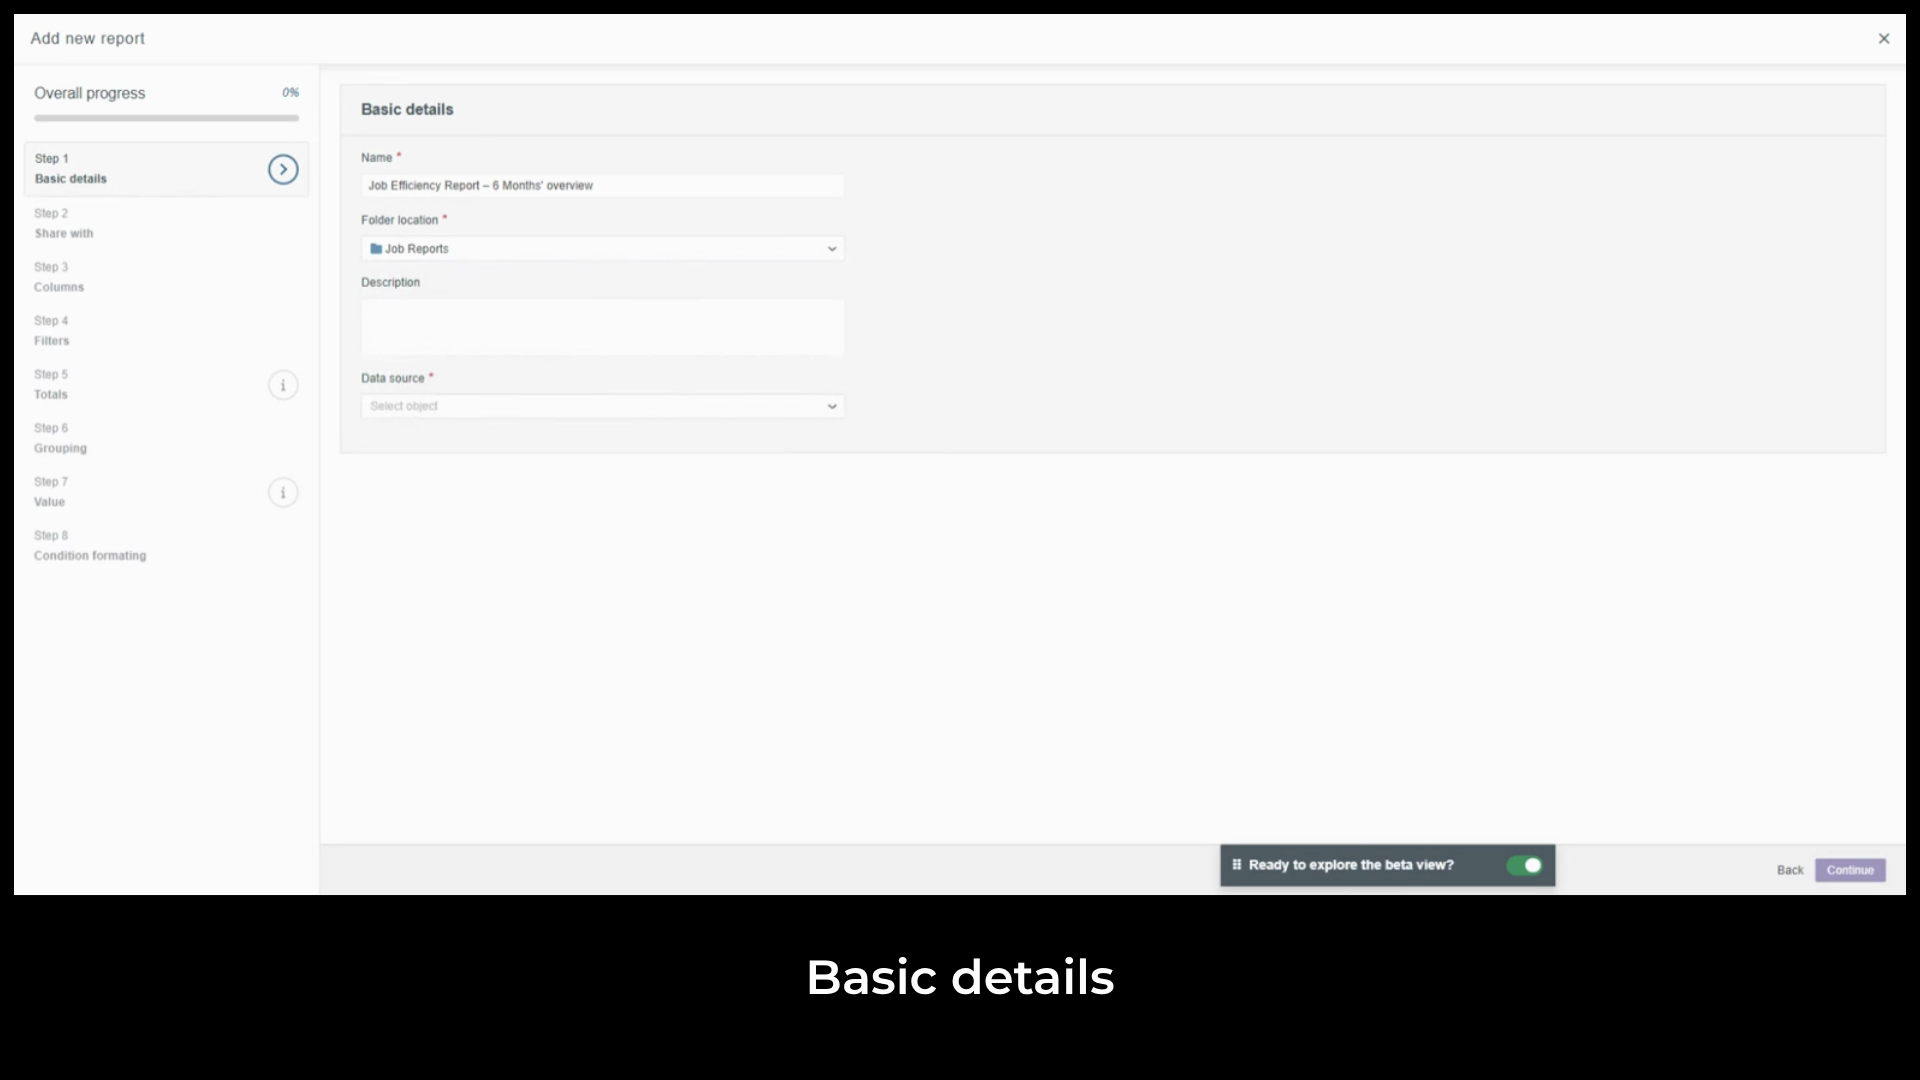
folder location is set to where you clicked Add. Use the
dropdown to change it if needed. The data source is the most important field. The same
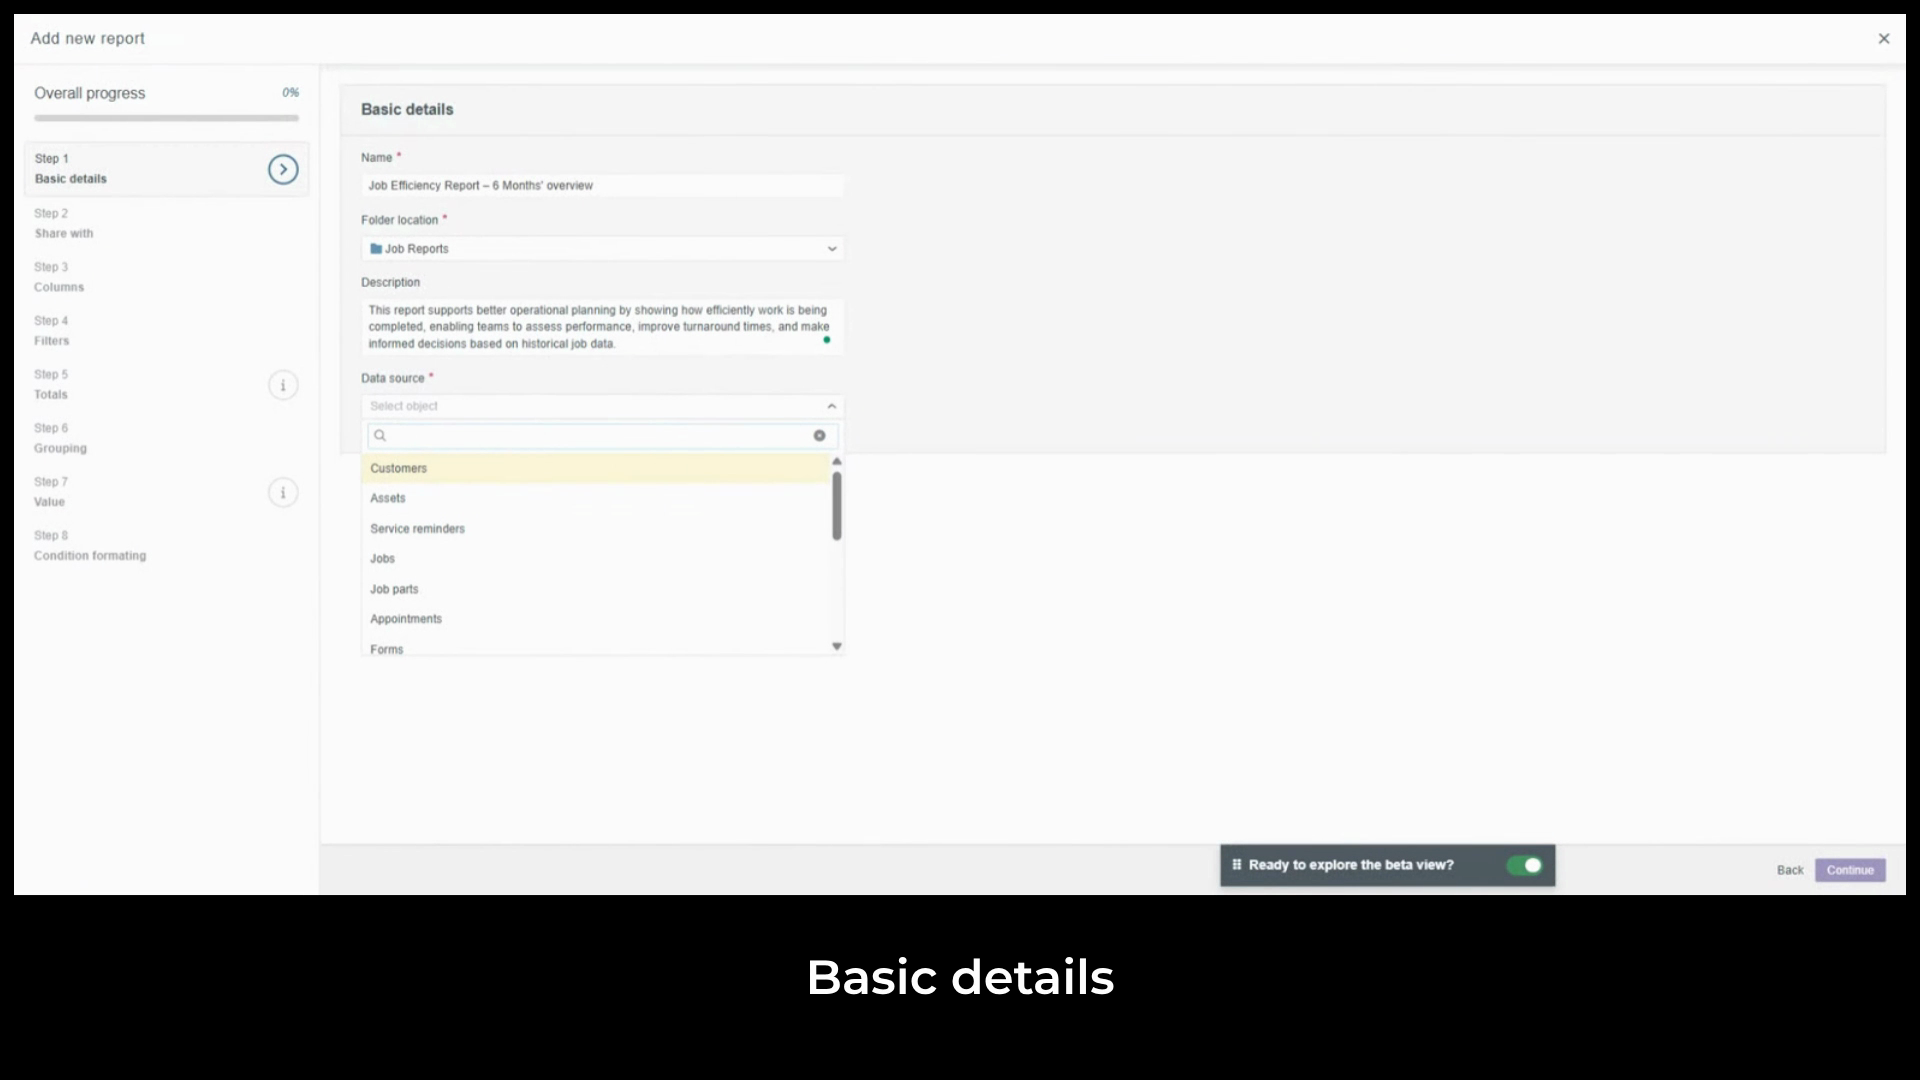
object hierarchy we covered in key terms applies here. Start at the lowest level of detail you need and everything above it becomes available. We'll
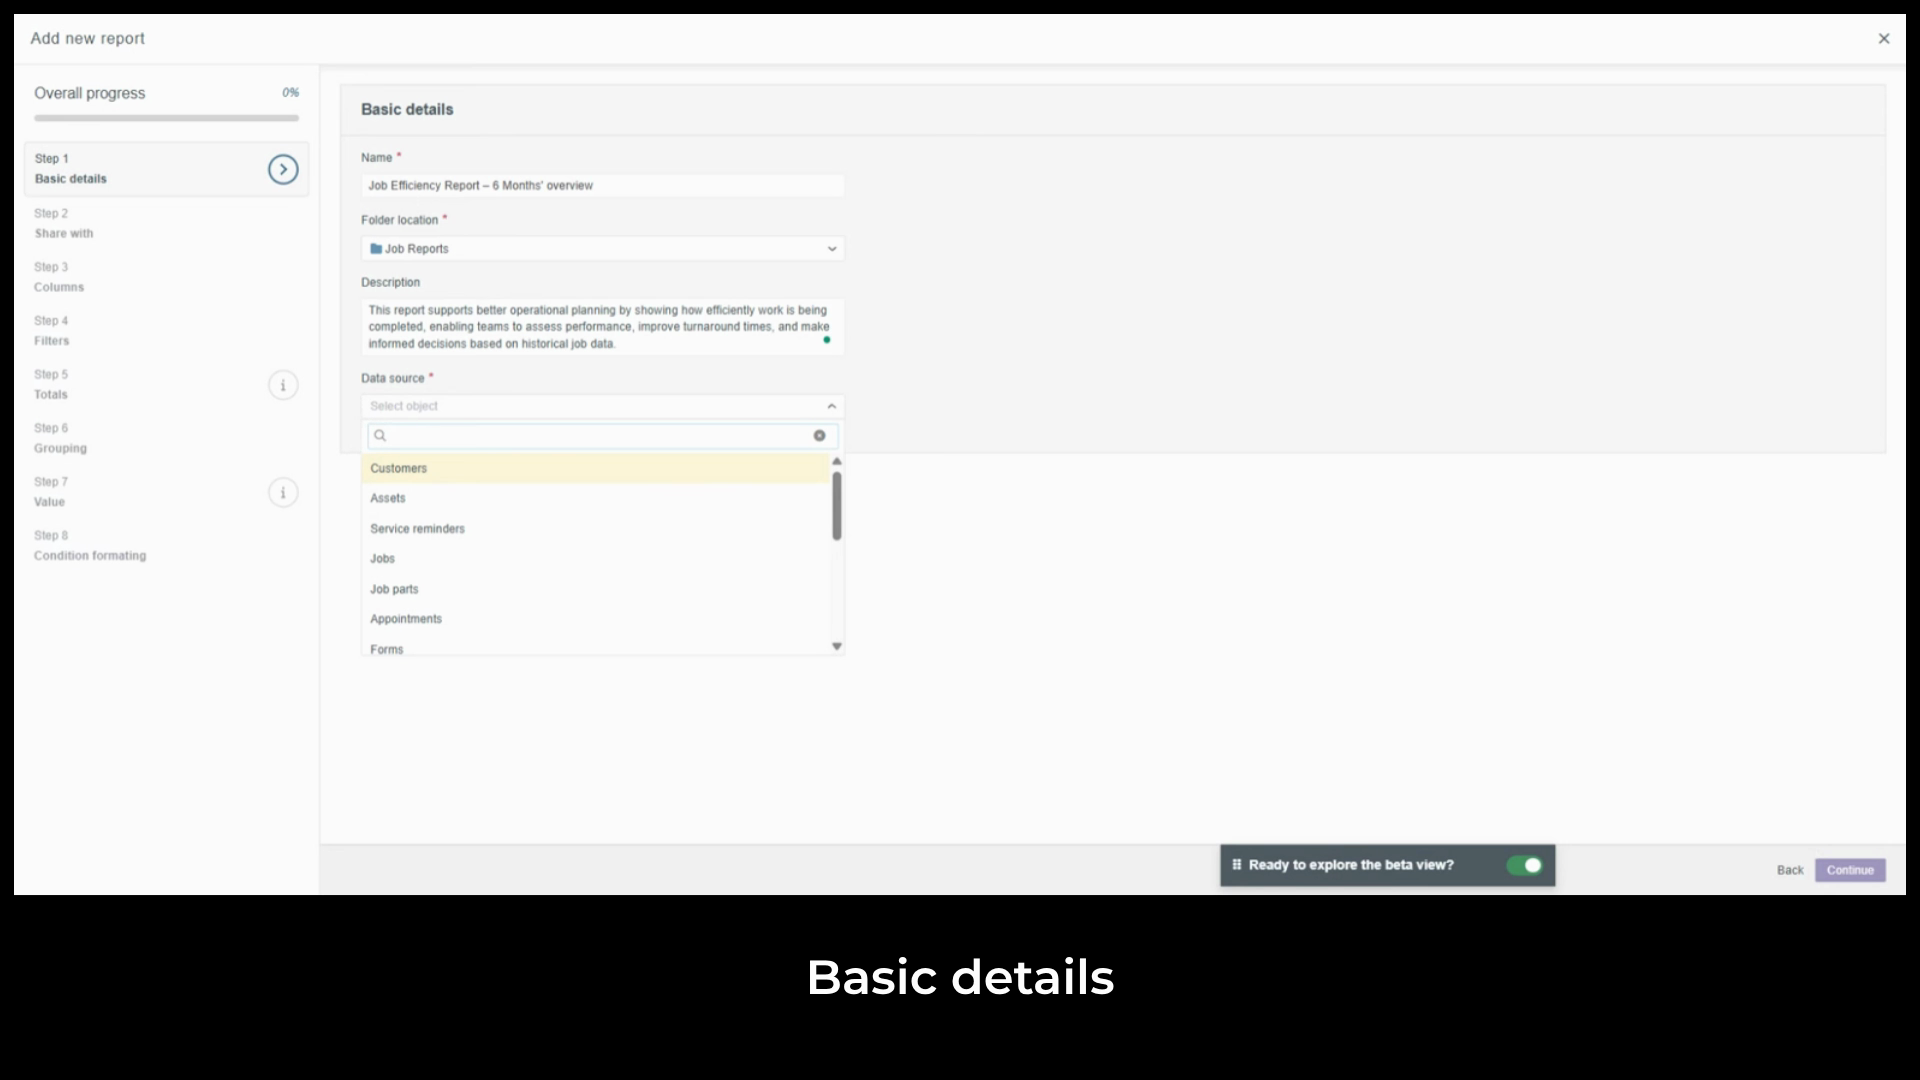
select Jobs. This also gives us access to the associated customer data sitting above it. Step two is
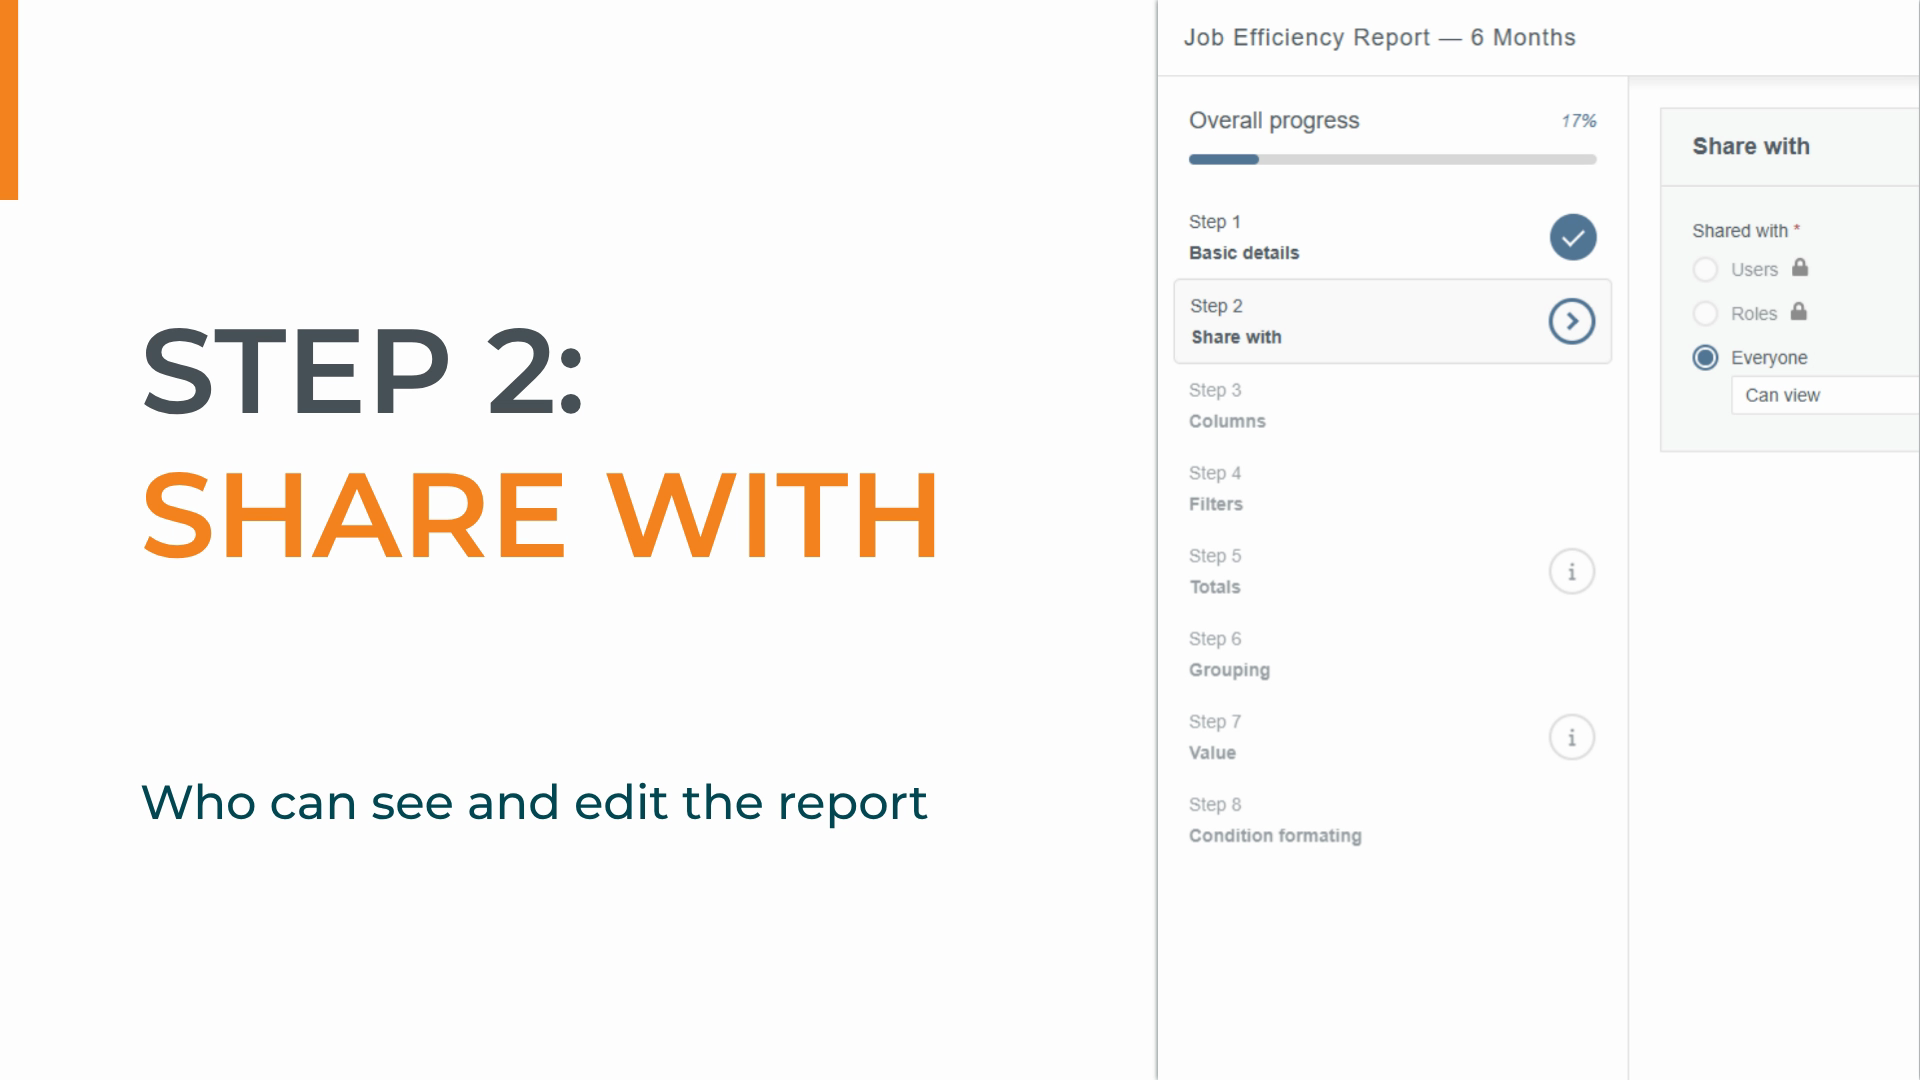
Share with you. This is where we control who can see and edit the report before it goes live.
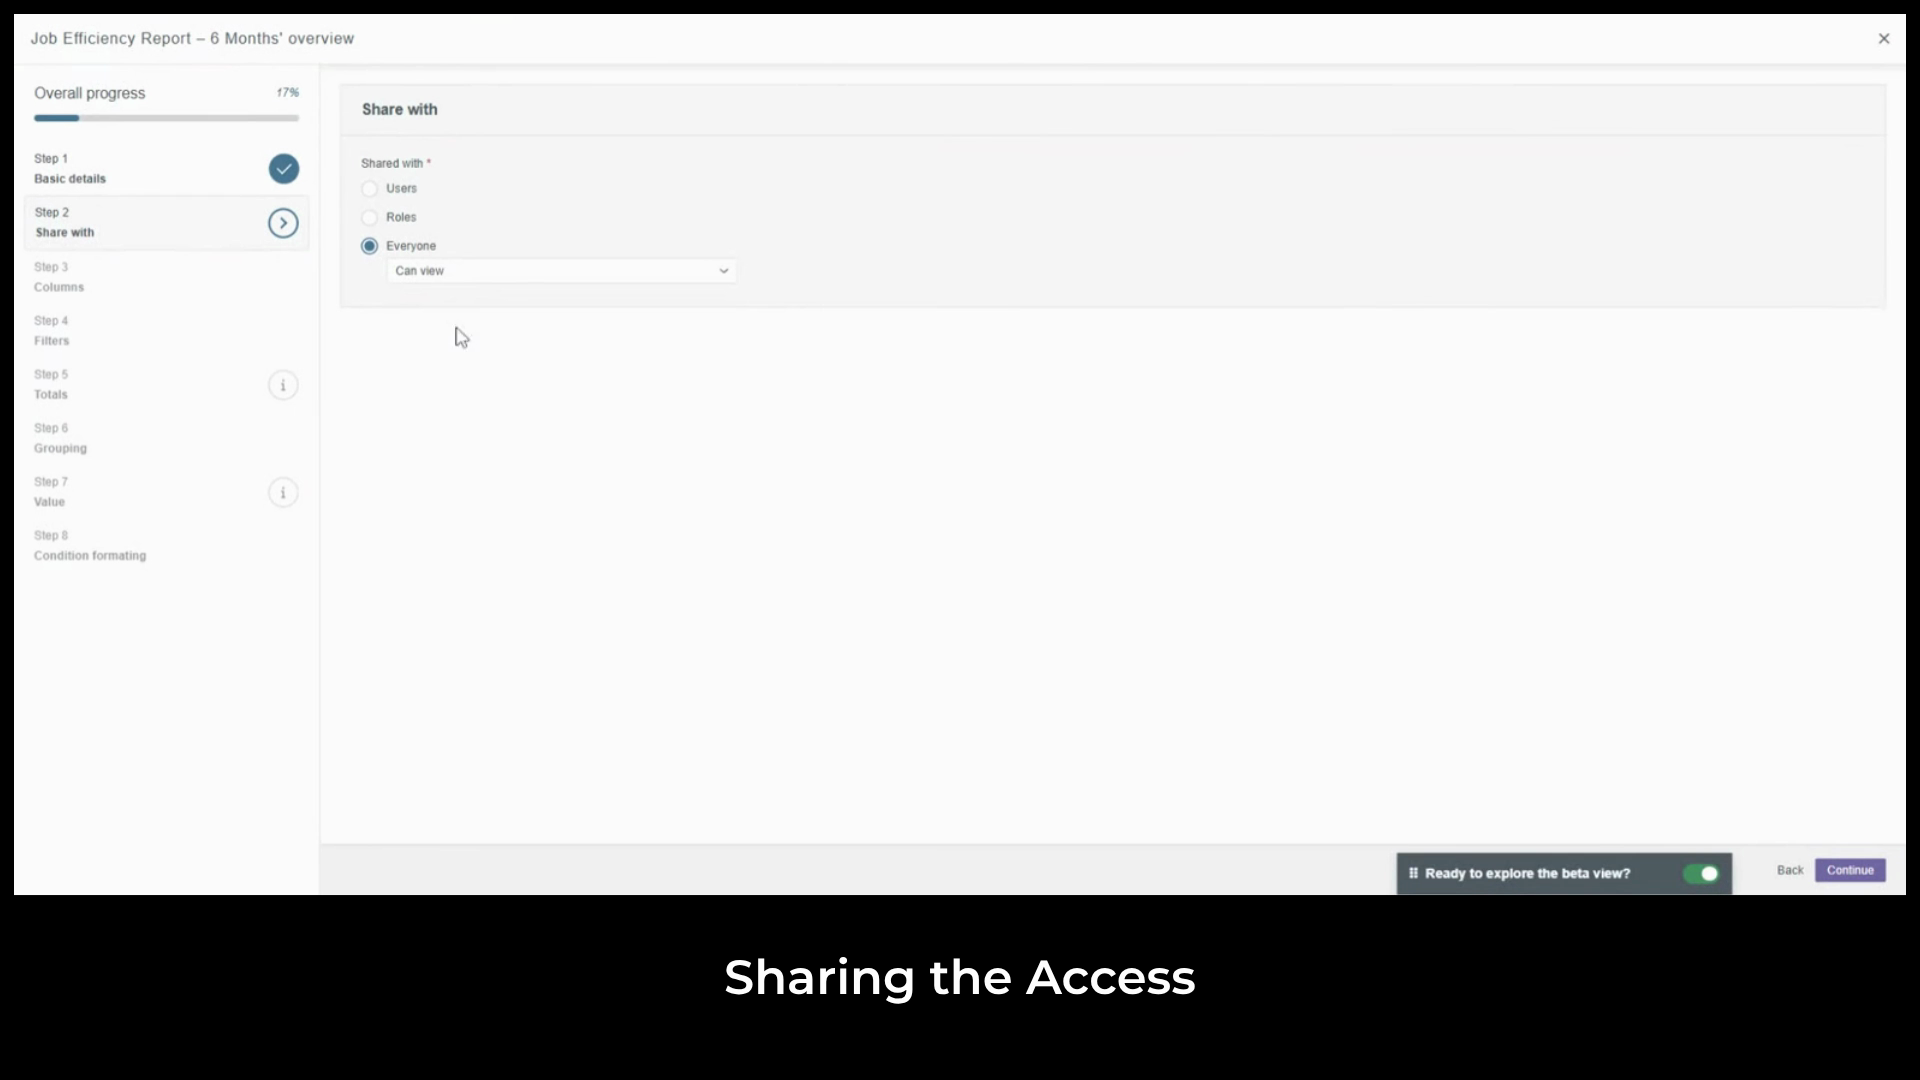
Tabular reports you create are visible to everyone in the account by default. On analytics plus, you can
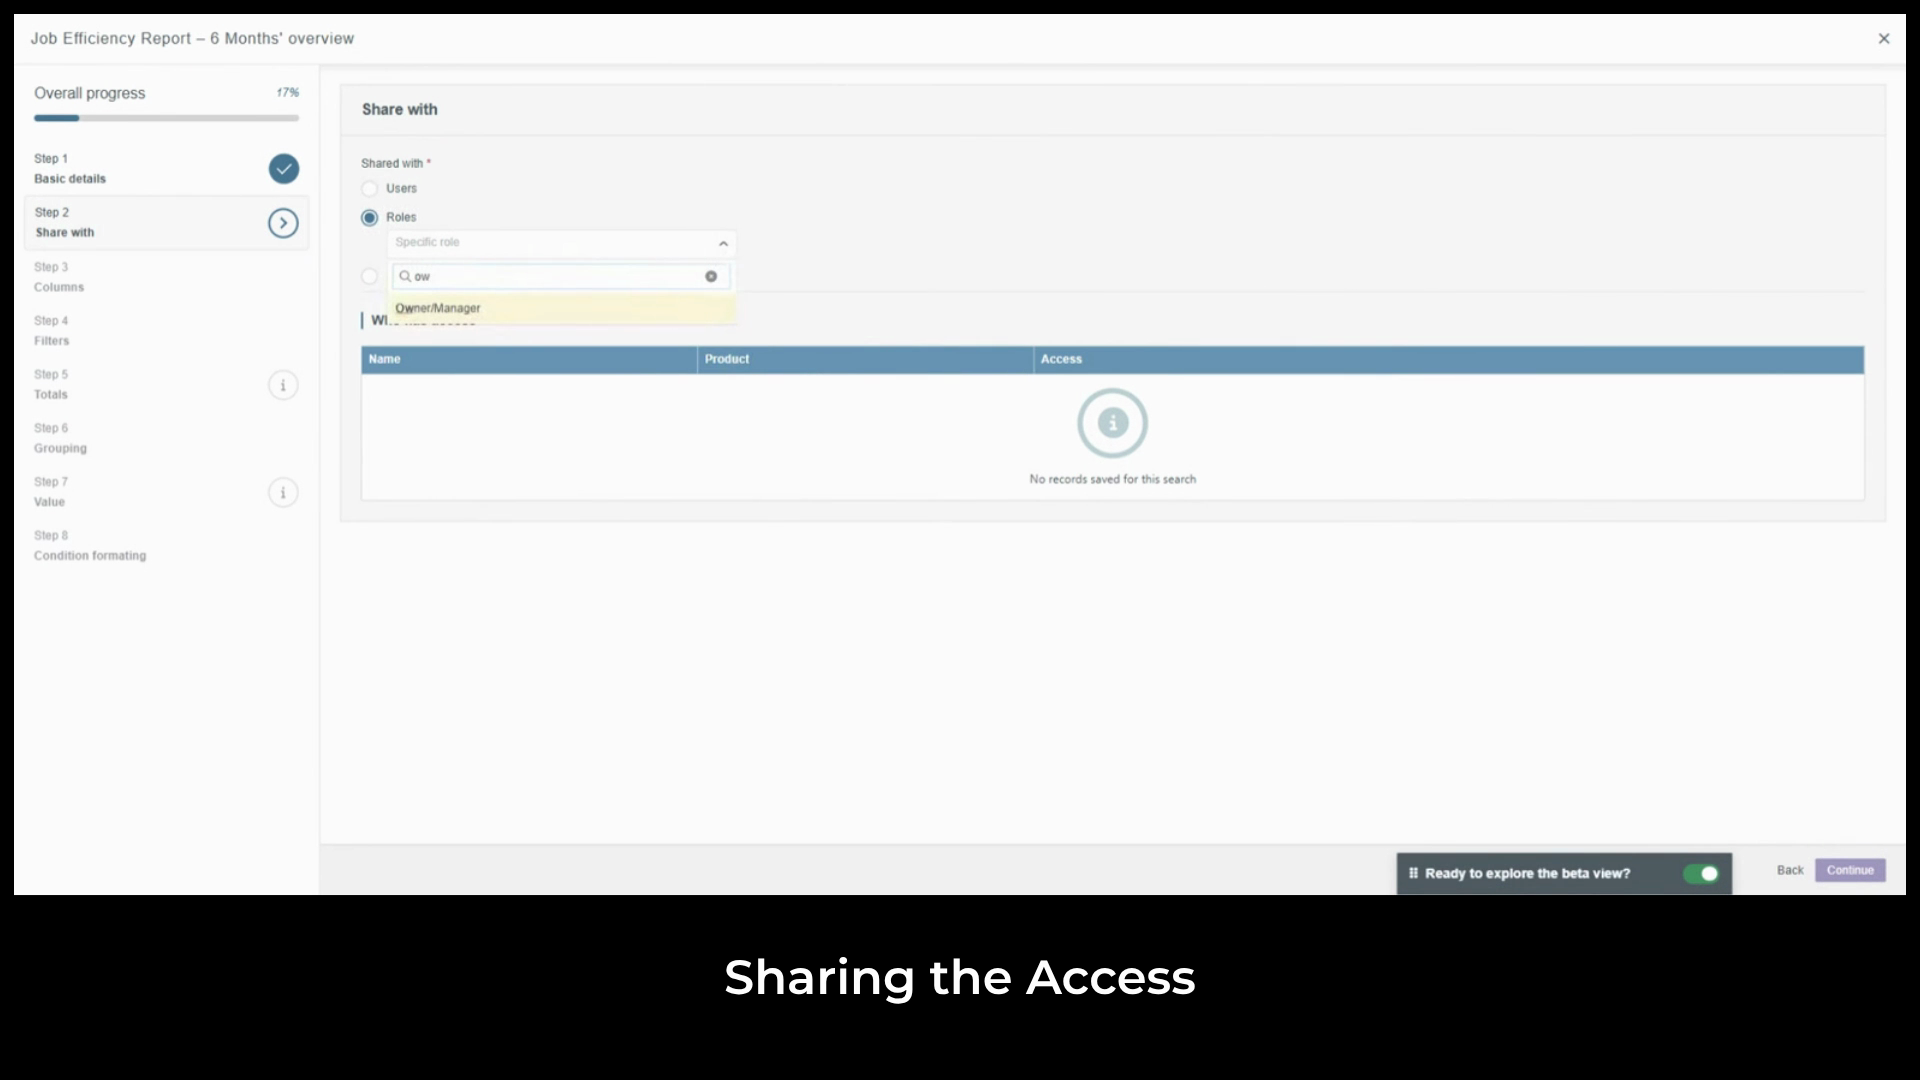
restrict access to specific users or roles and set permission levels of Can View or Can View and Edit. Step three
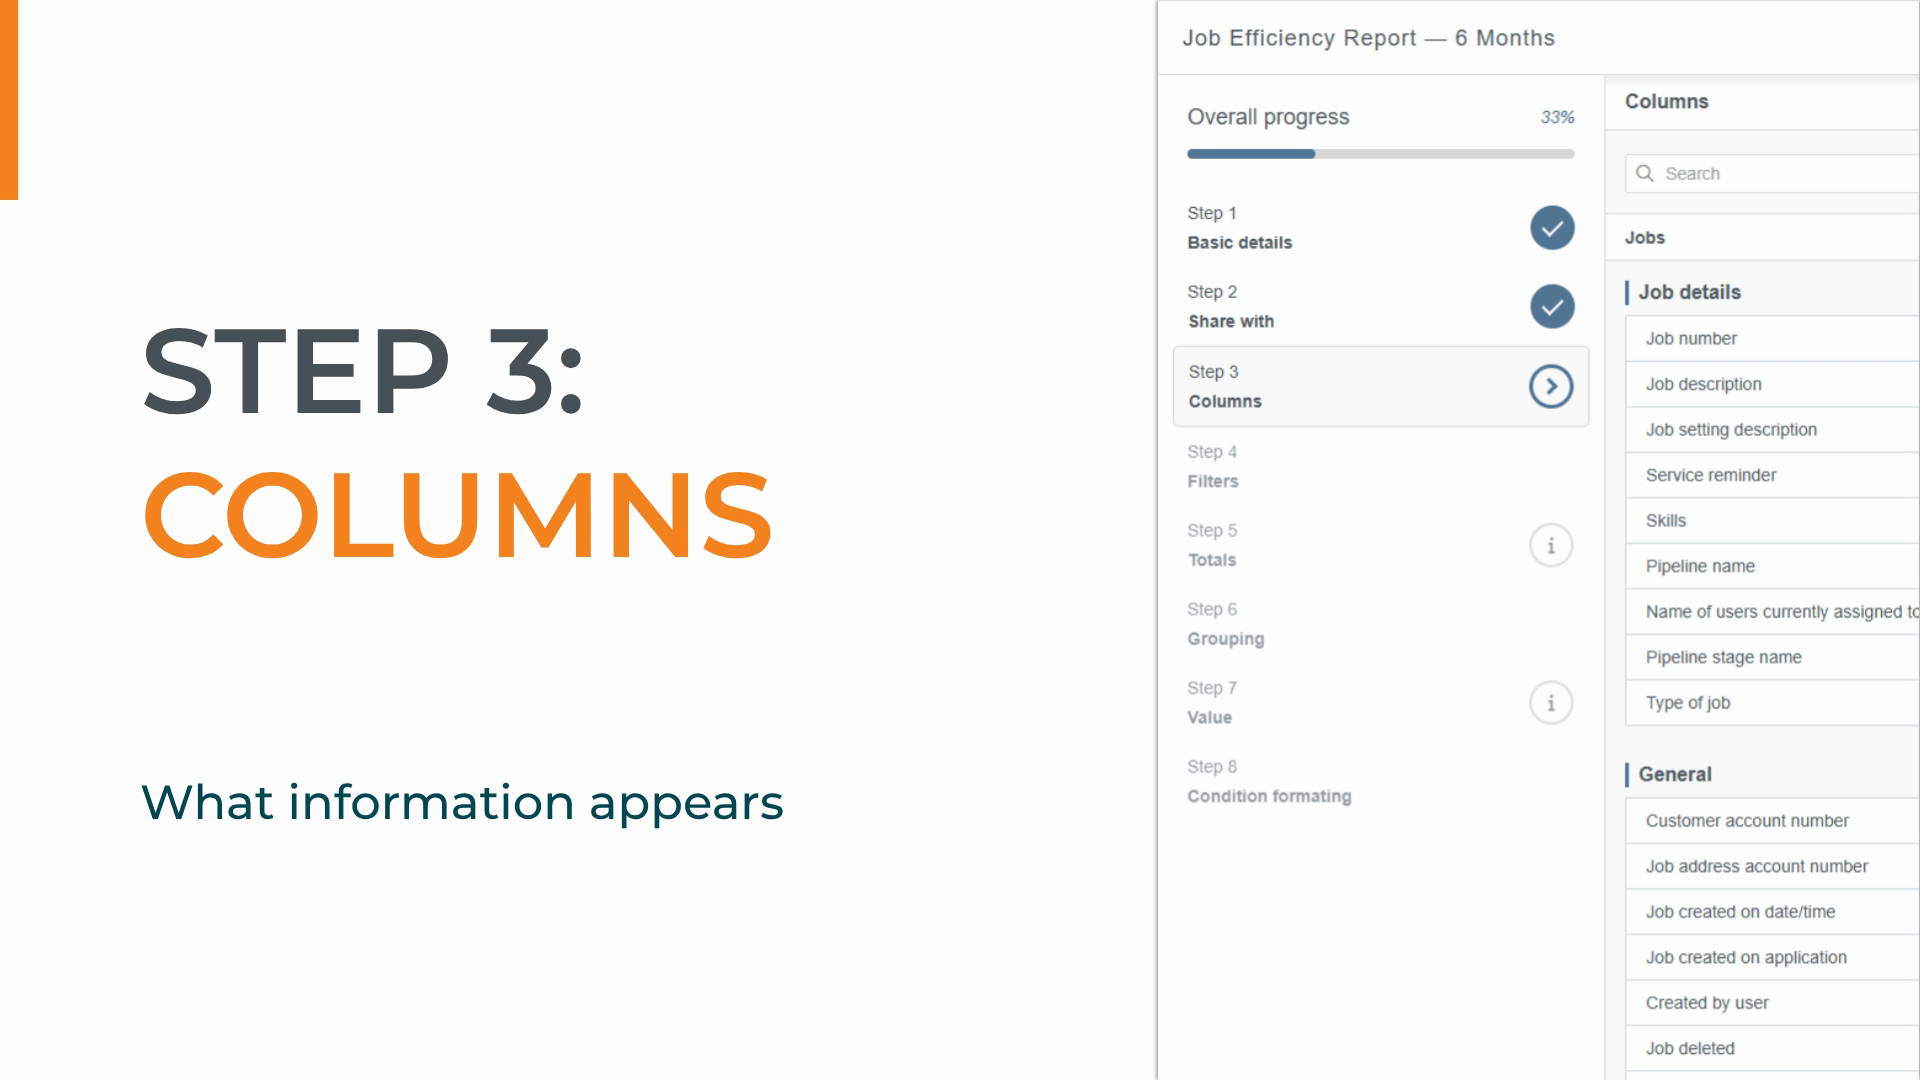
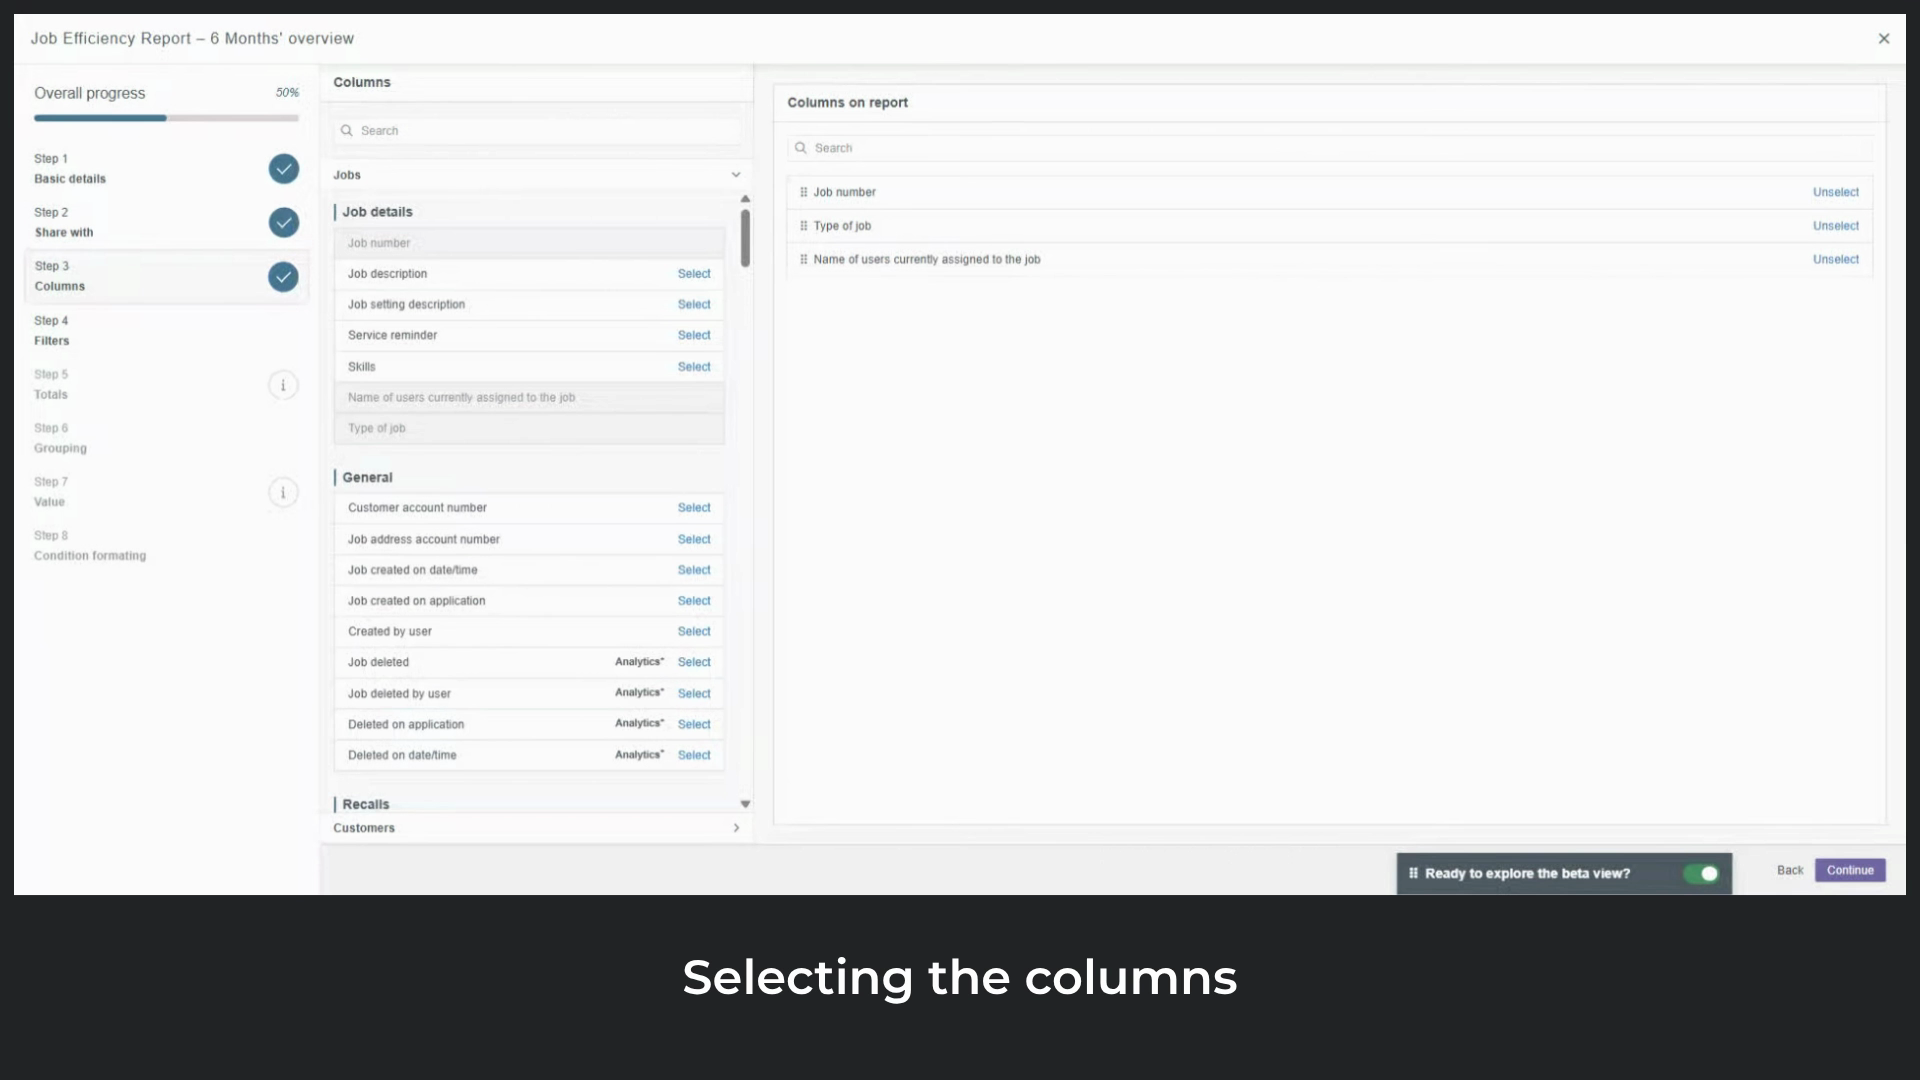
is Columns. This is where we decide exactly what information appears in the report. On the left is a
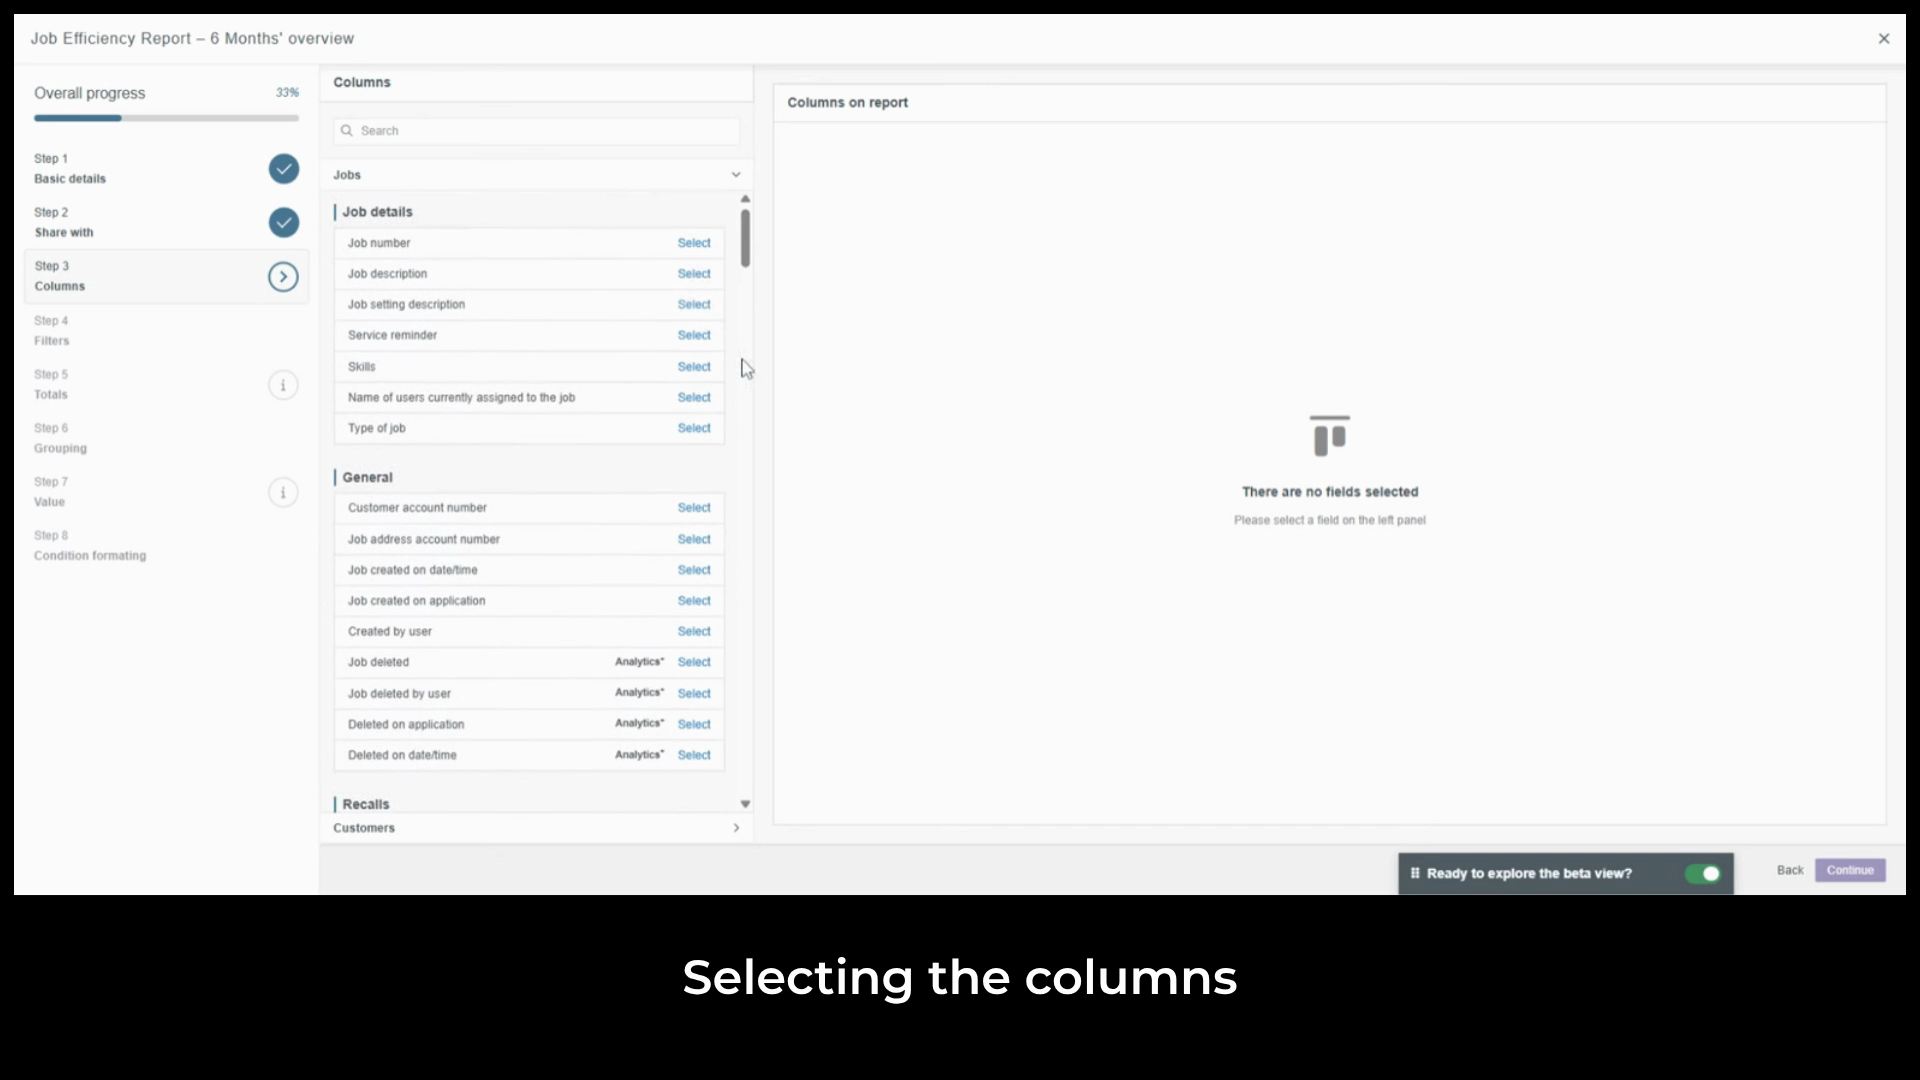
categorized list of all fields available based on your data source. Each field you
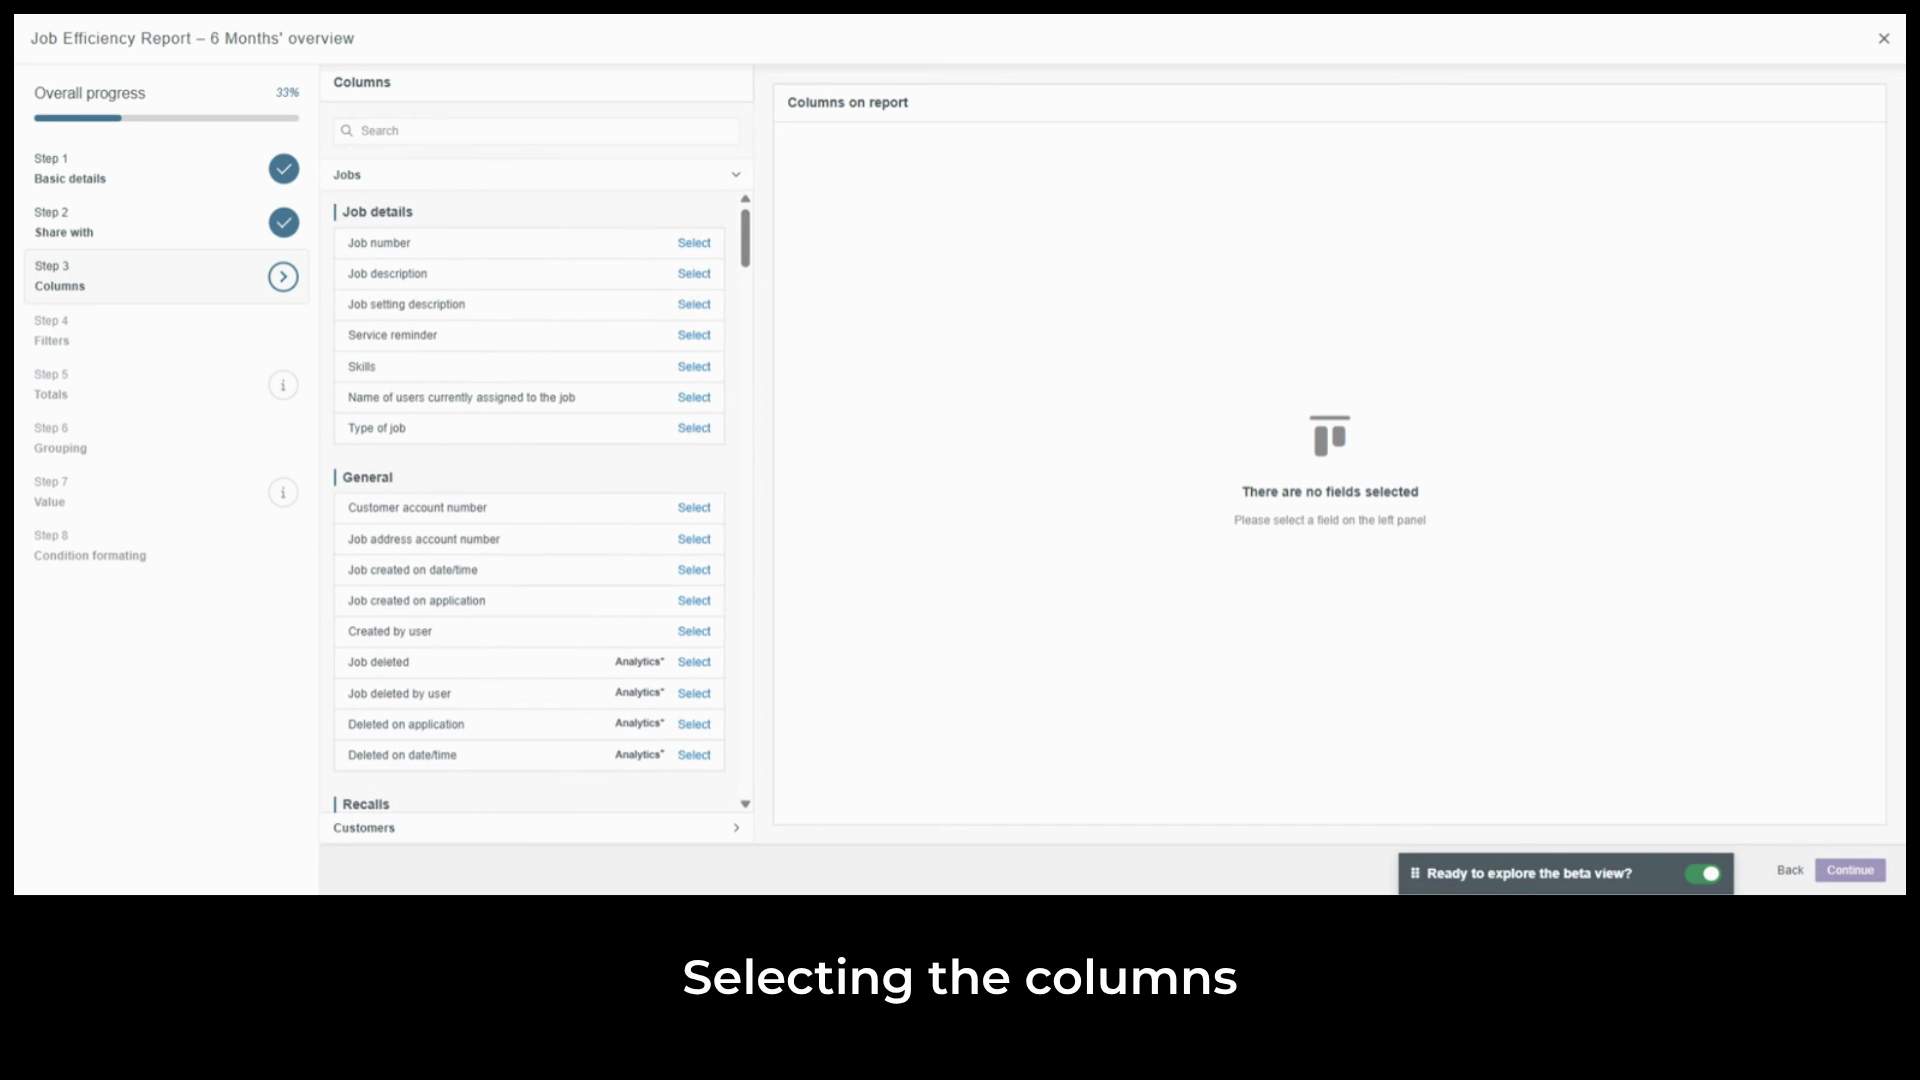
select becomes a column in the final report. The
preview on the right updates as you make selections. We'll start by
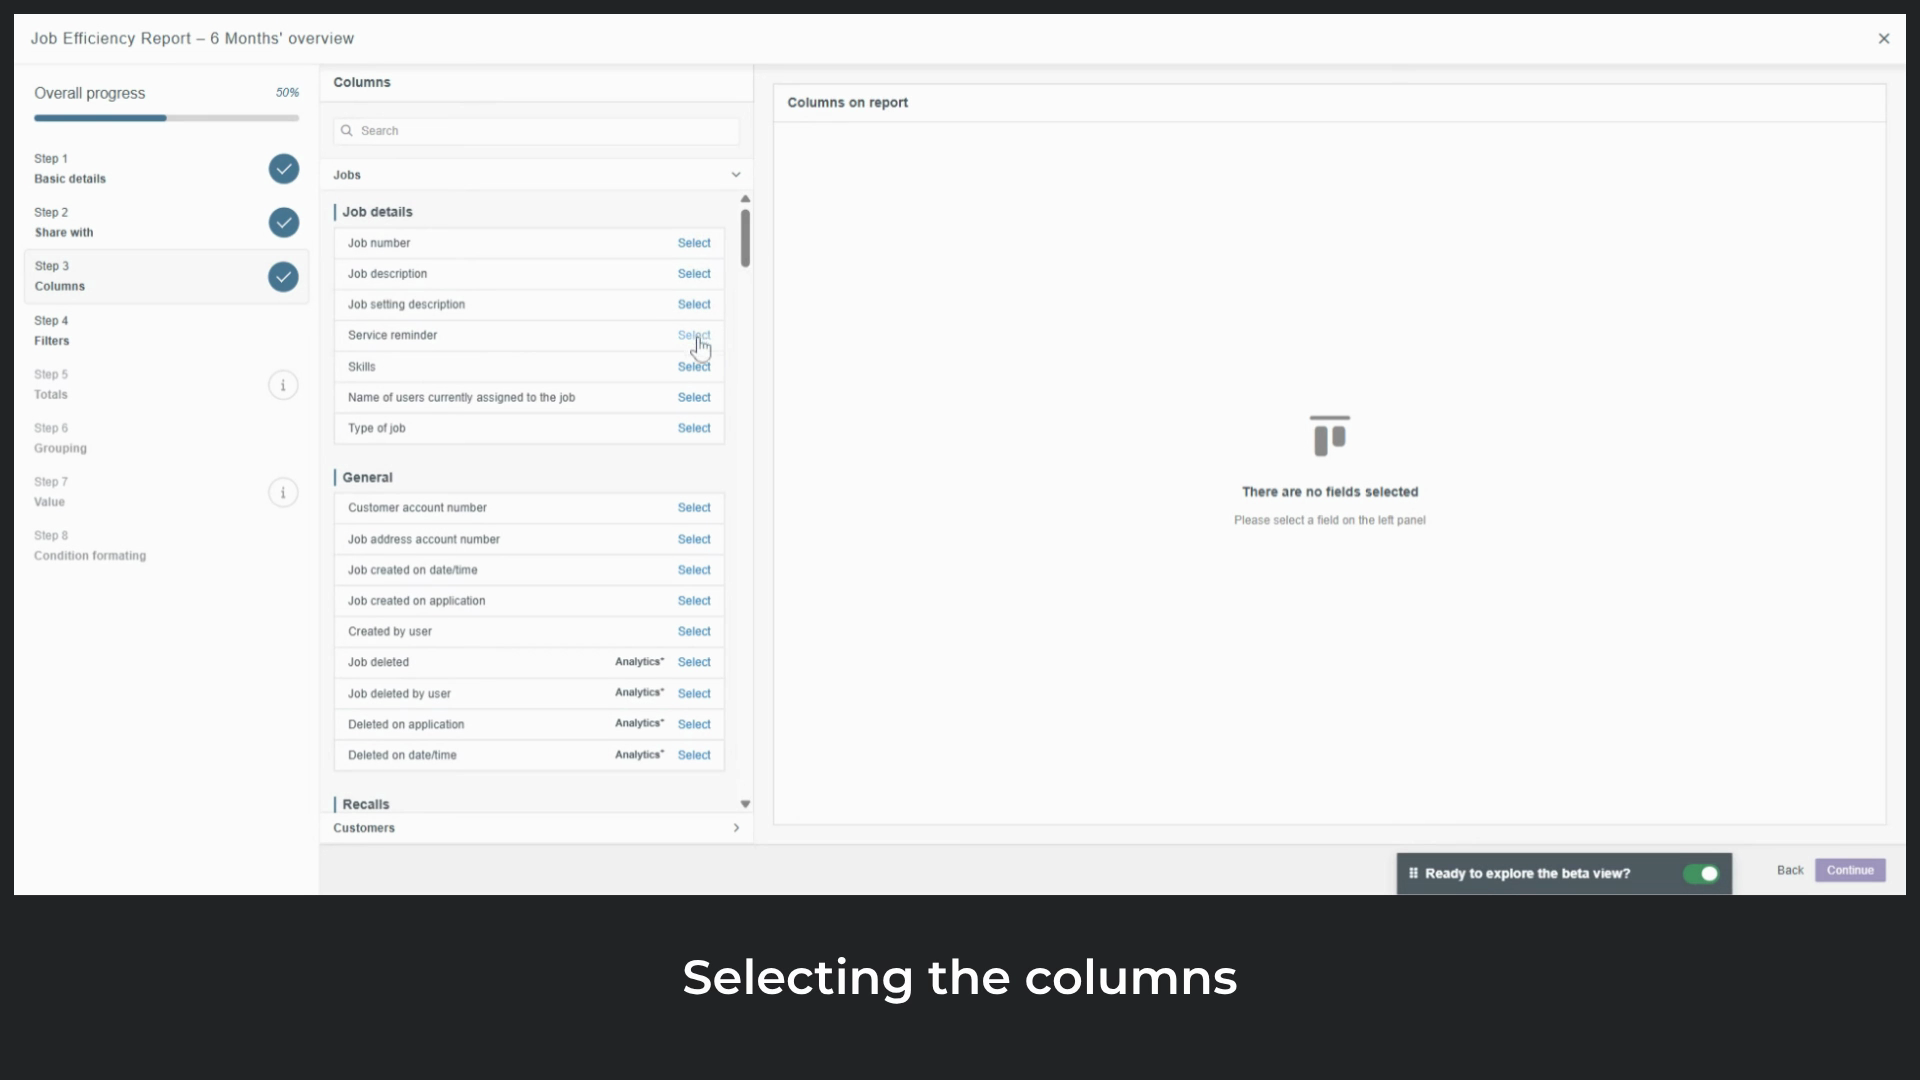
selecting the columns that give us a picture of how long jobs are taking. The first is
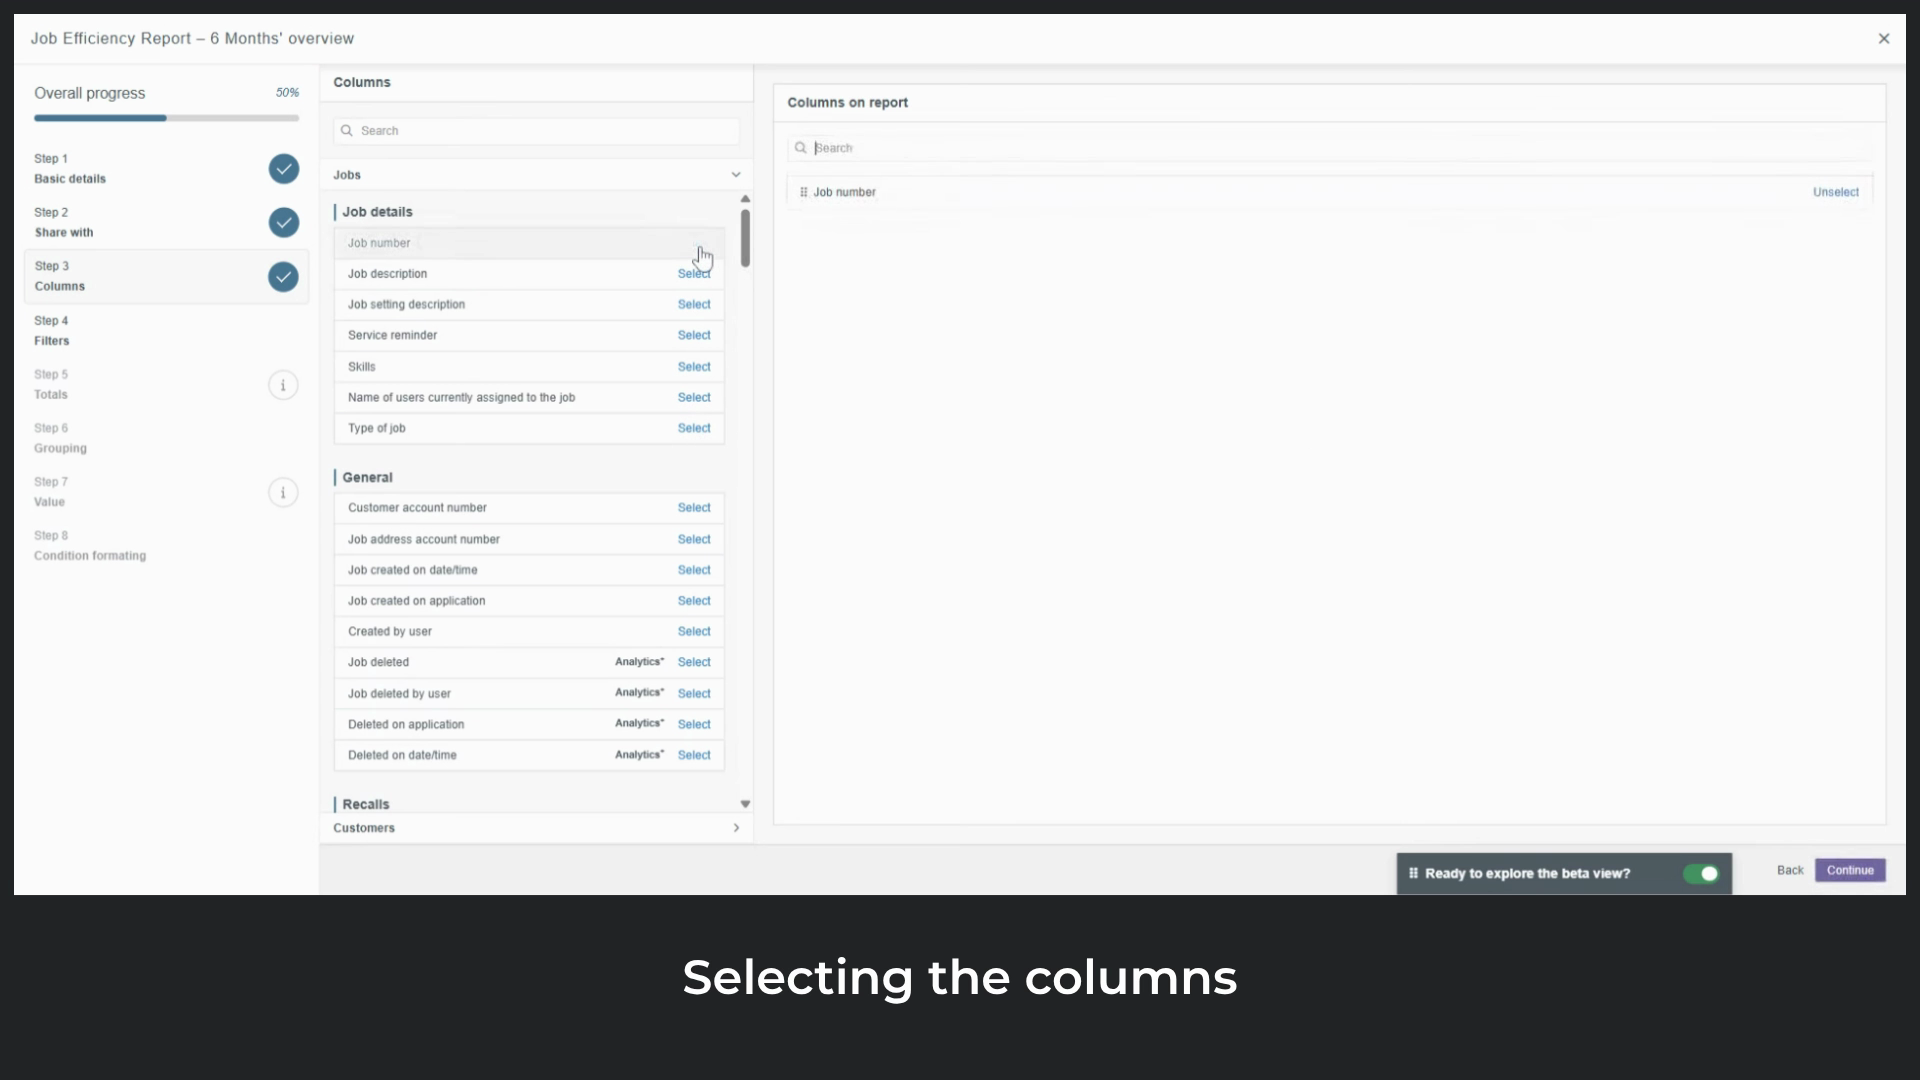
Job number, which uniquely identifies each completed job. Next,
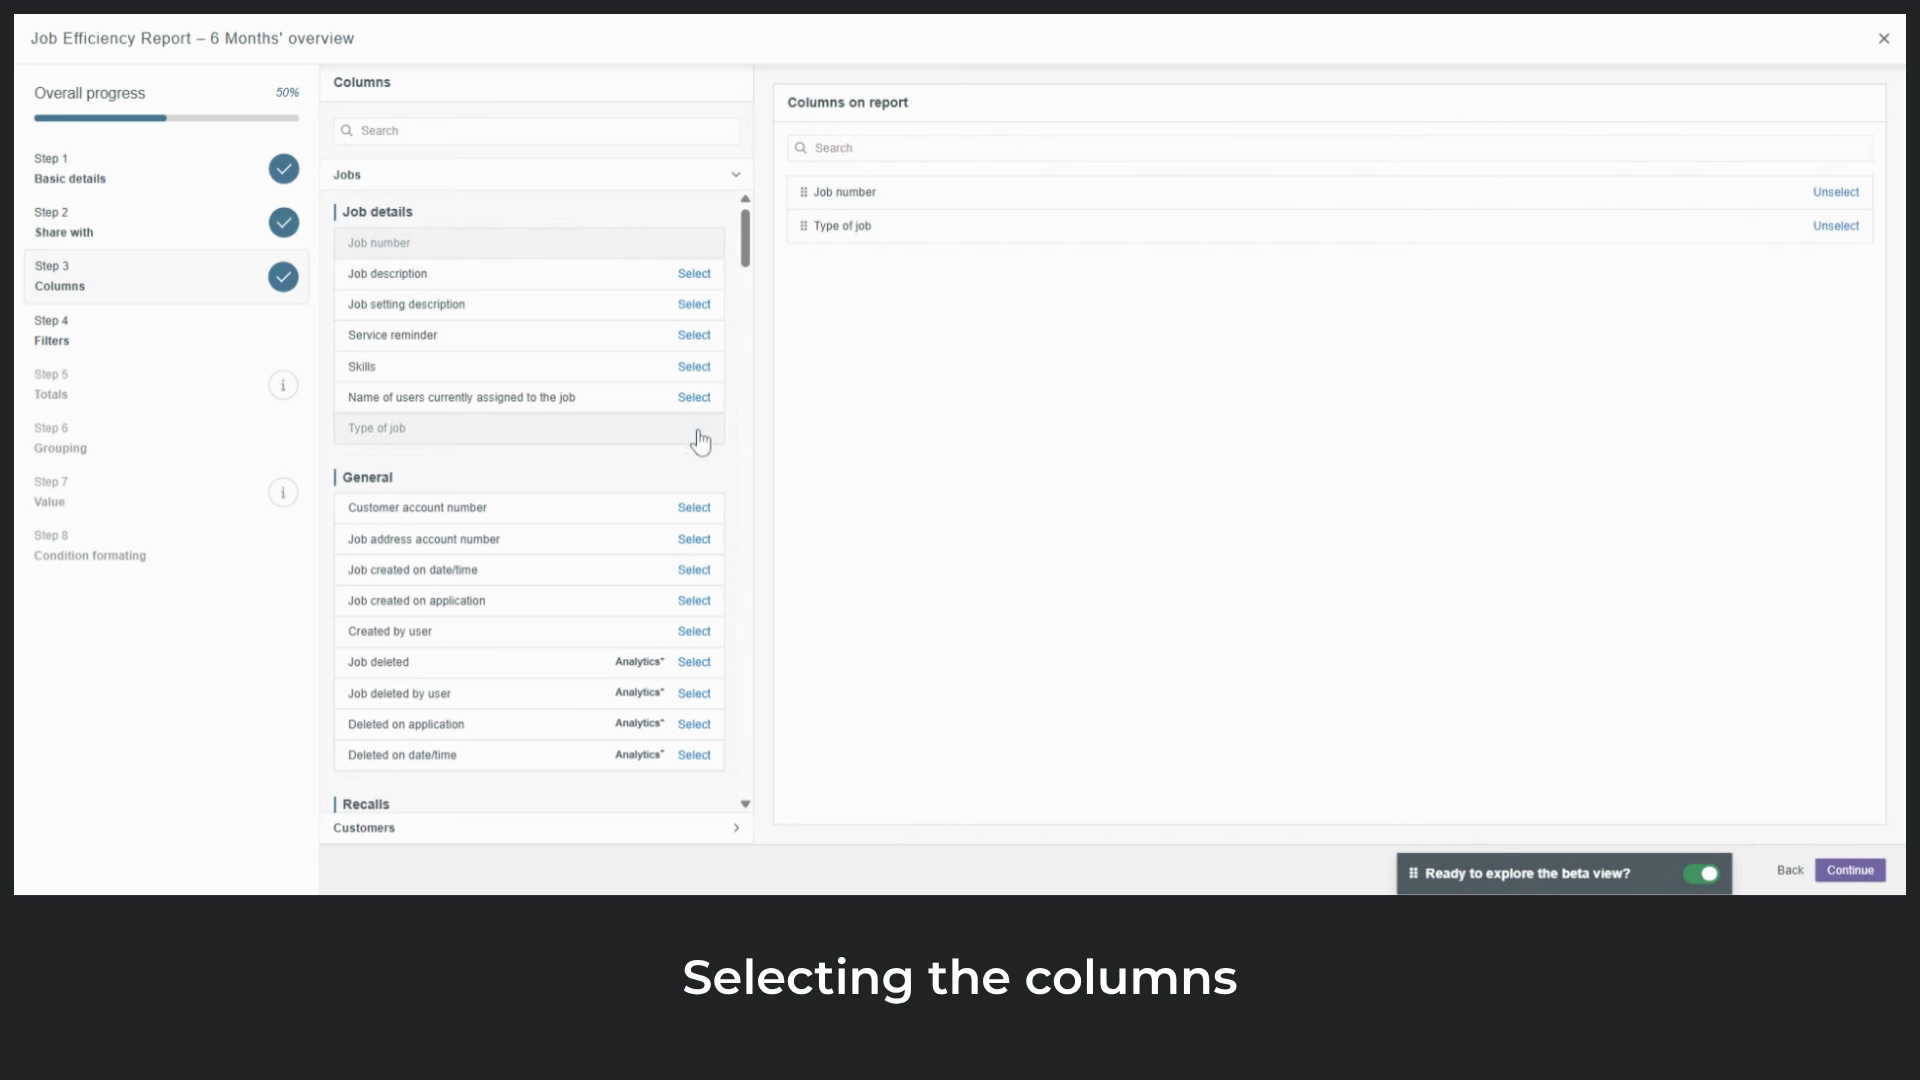
add type of job to see the categories of work. Select
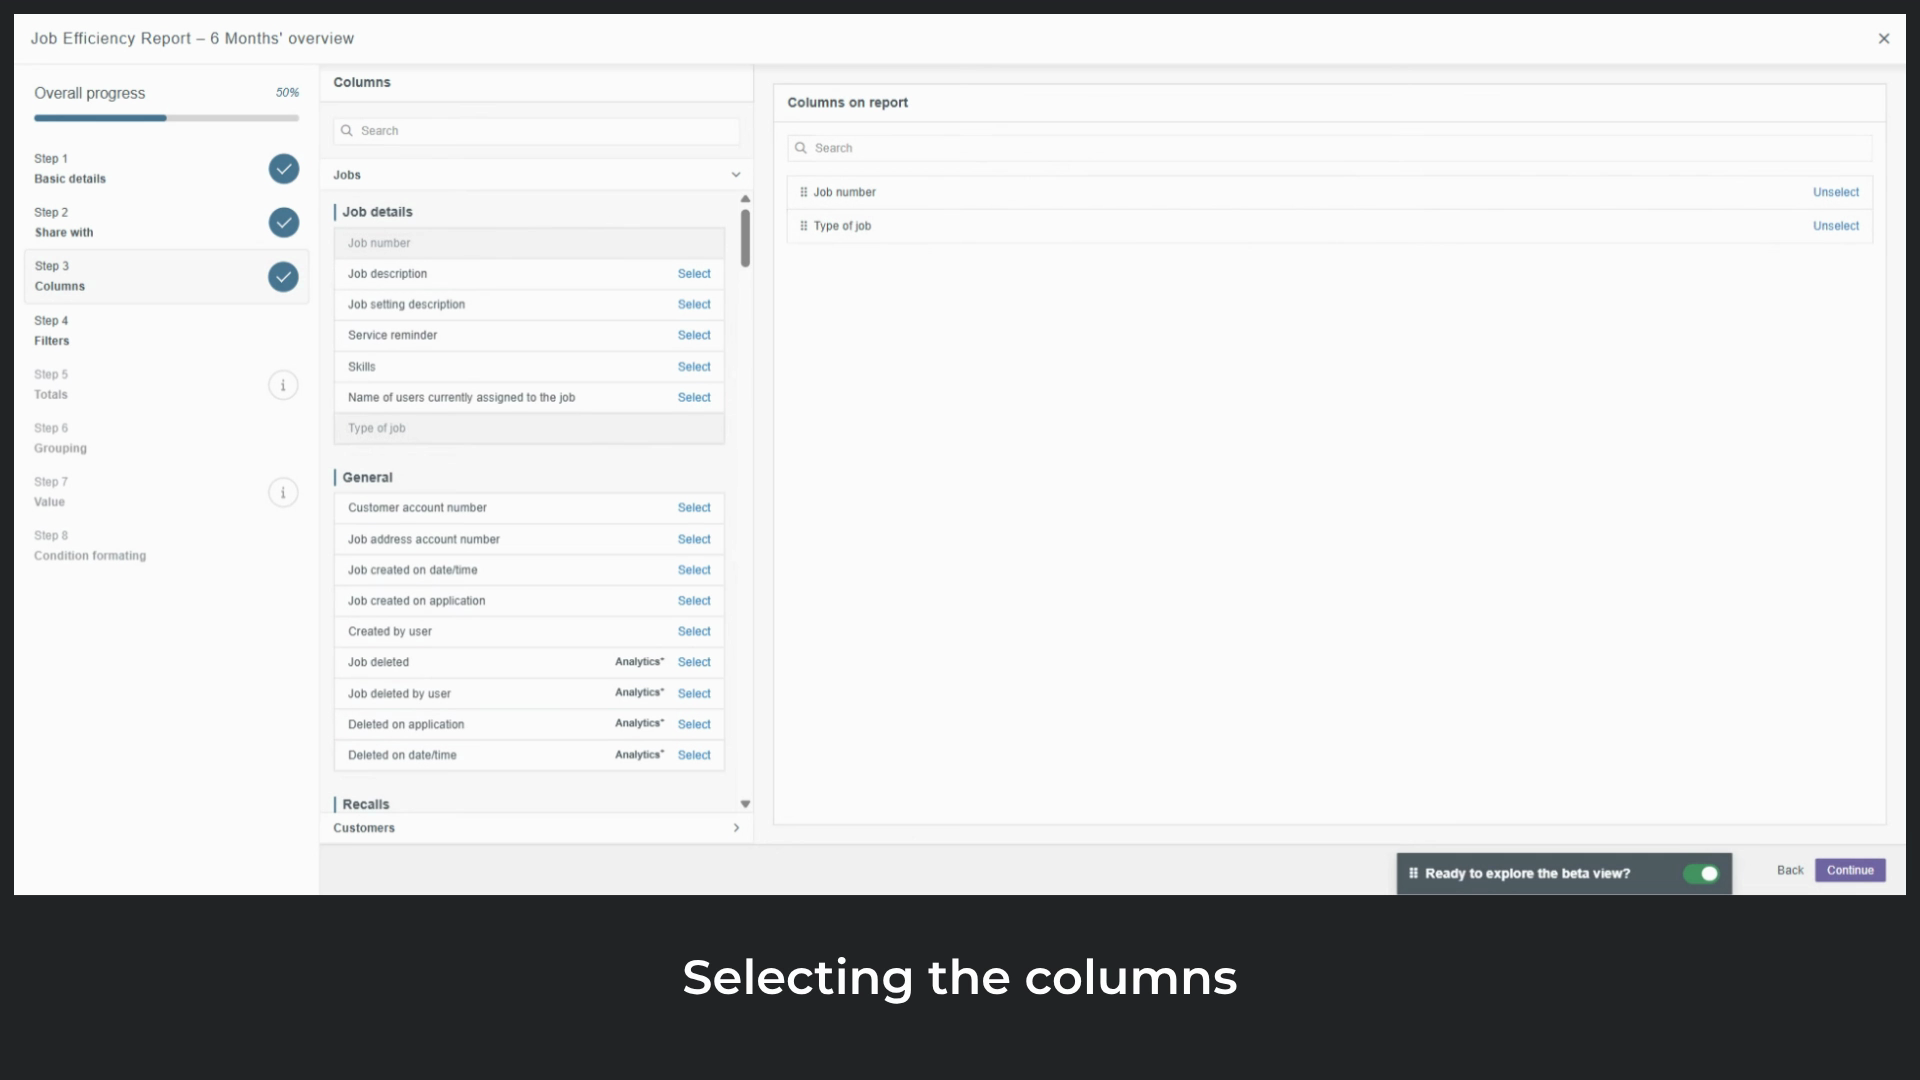
name of users currently assigned to the job to compare performance across team members. Include
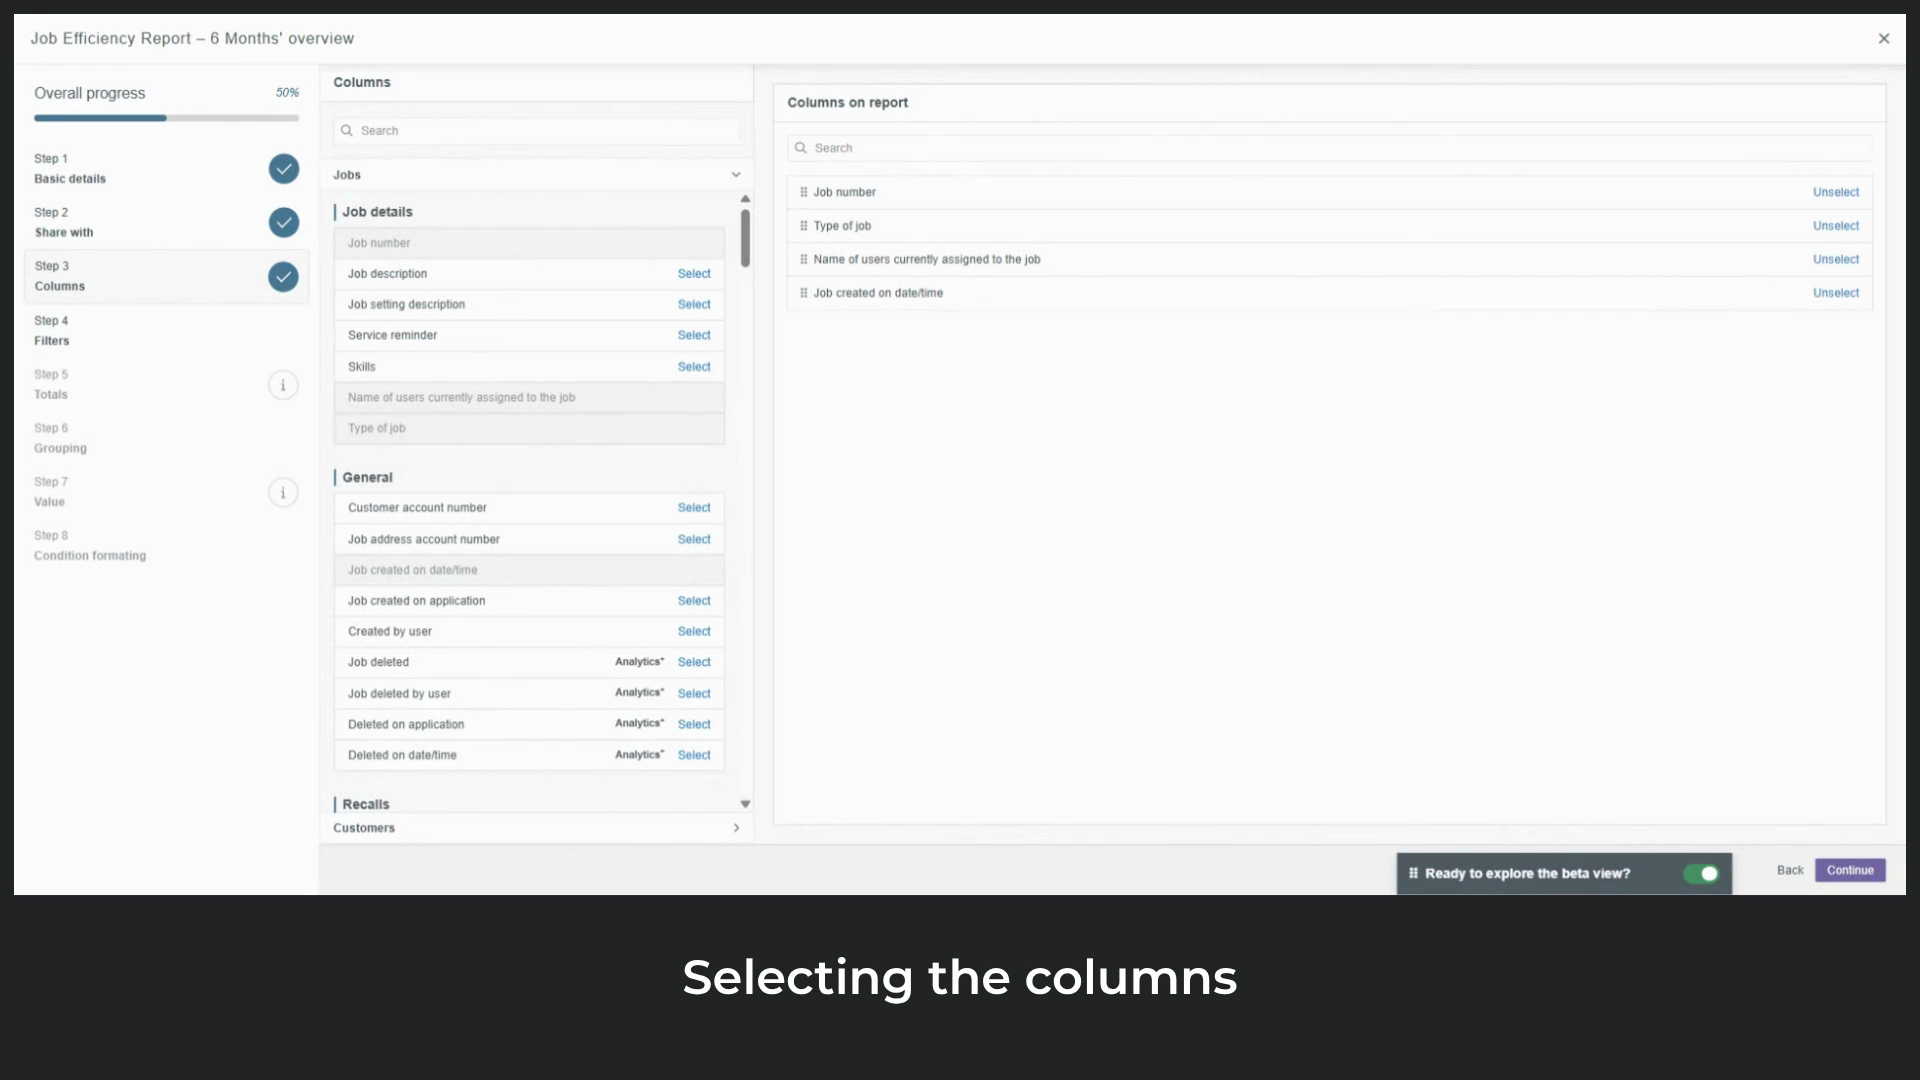
job created on date and time to track when each job was raised, and
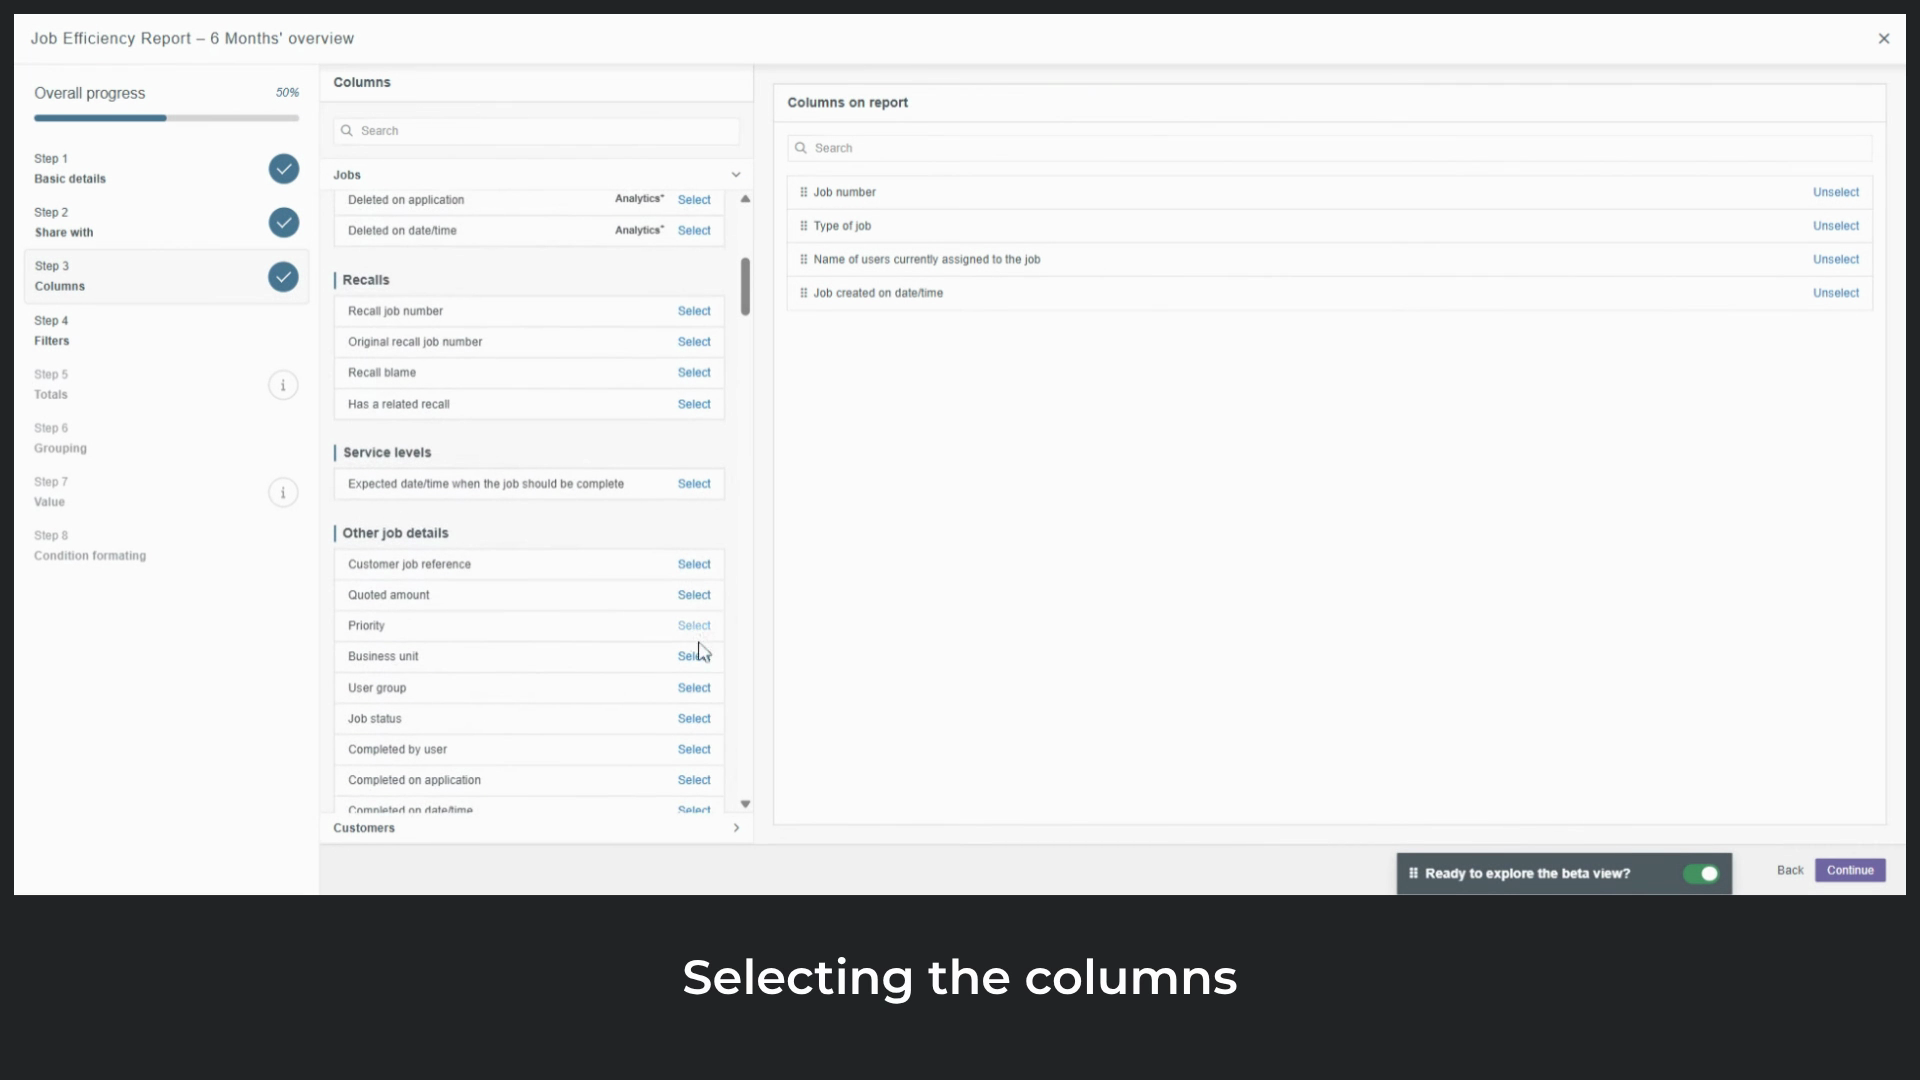
business unit to see which part of the business the work belongs to. Then
add time from job created to completion. This is a key
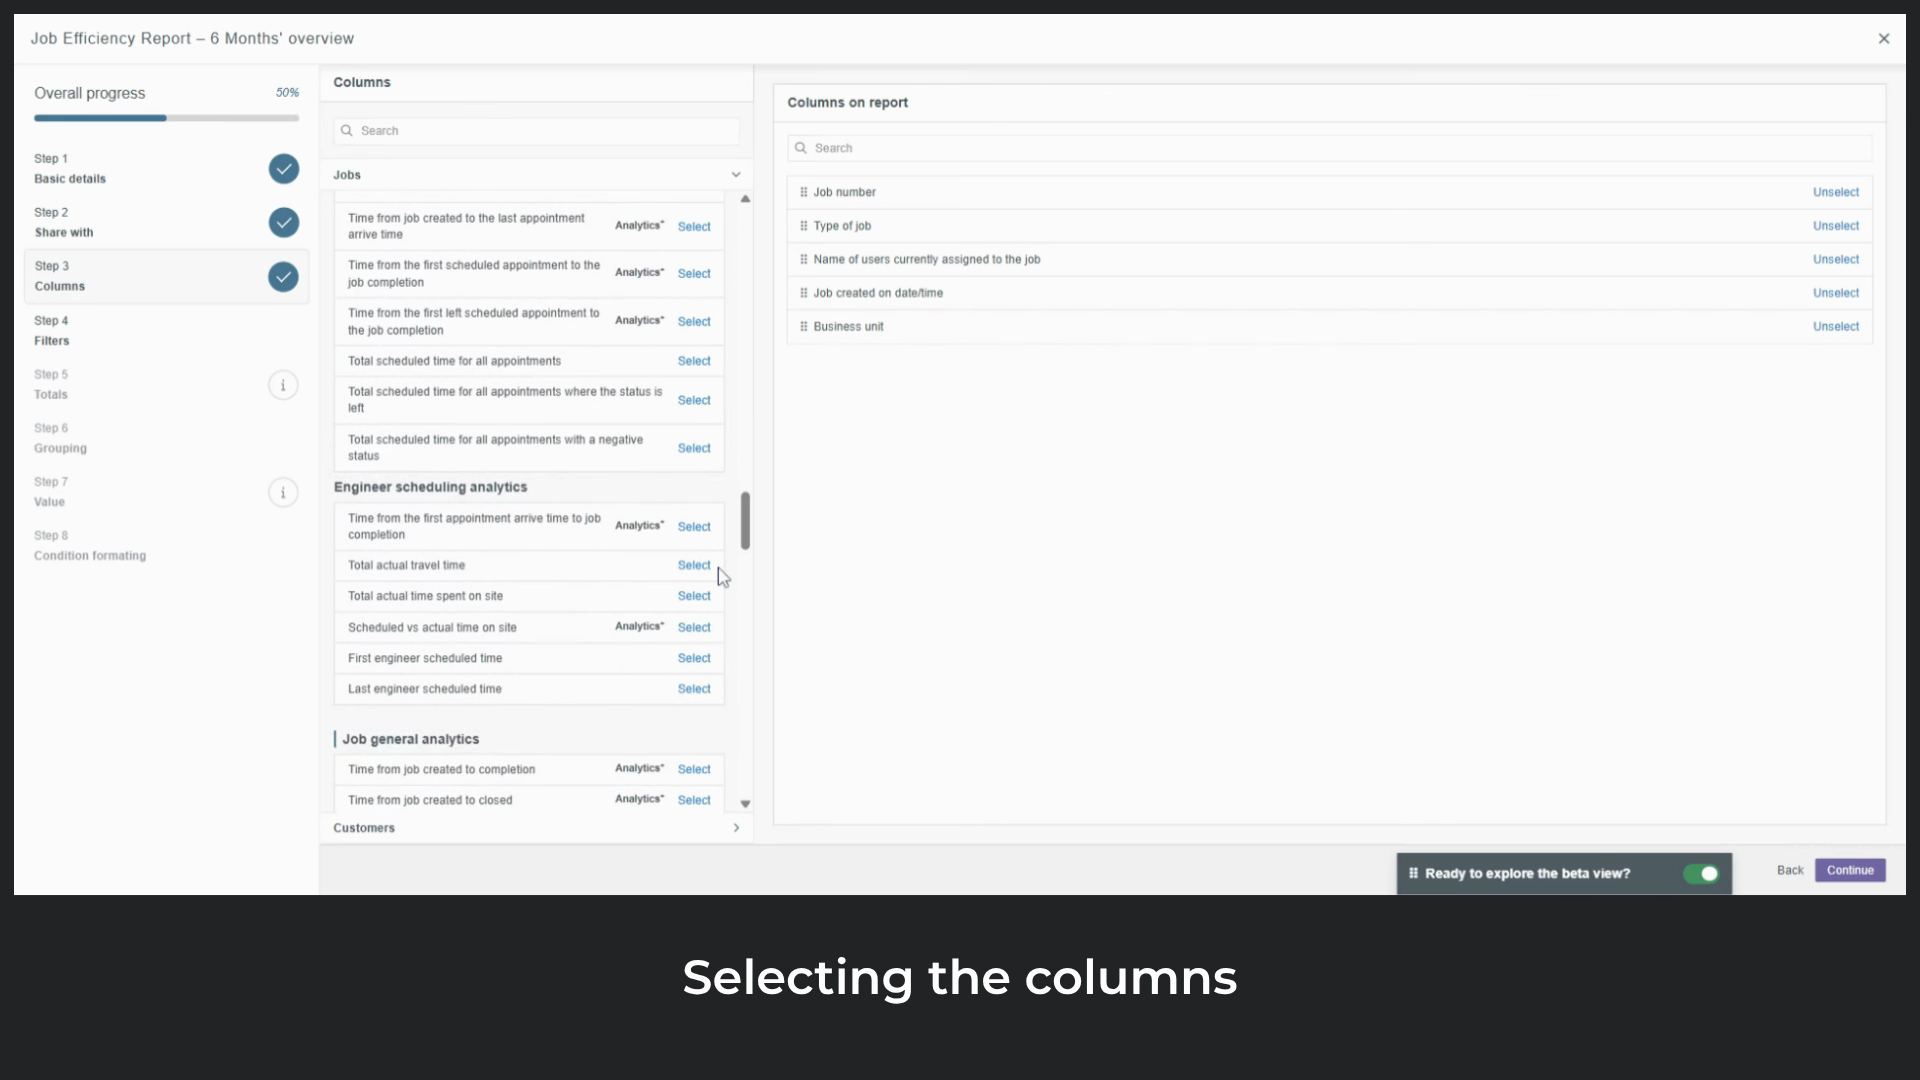
column as it is great for evaluating productivity, estimating future job length, and checking alignment with costs or SLAs.
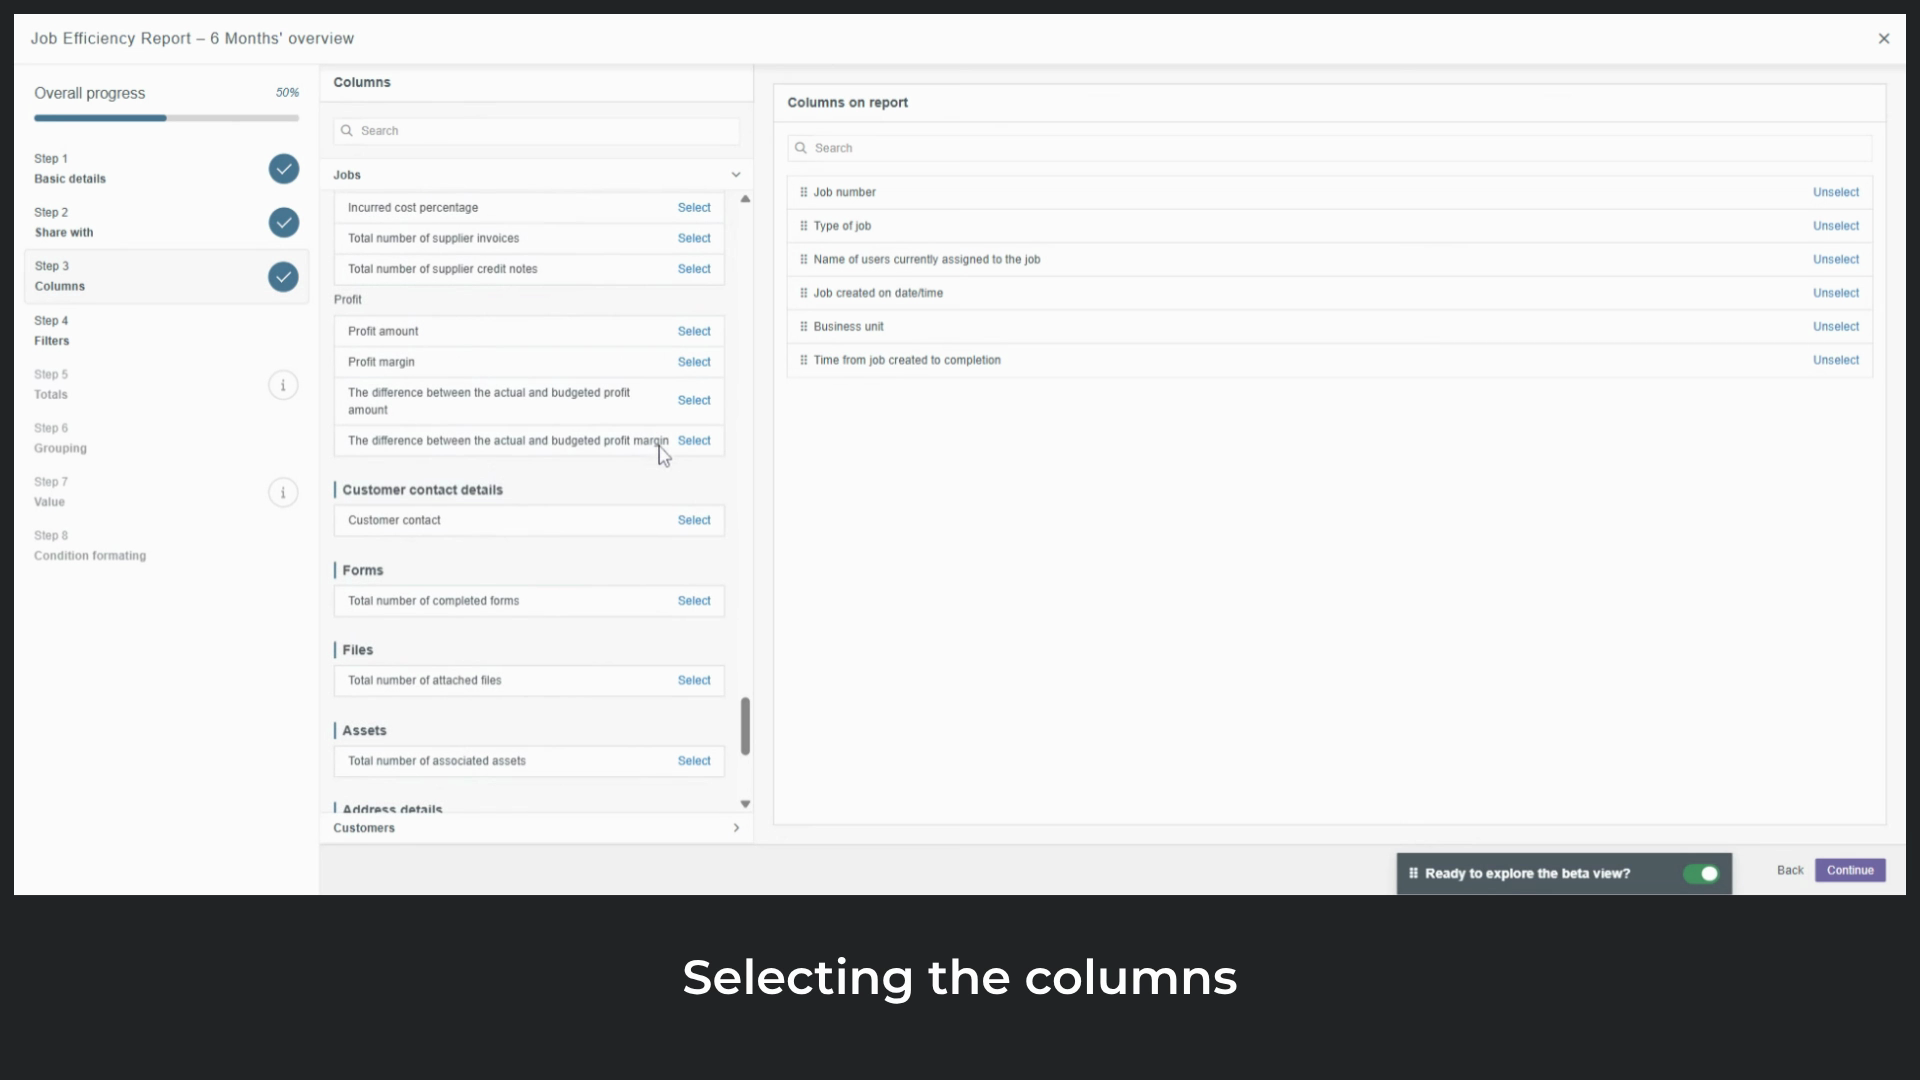
Two more columns worth highlighting. The first is
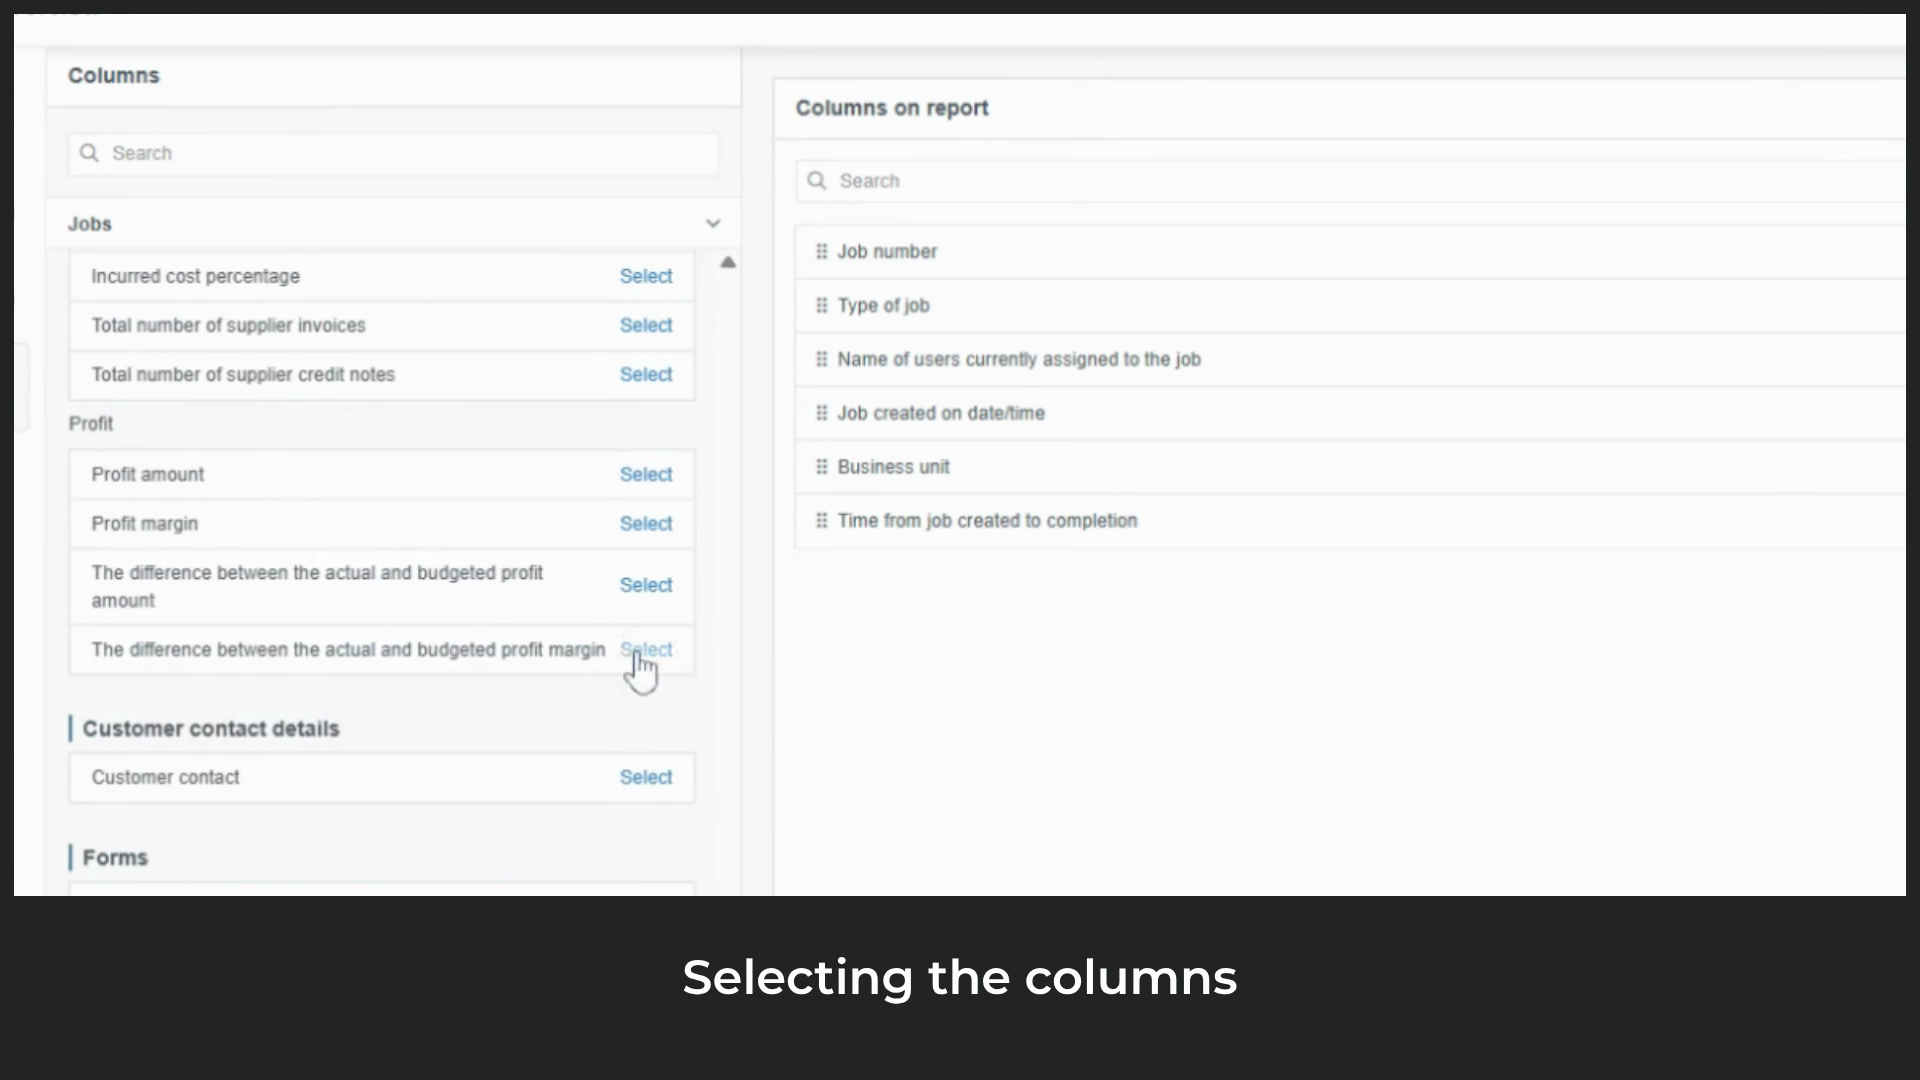
difference between actual and budgeted profit margin, which shows how much the actual profit margin varies from what was originally budgeted. A
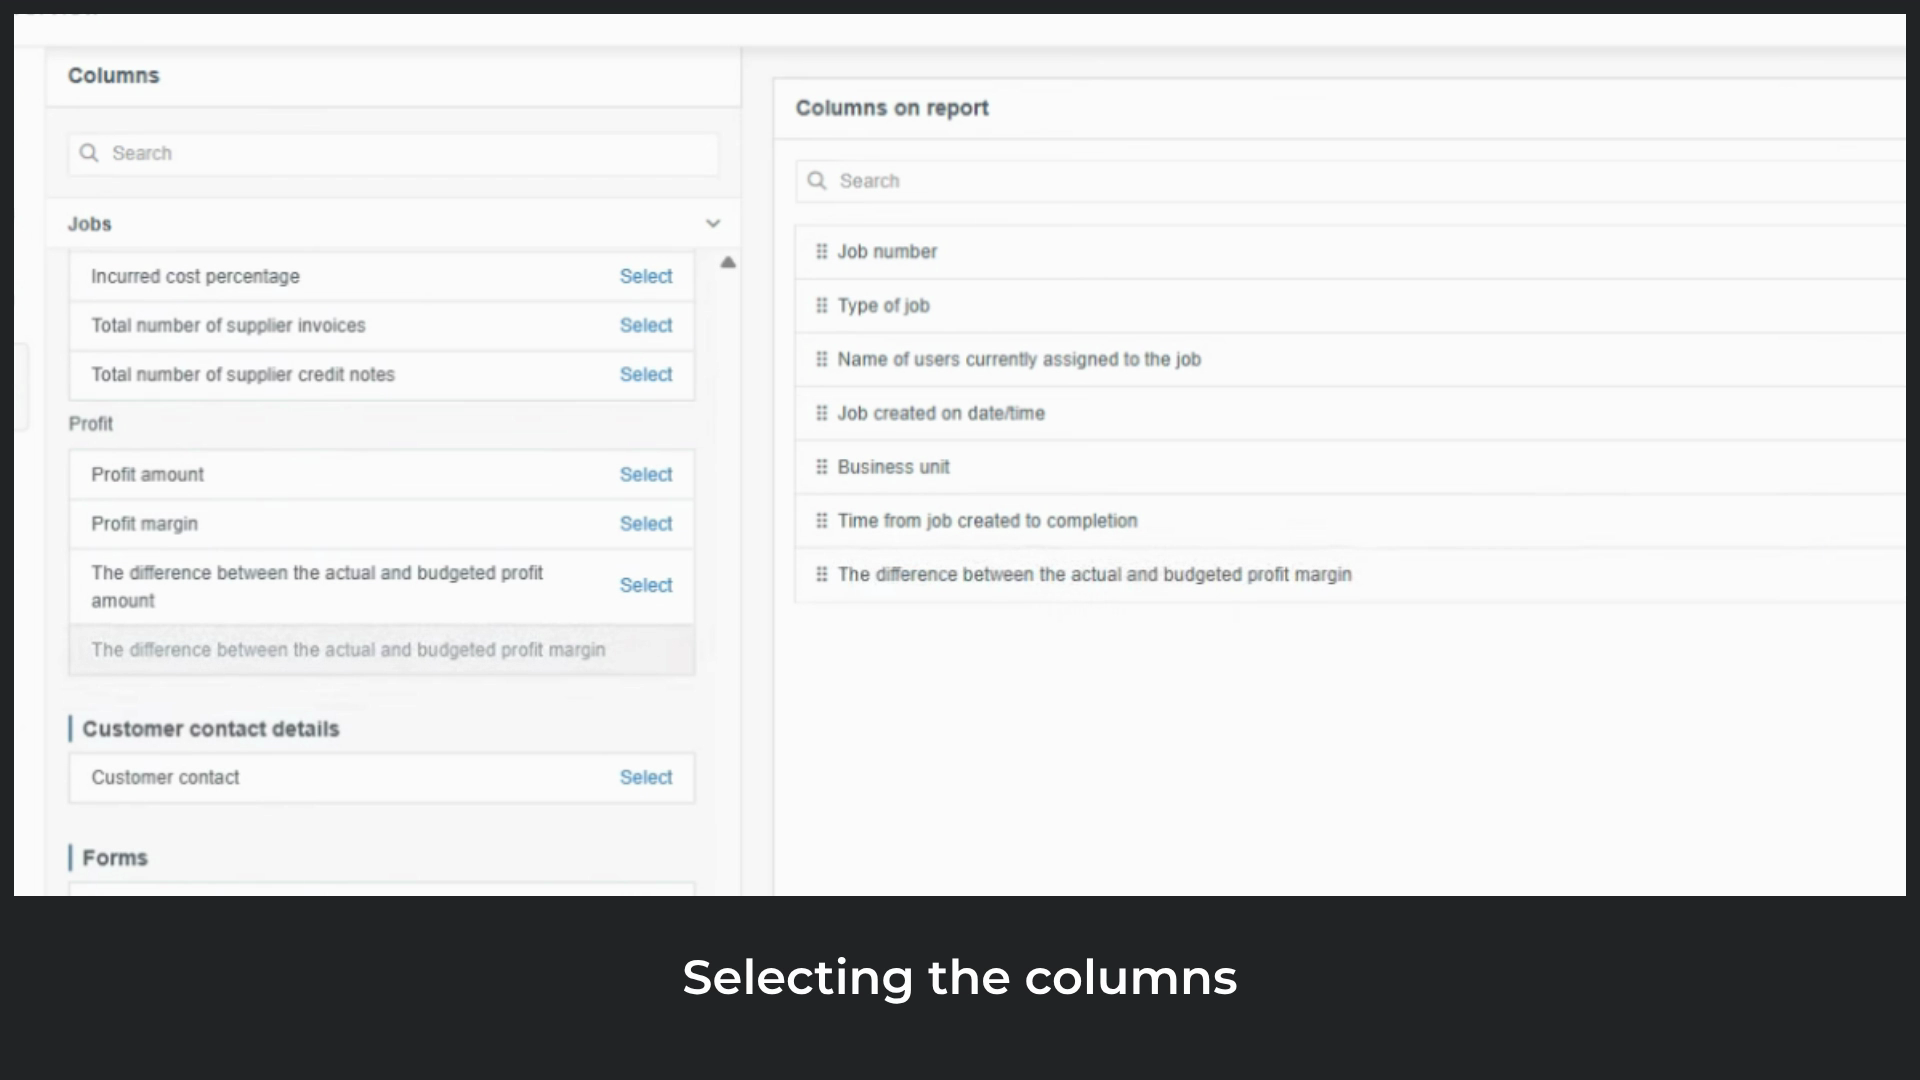
positive value means the job performed better than expected.
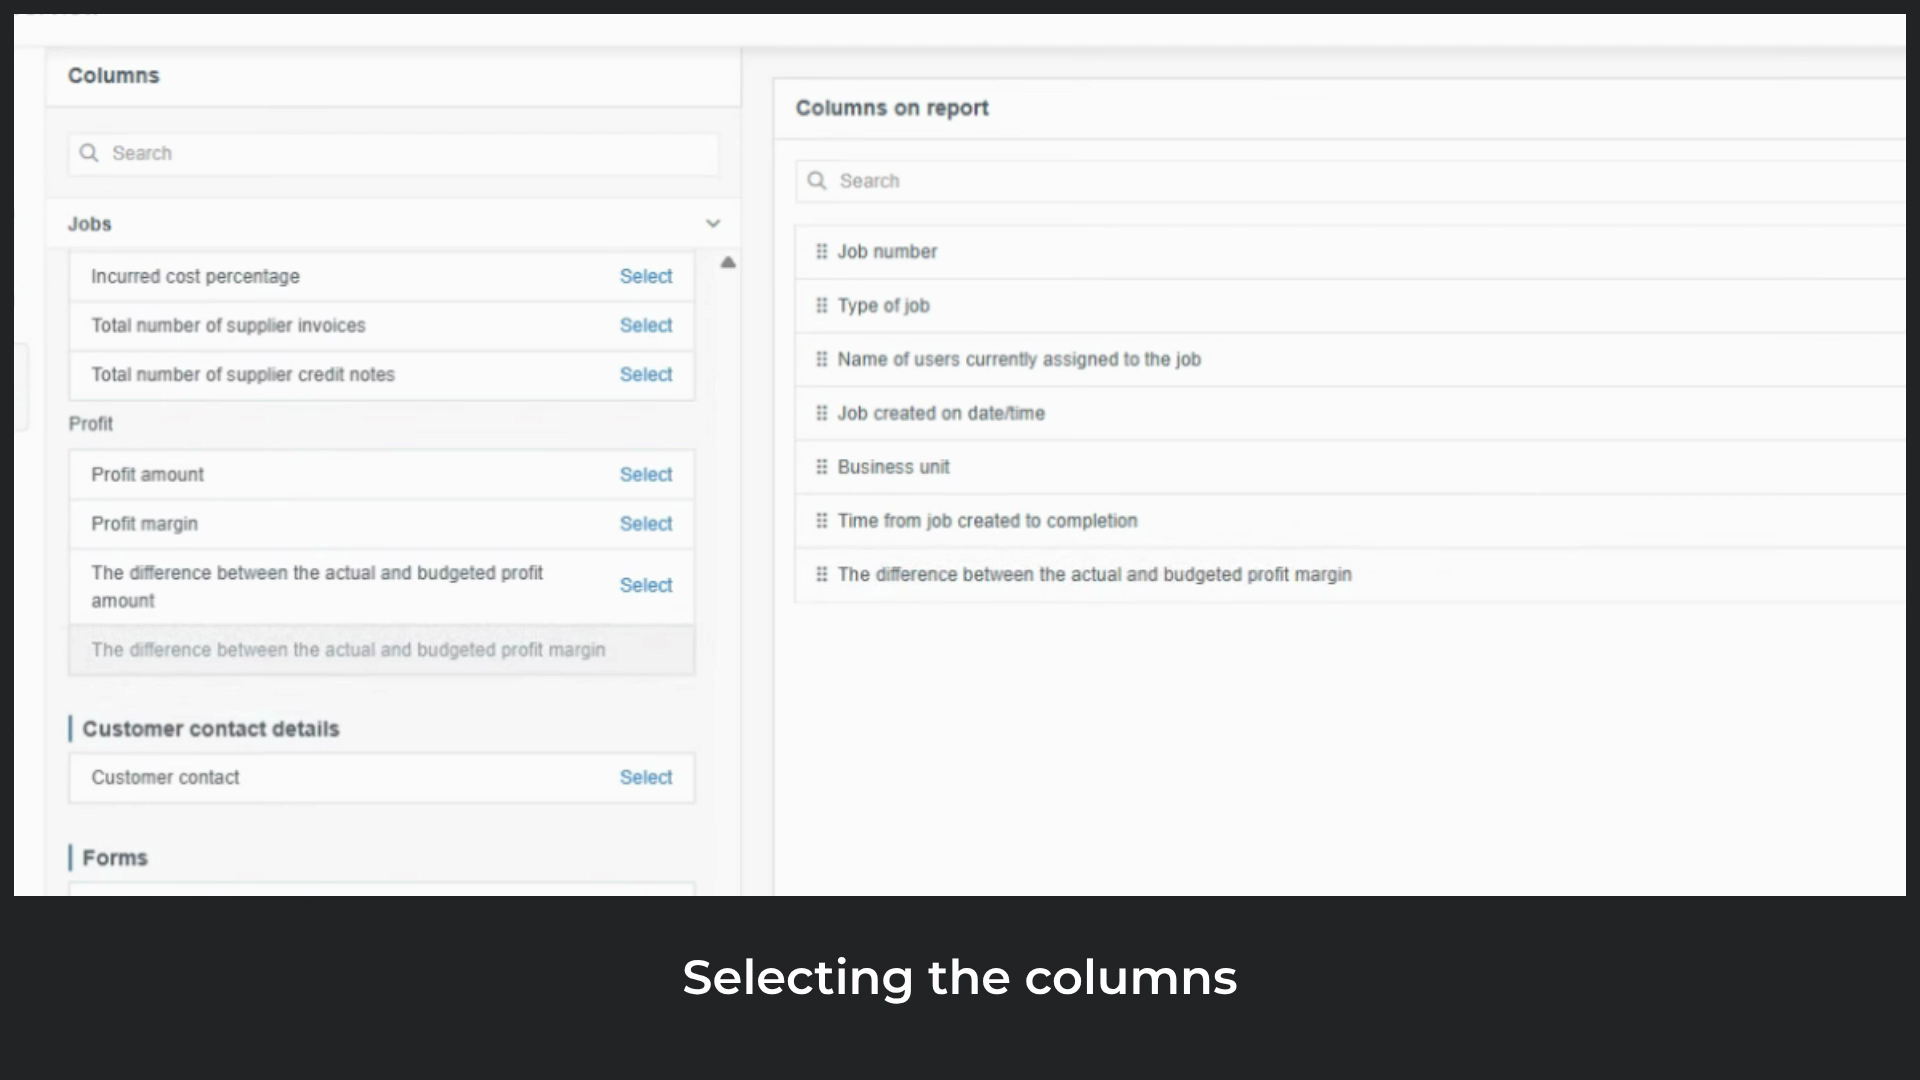
A negative value means it fell short. The
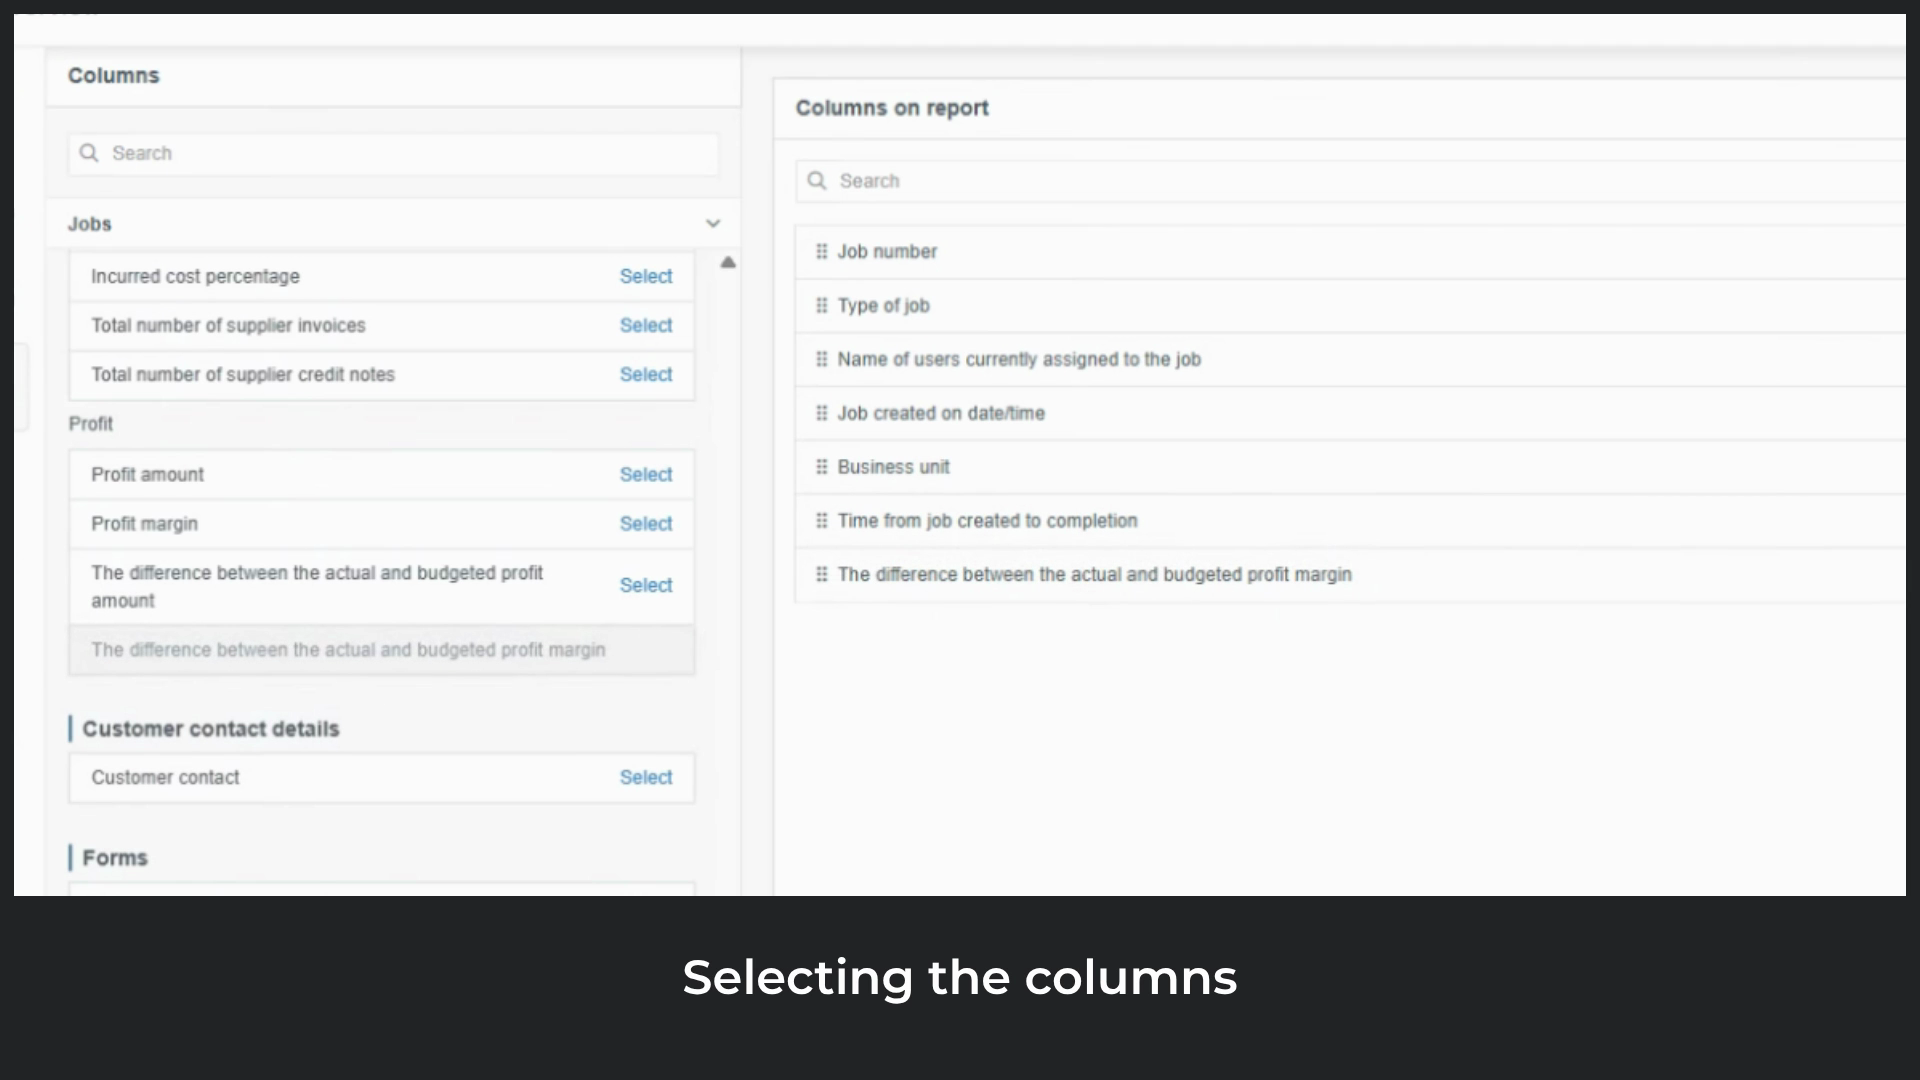
second is difference between actual and budgeted profit amount, which shows the same comparison in financial terms.
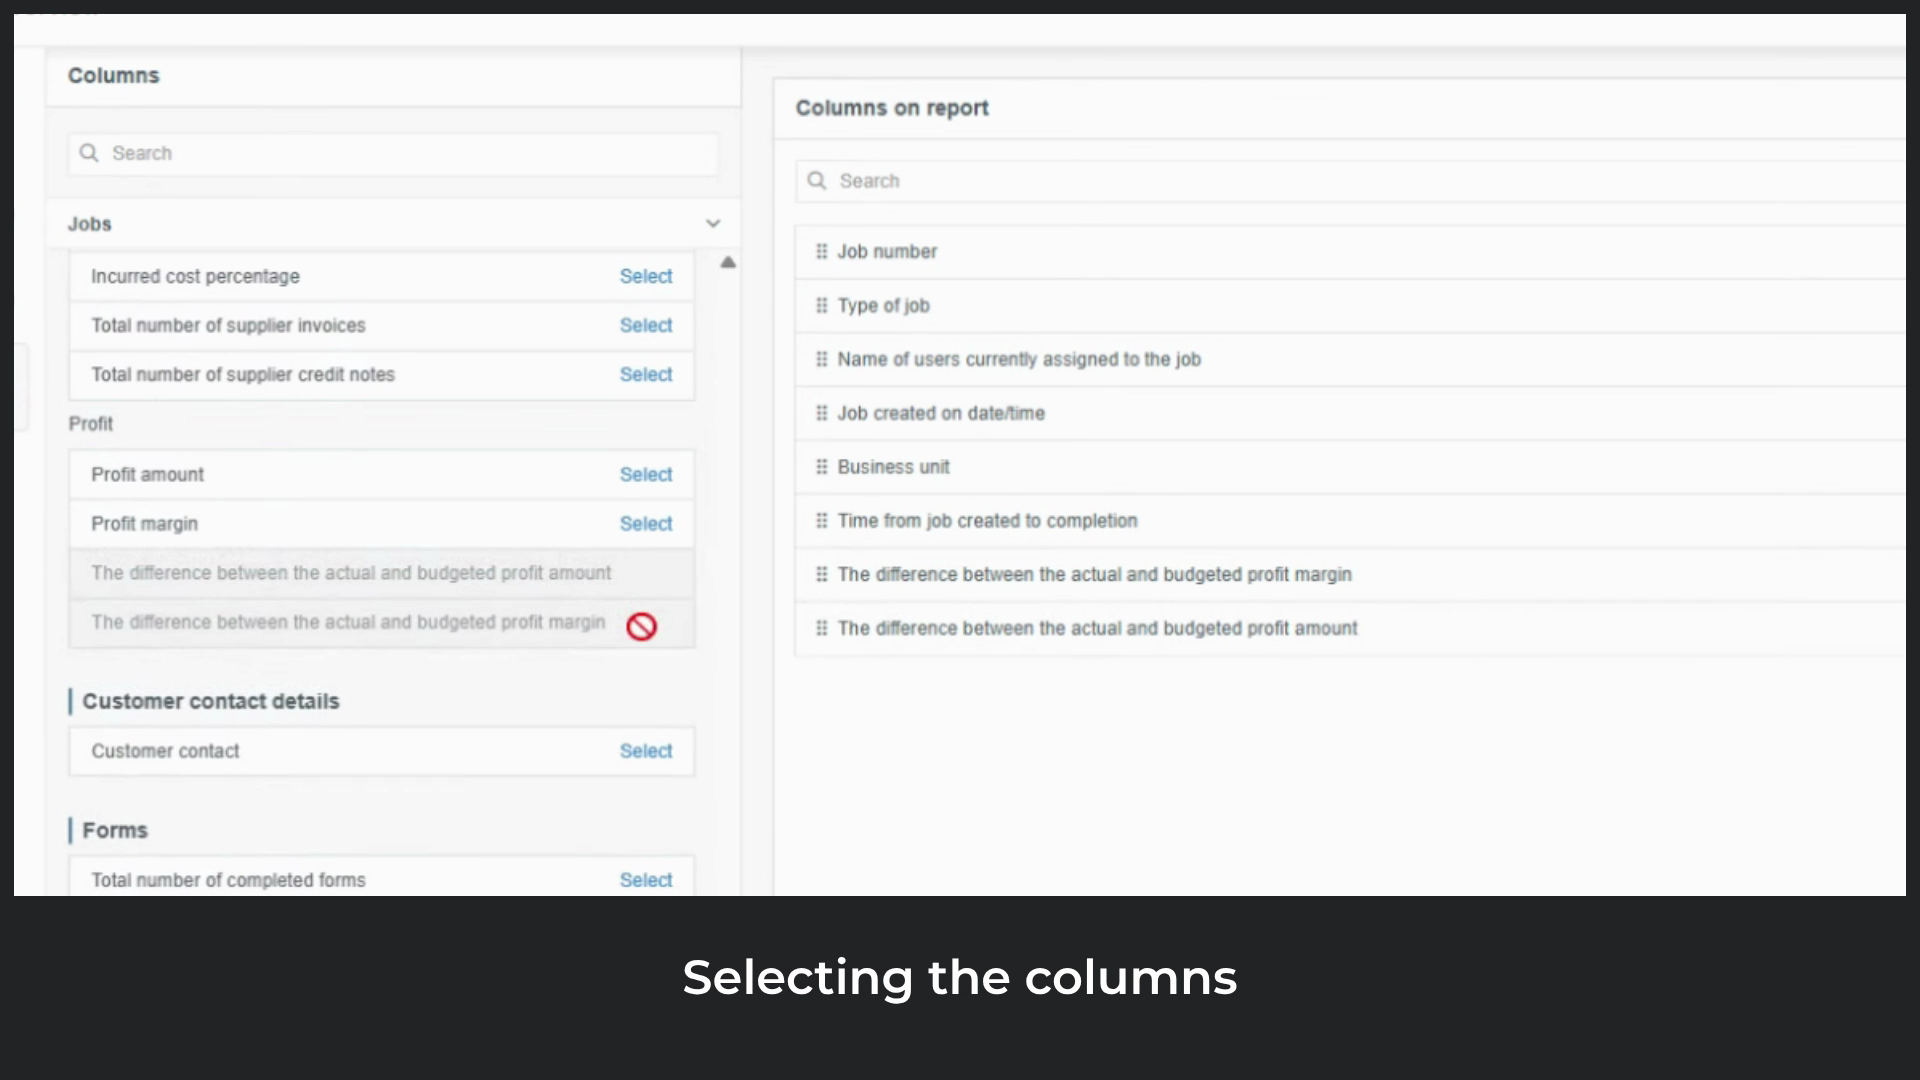
These columns together provide the full picture what the job is, who worked on it, and how long it took from start to finish.
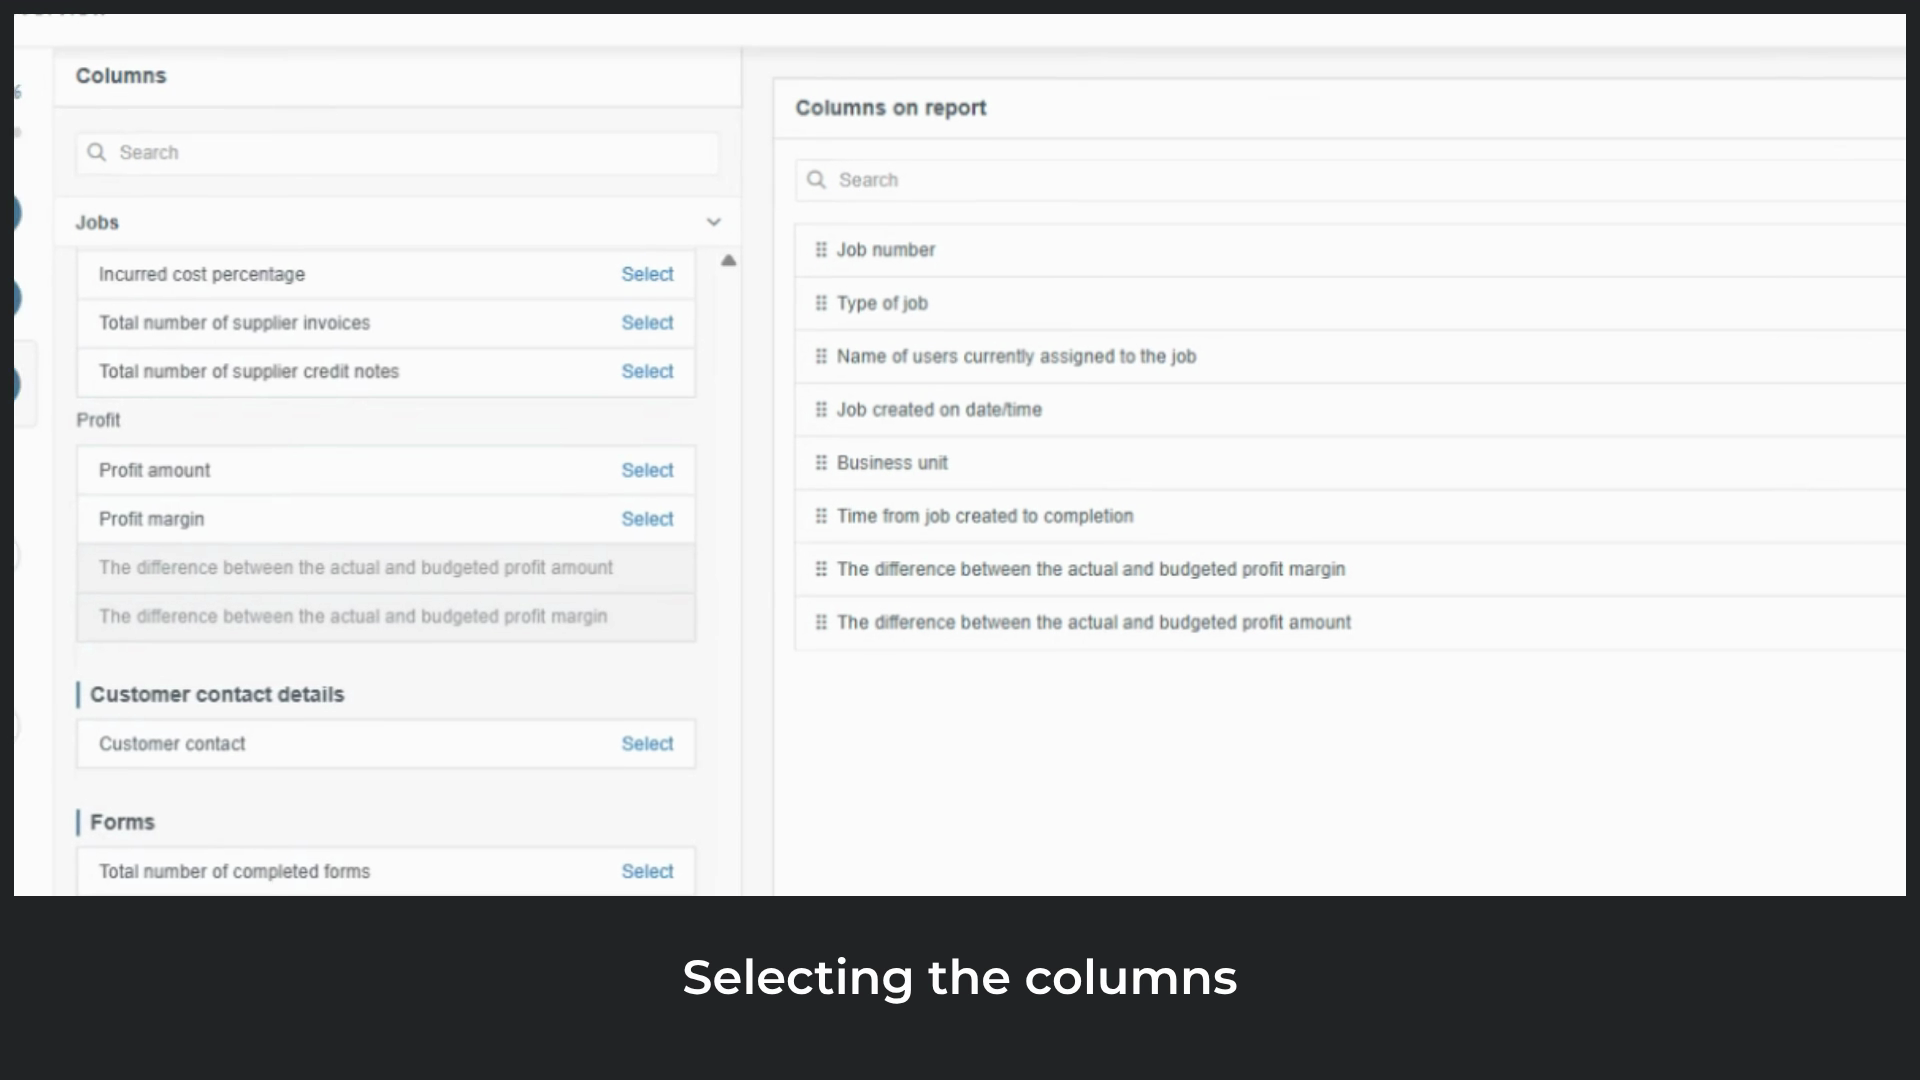
Any additional columns can be added. If a column is no longer needed, simply
unselect it. Use the
search bar to find specific columns quickly. The order of the
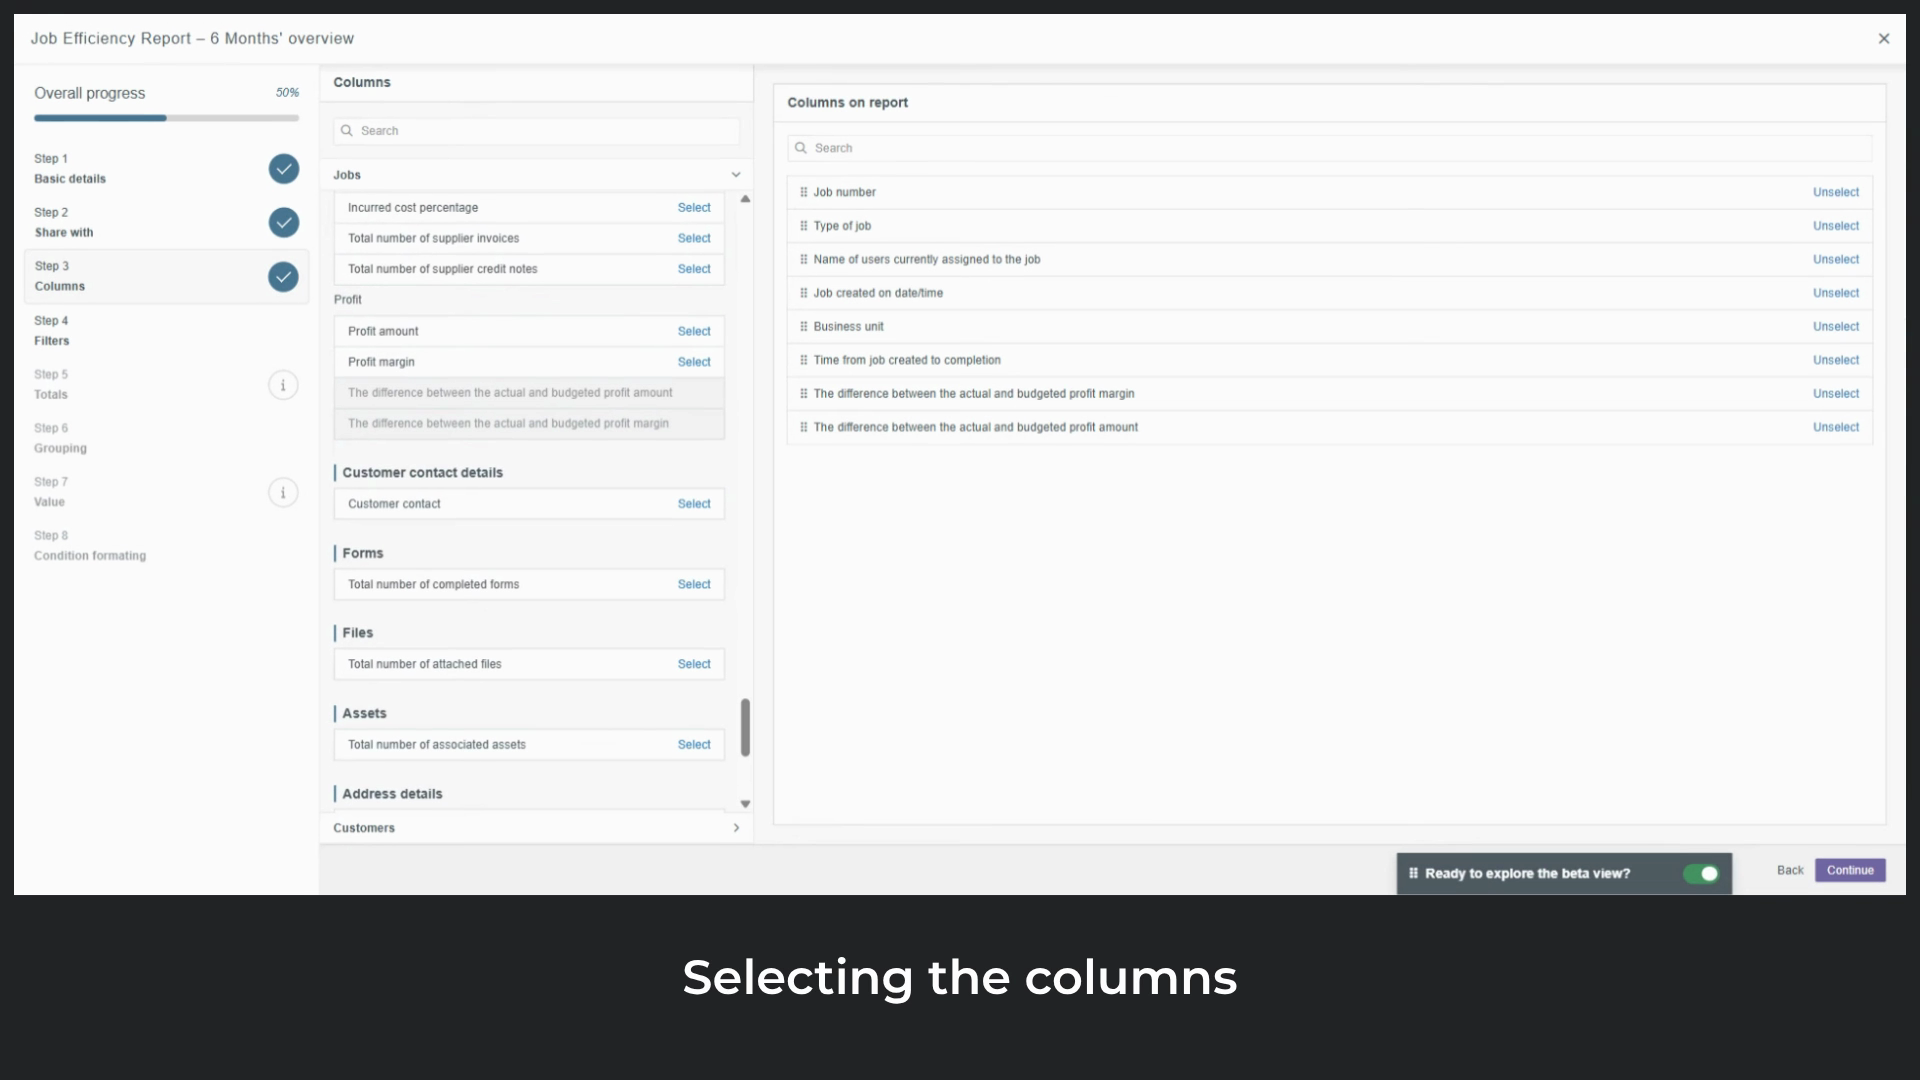
columns can be rearranged at any time by dragging and dropping them. We're now ready to move on.
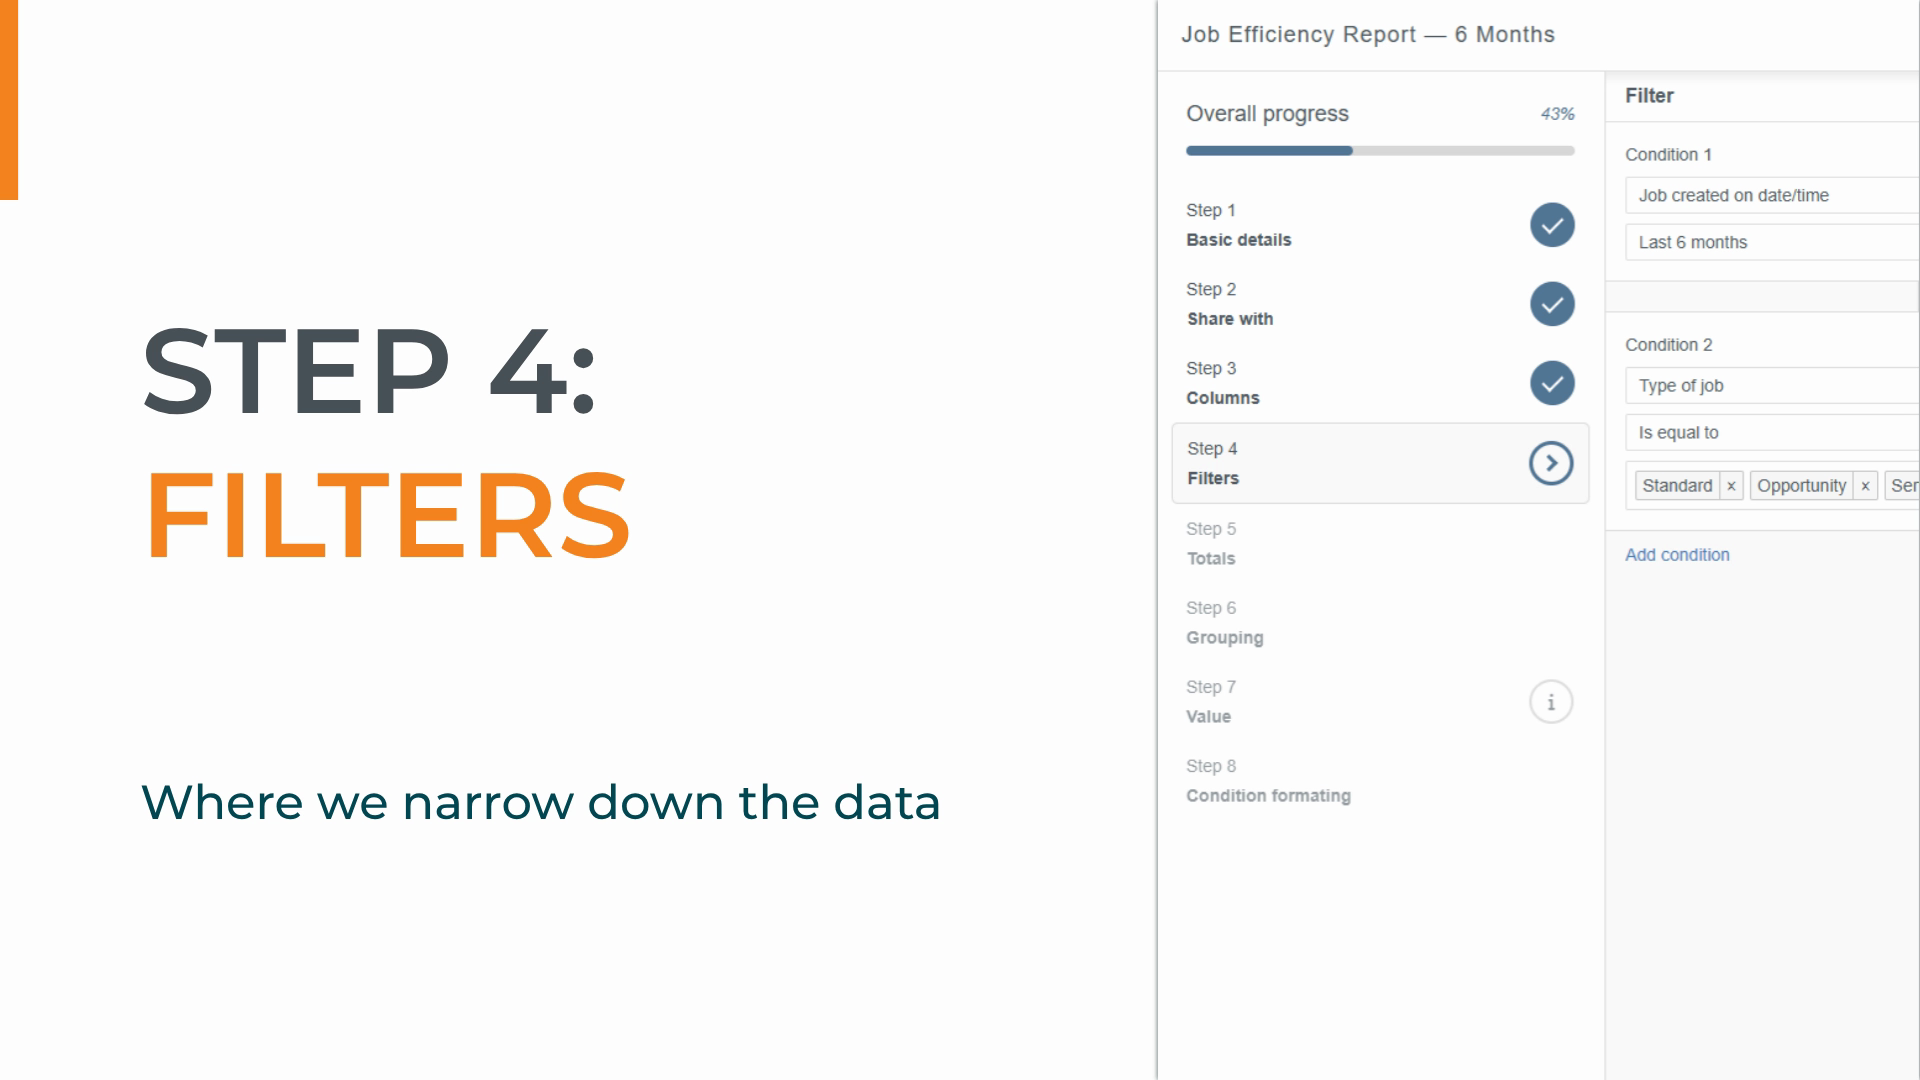
Step four is filters. This is where we
narrow down the data so the report only shows what's relevant. Without filters,
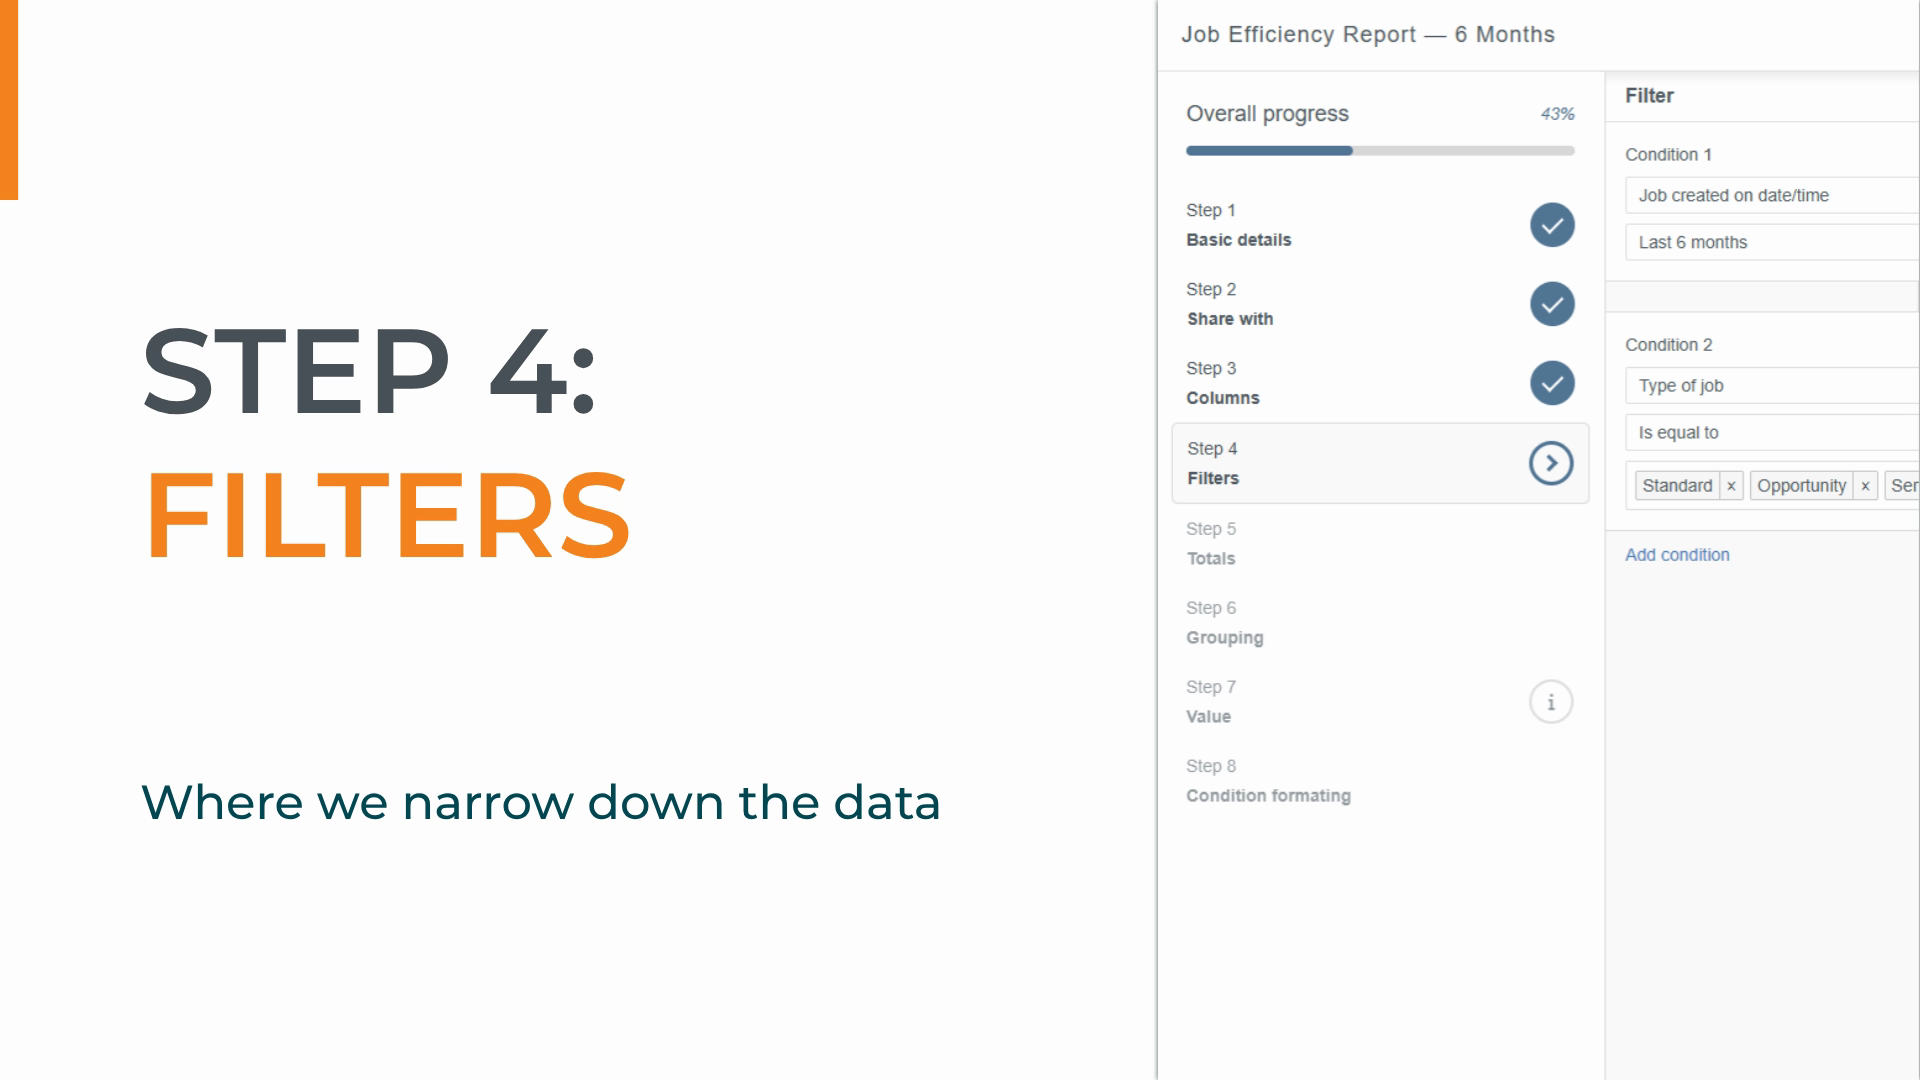
we'd be looking at every record in the system. We'll add
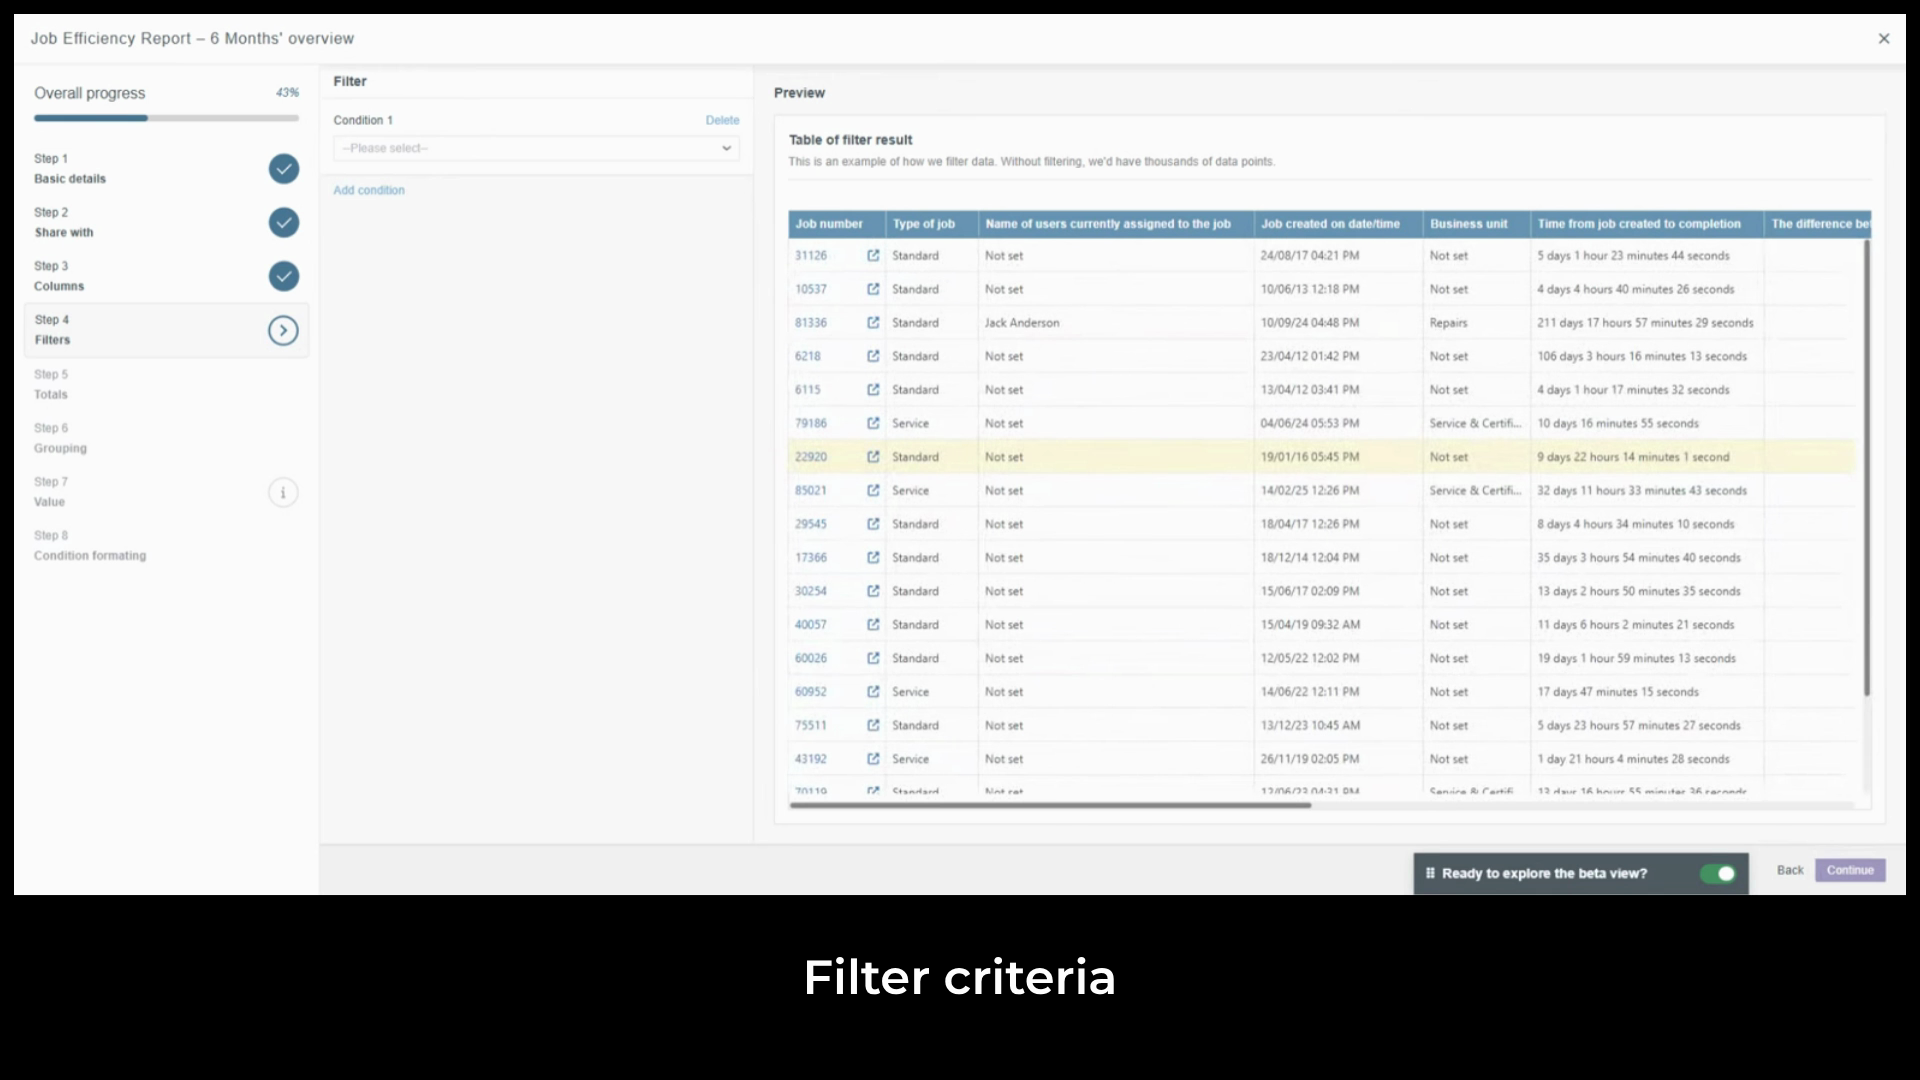
job created on date and time set to last six months and
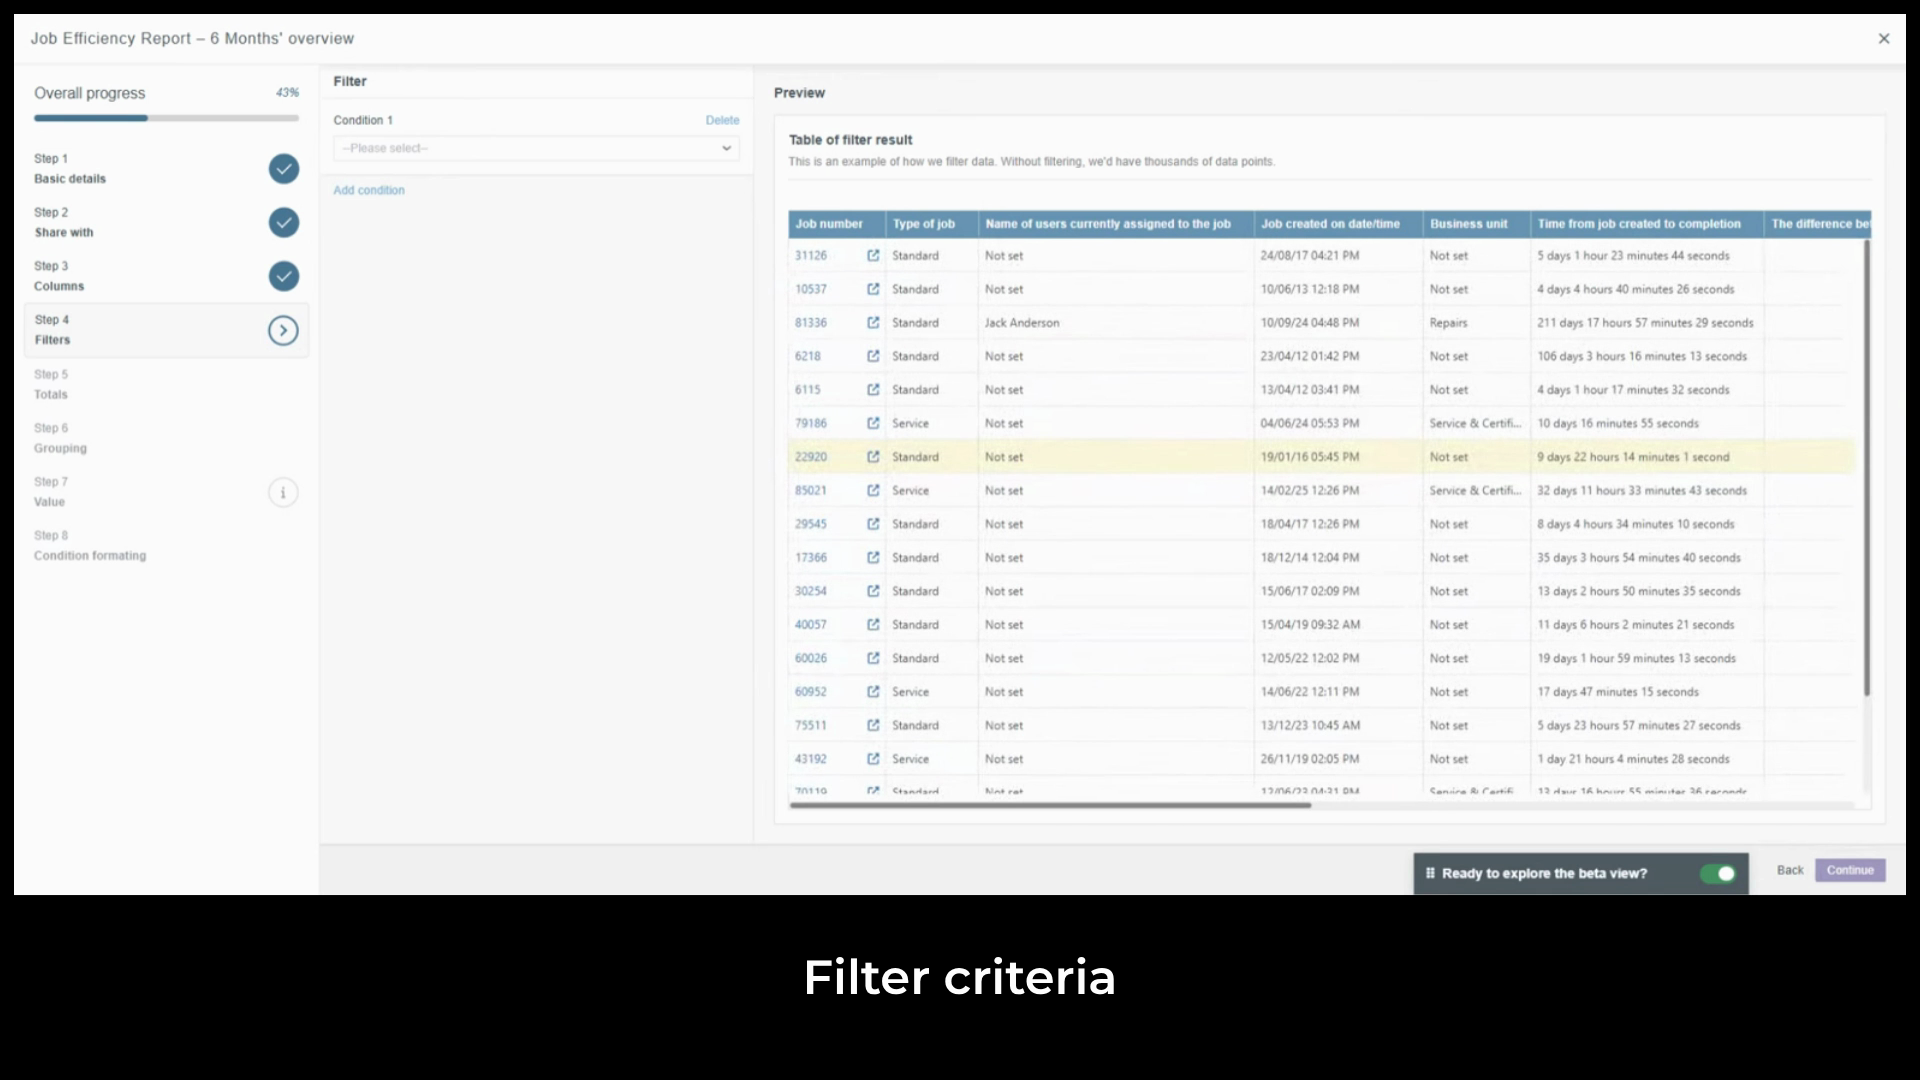
type of job set to Standard, Opportunity and Service. As you
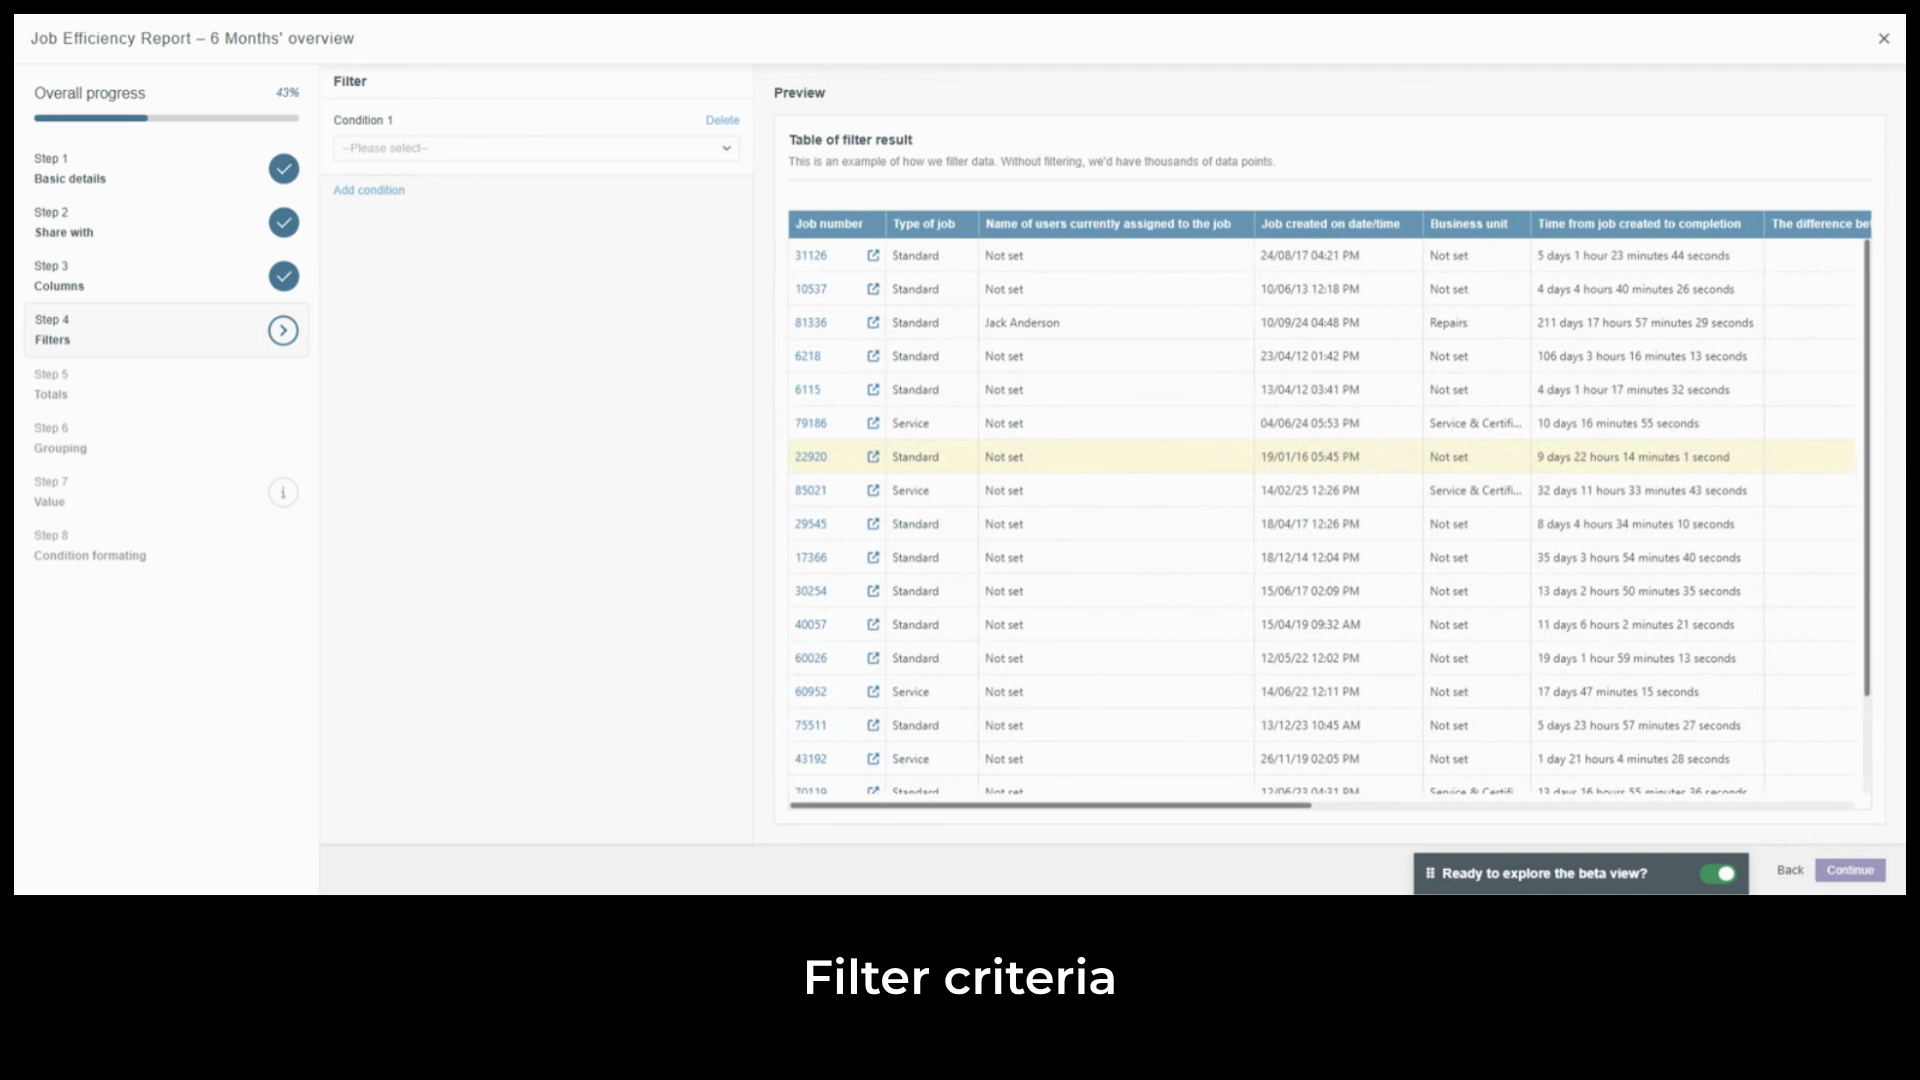
add conditions, the live preview updates to show the first
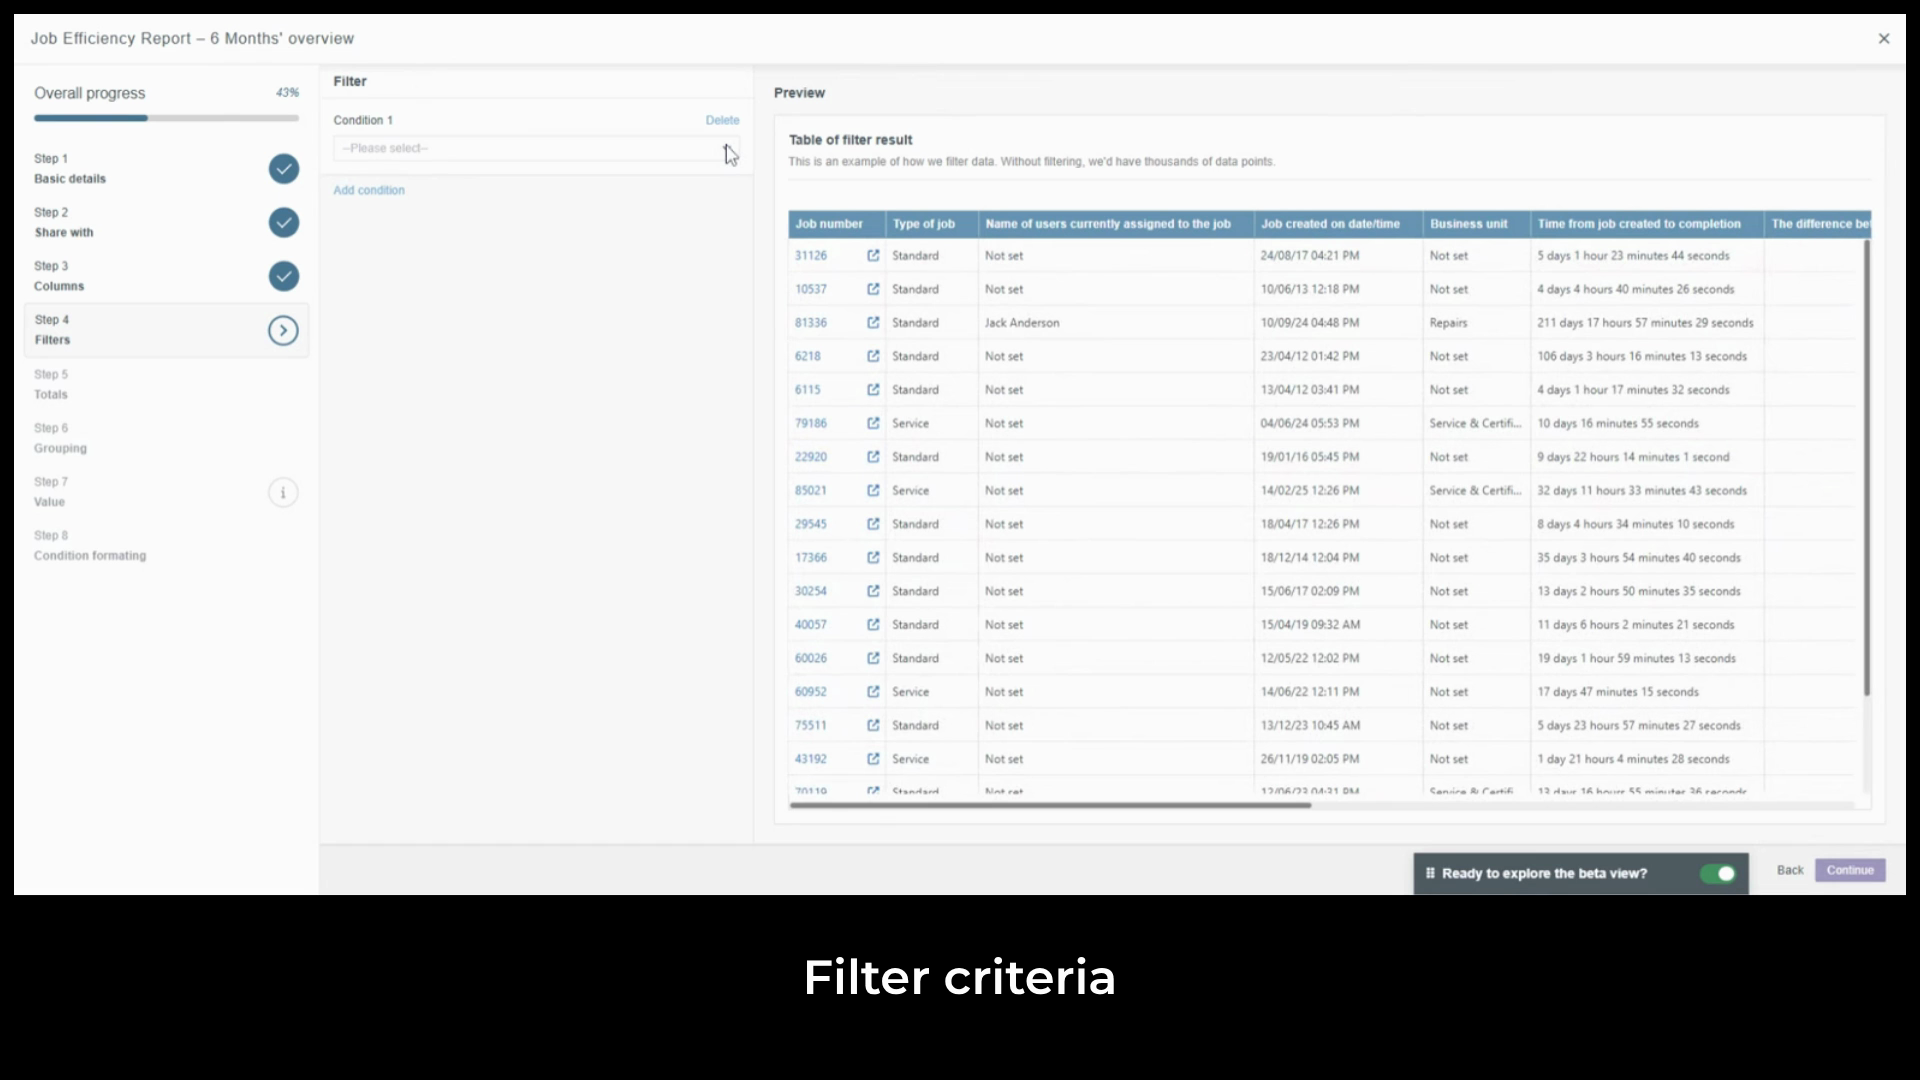
20 matching records confirming the report is behaving as expected. We can
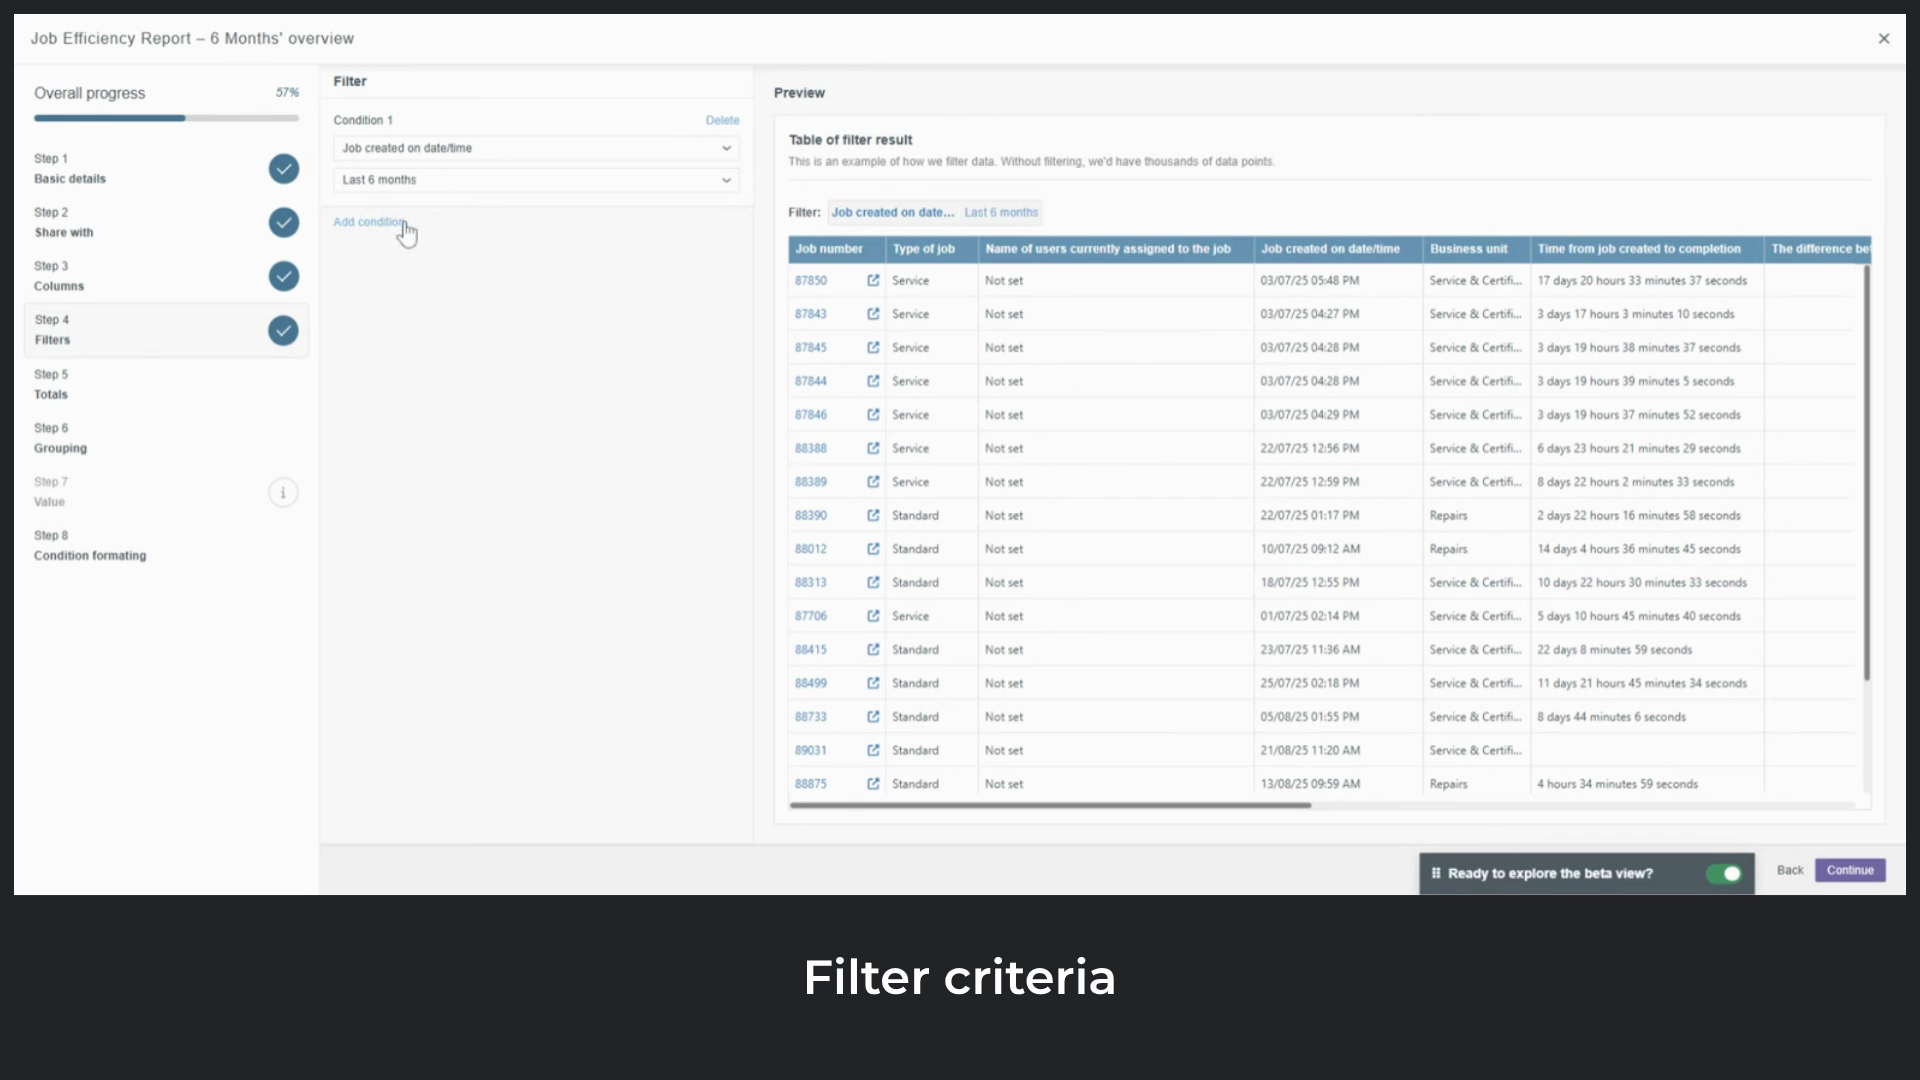
add more conditions to narrow the data further. For this report, we'll
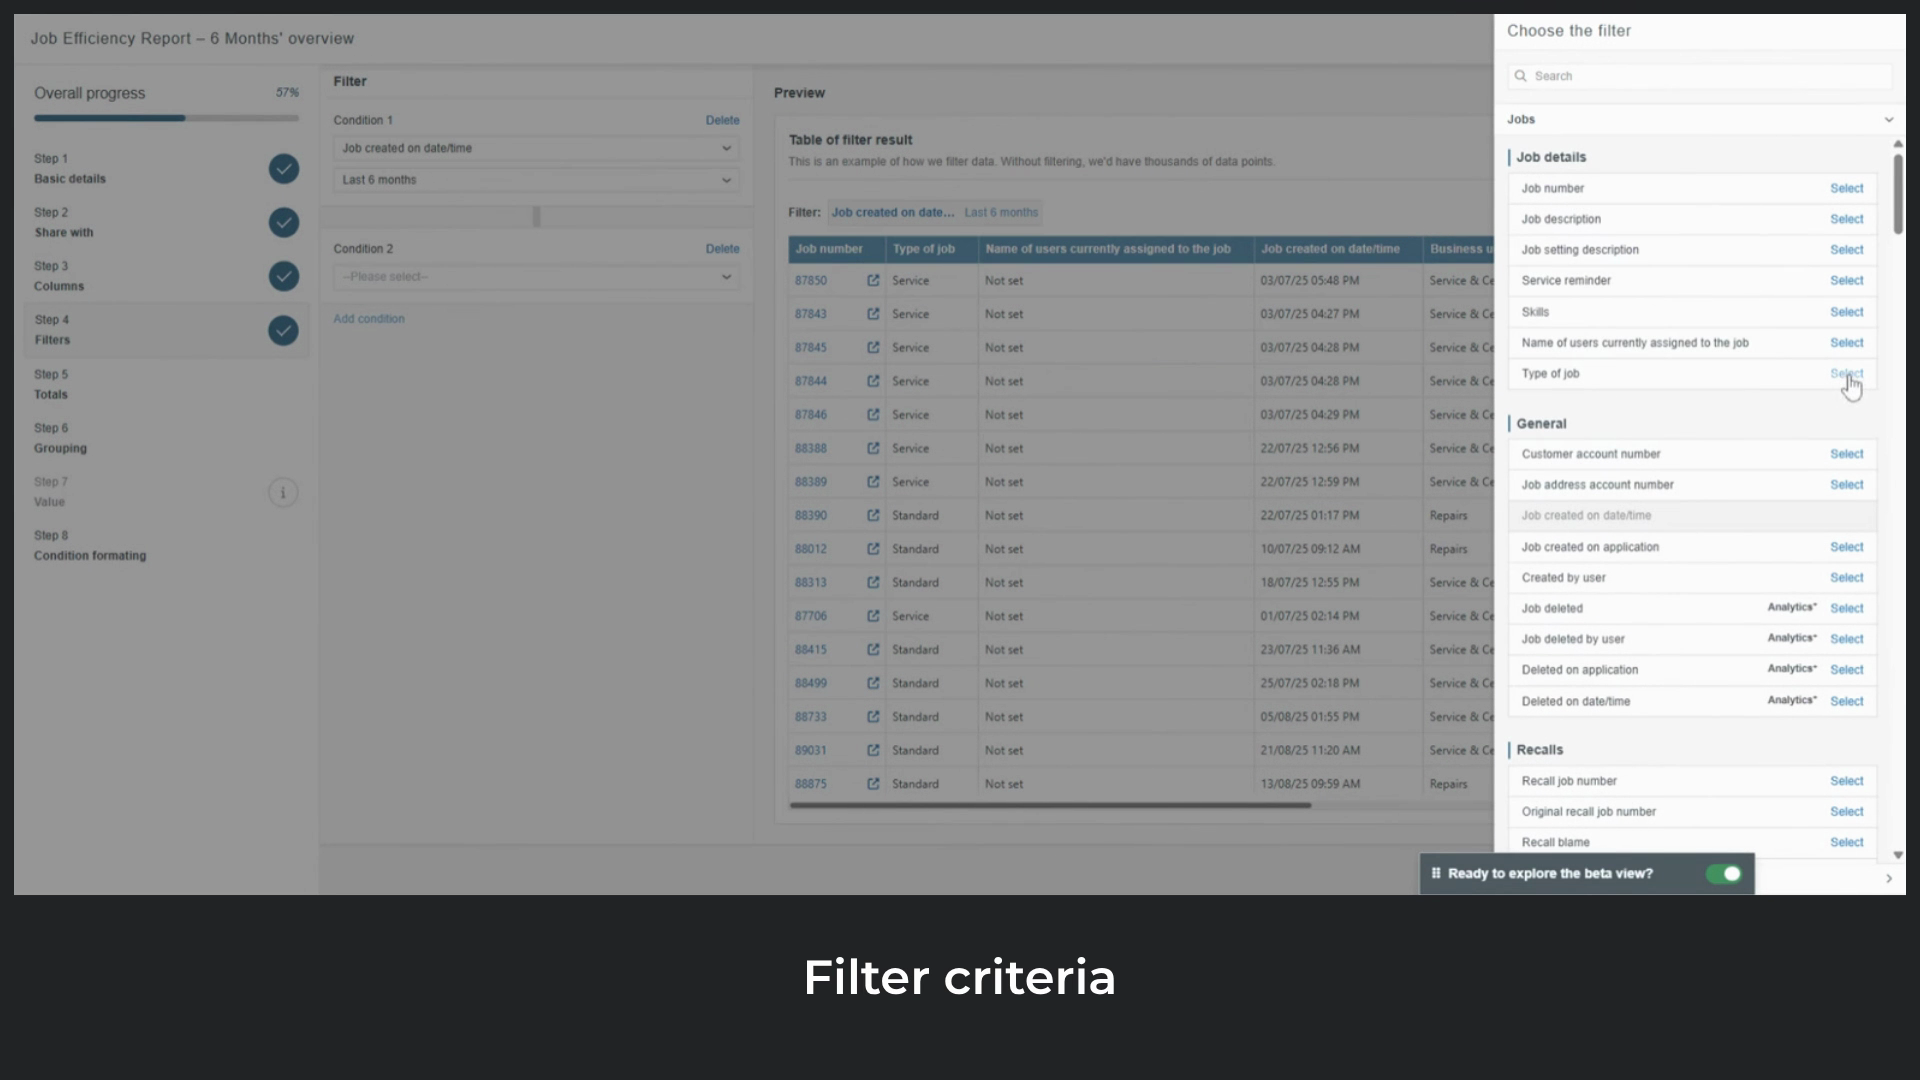
add a second condition for type of job. Set
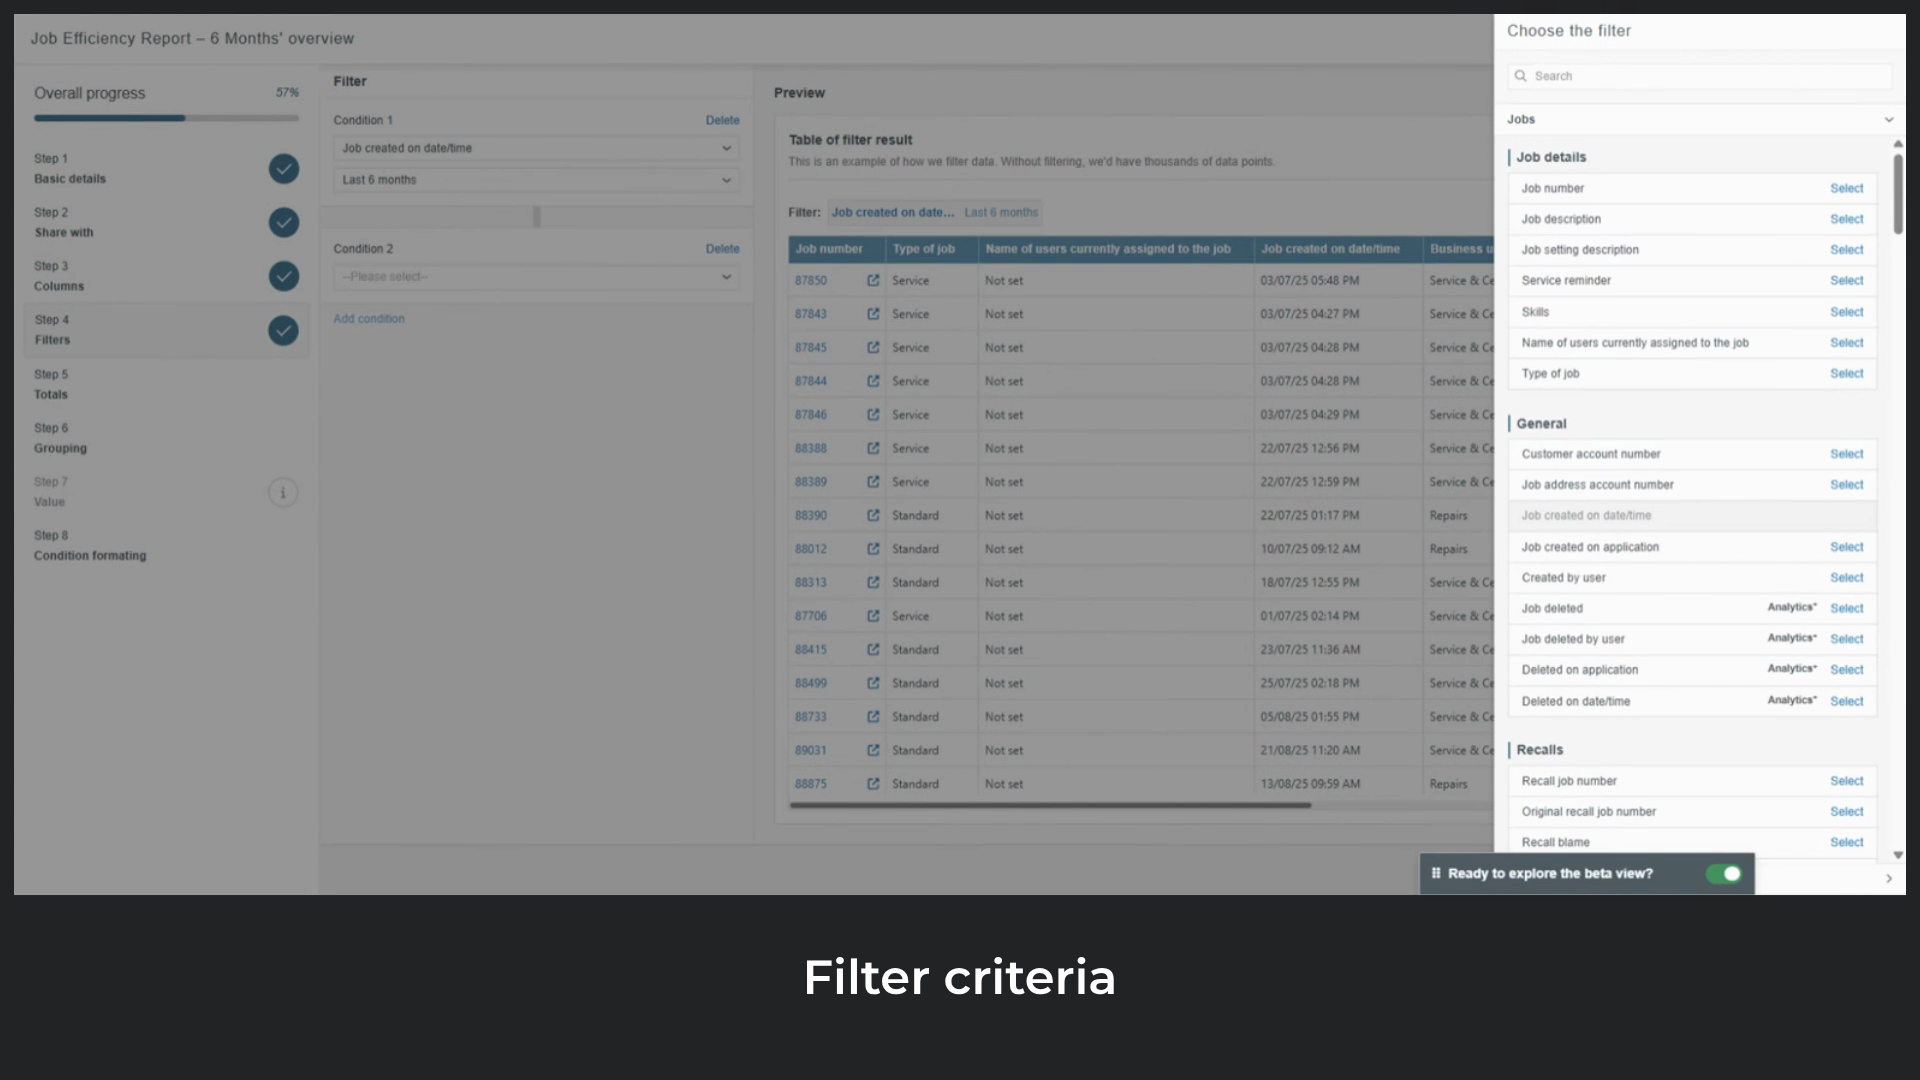
the operator to is equal to and select Standard, Opportunity and Service. You can
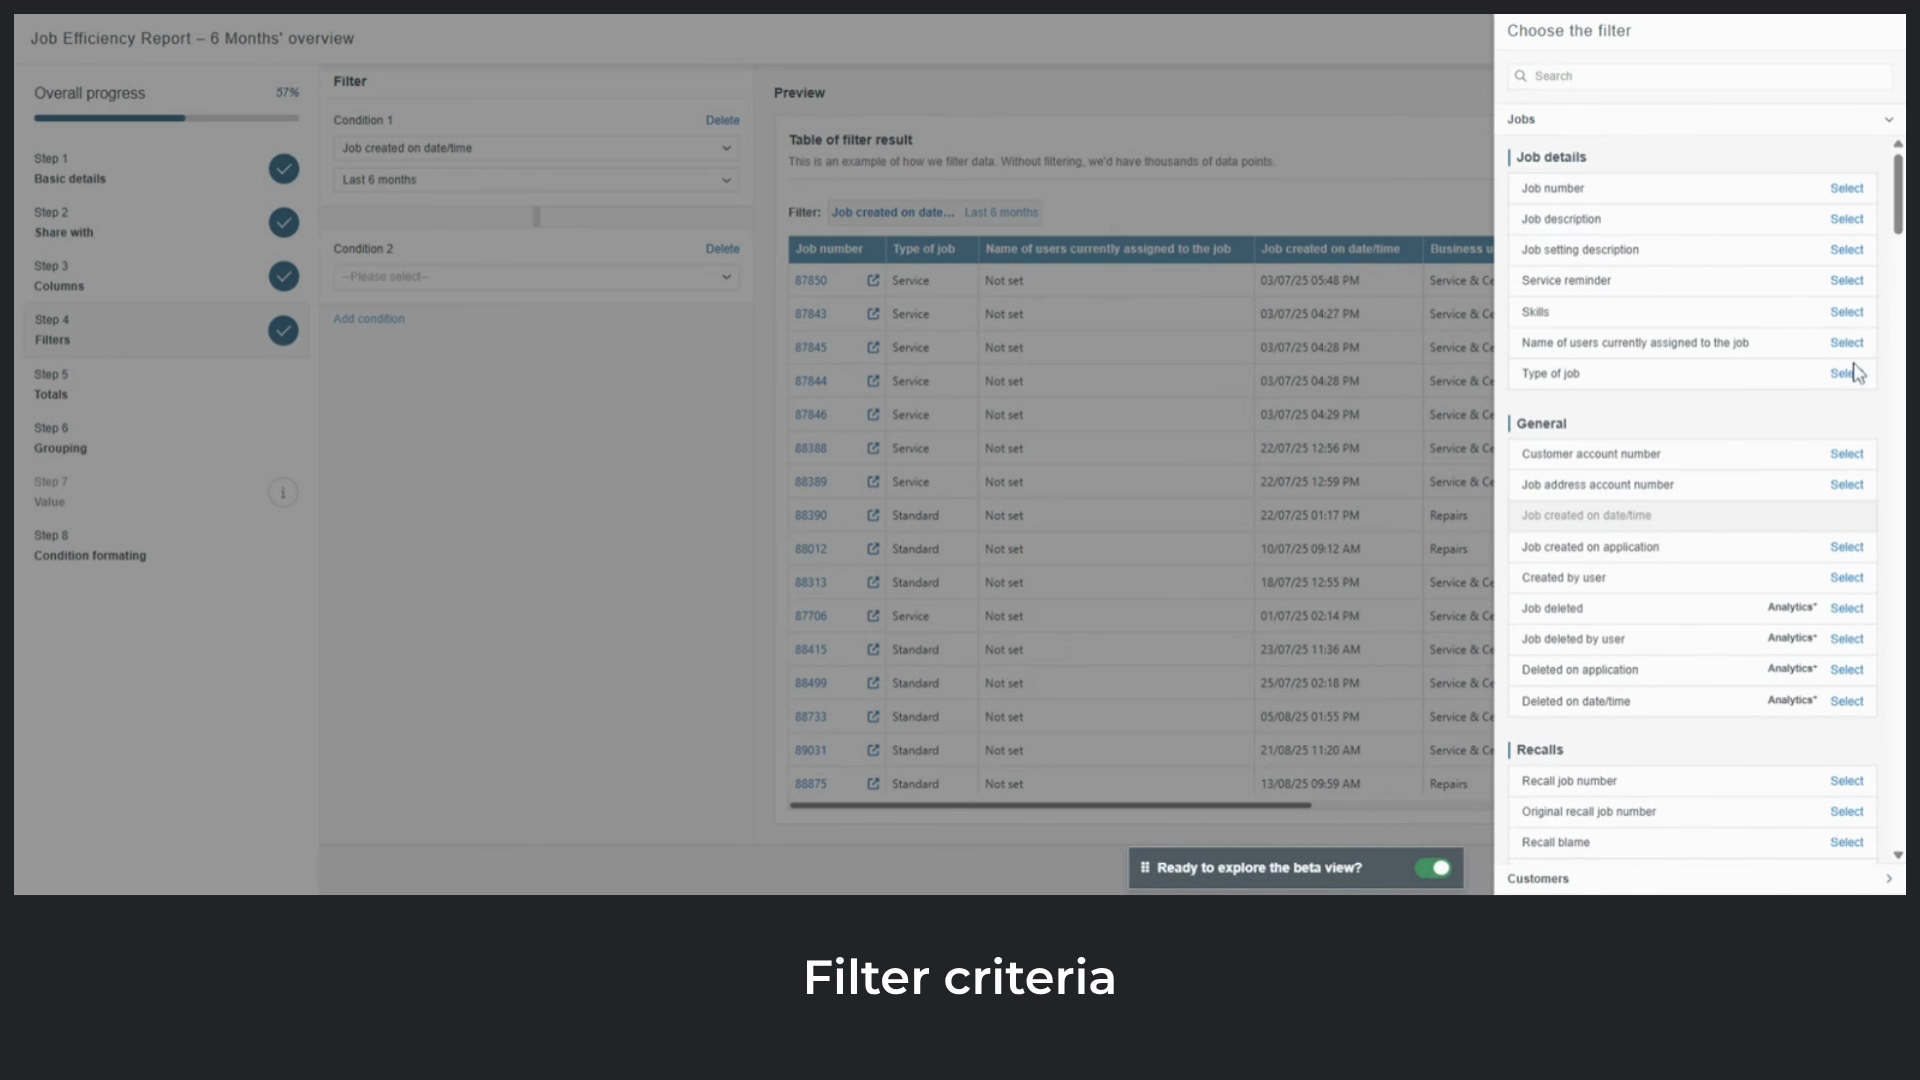
add as many conditions as needed and parent object fields
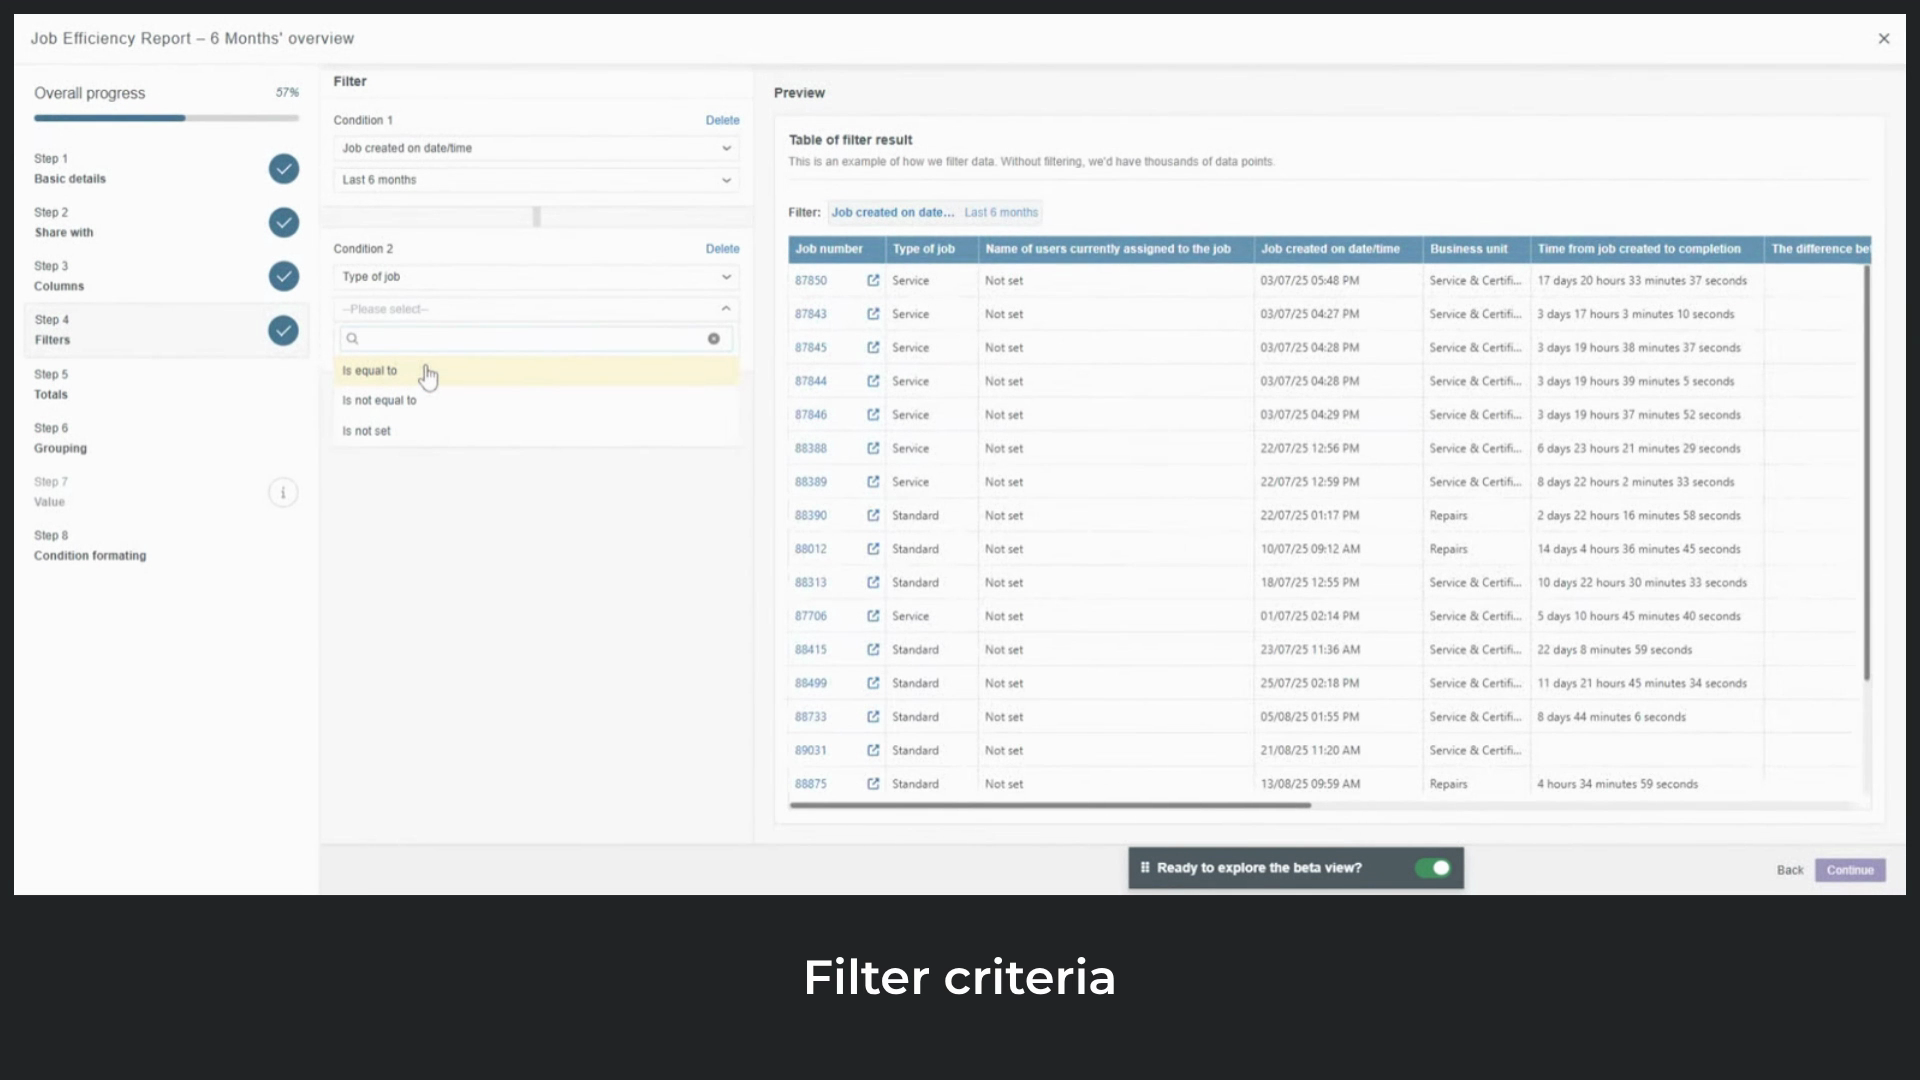
are available too. So for the job's data source, customer fields can also be used as filter conditions.
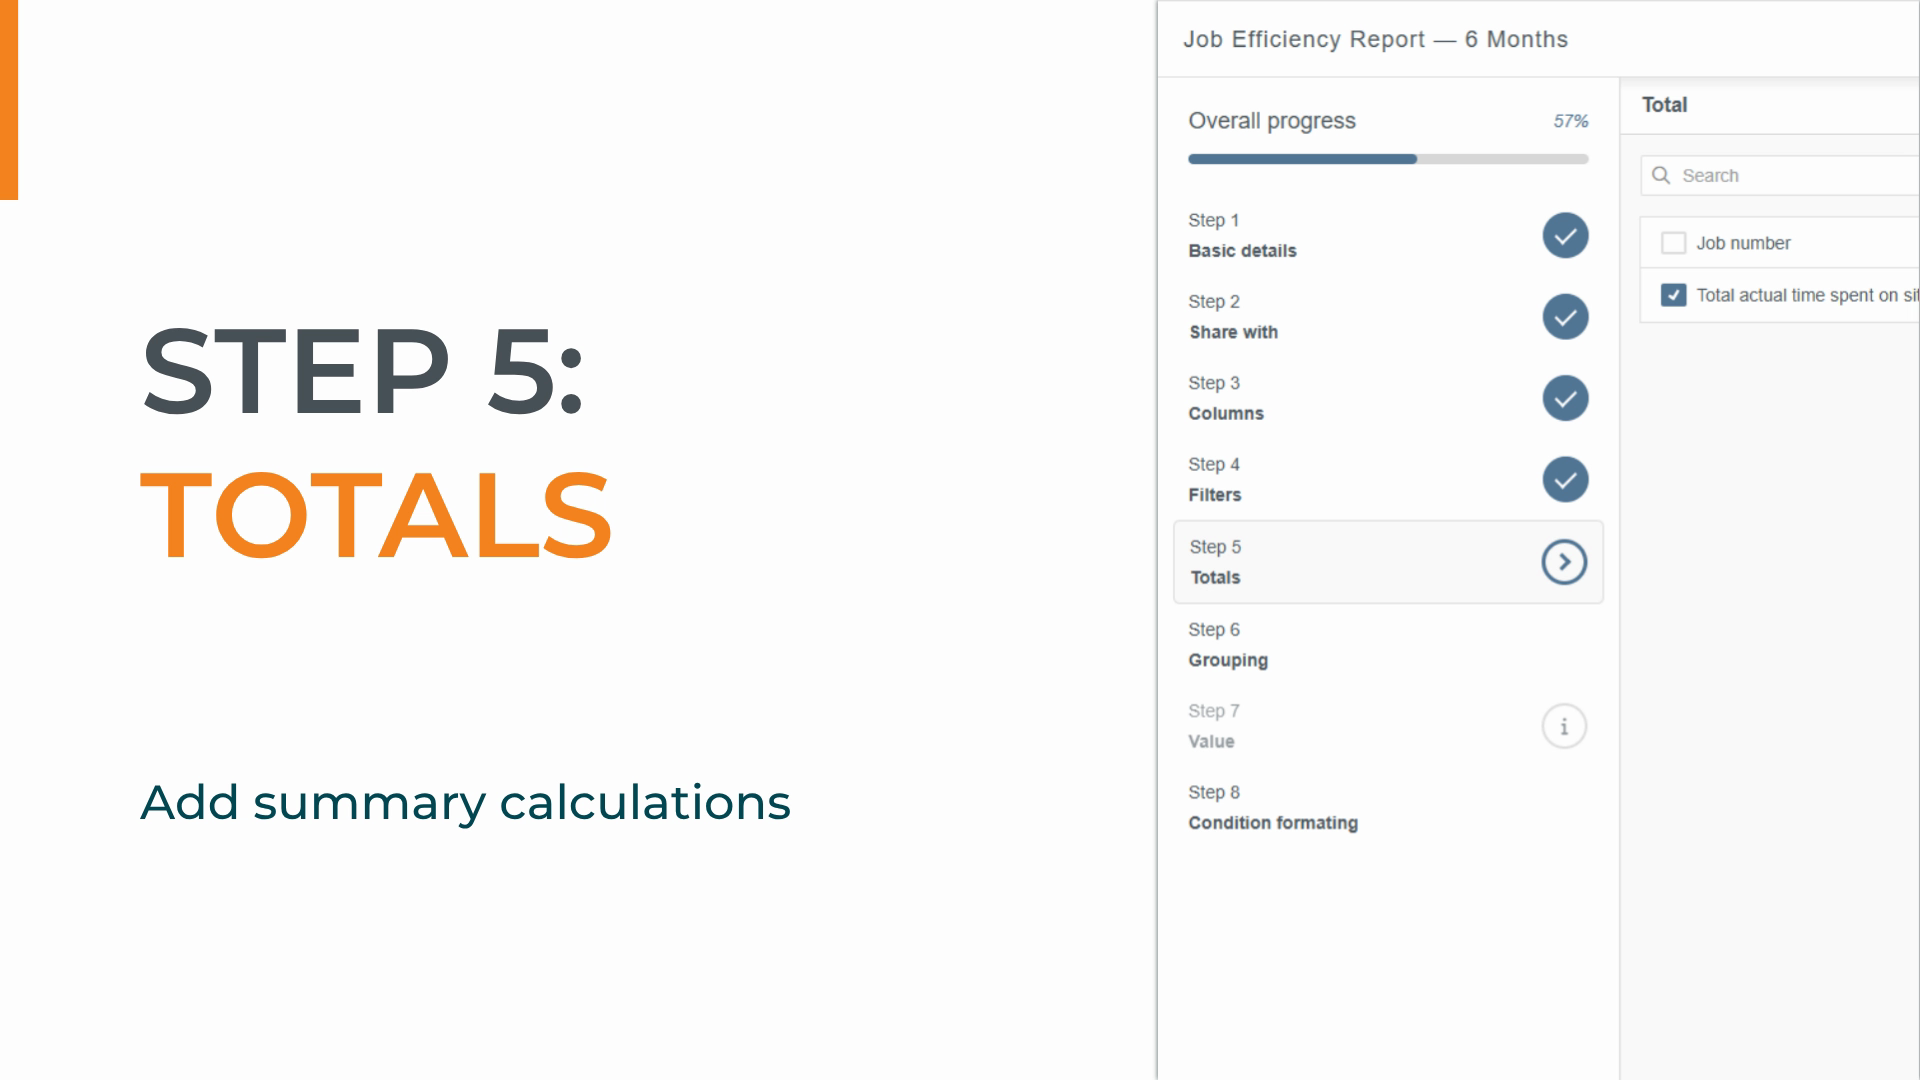
Step five is totals. This lets us
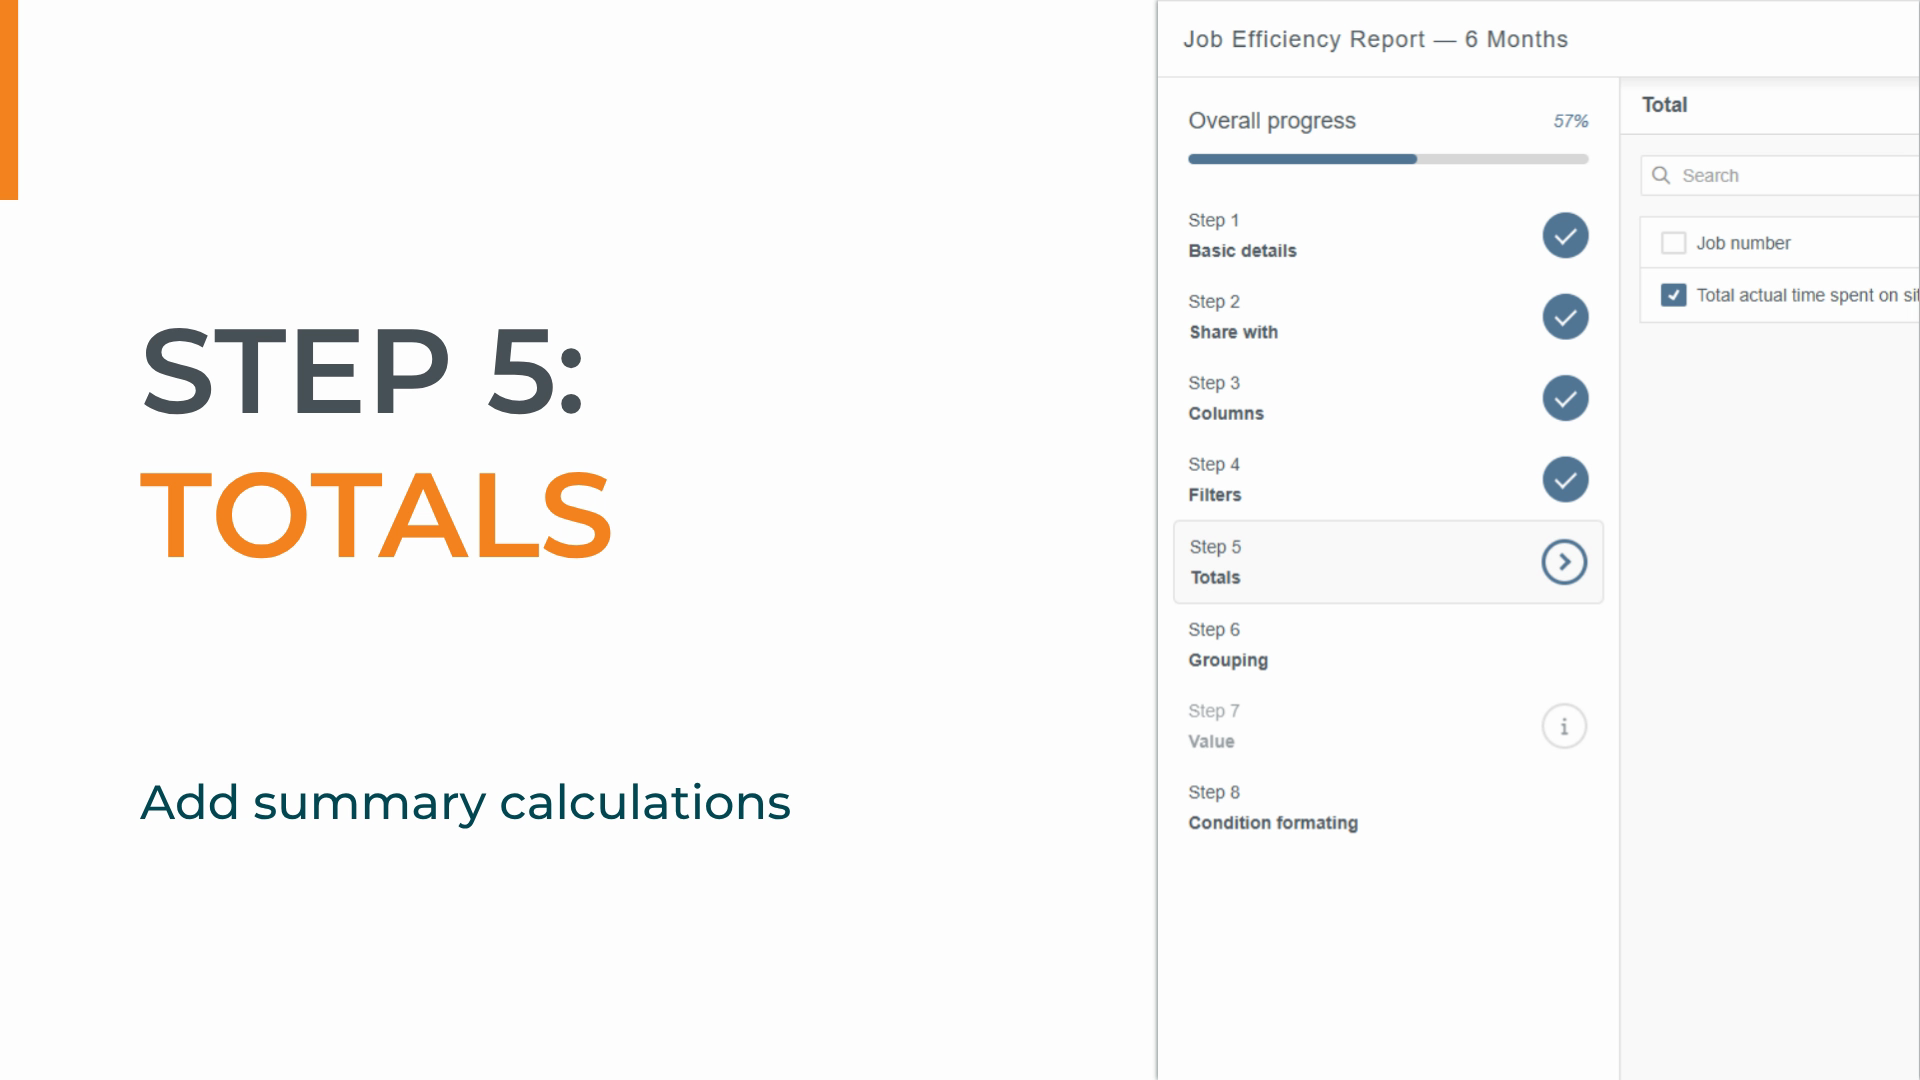
add summary calculations at the bottom of the report so we can see grand totals across key columns without adding them up manually.
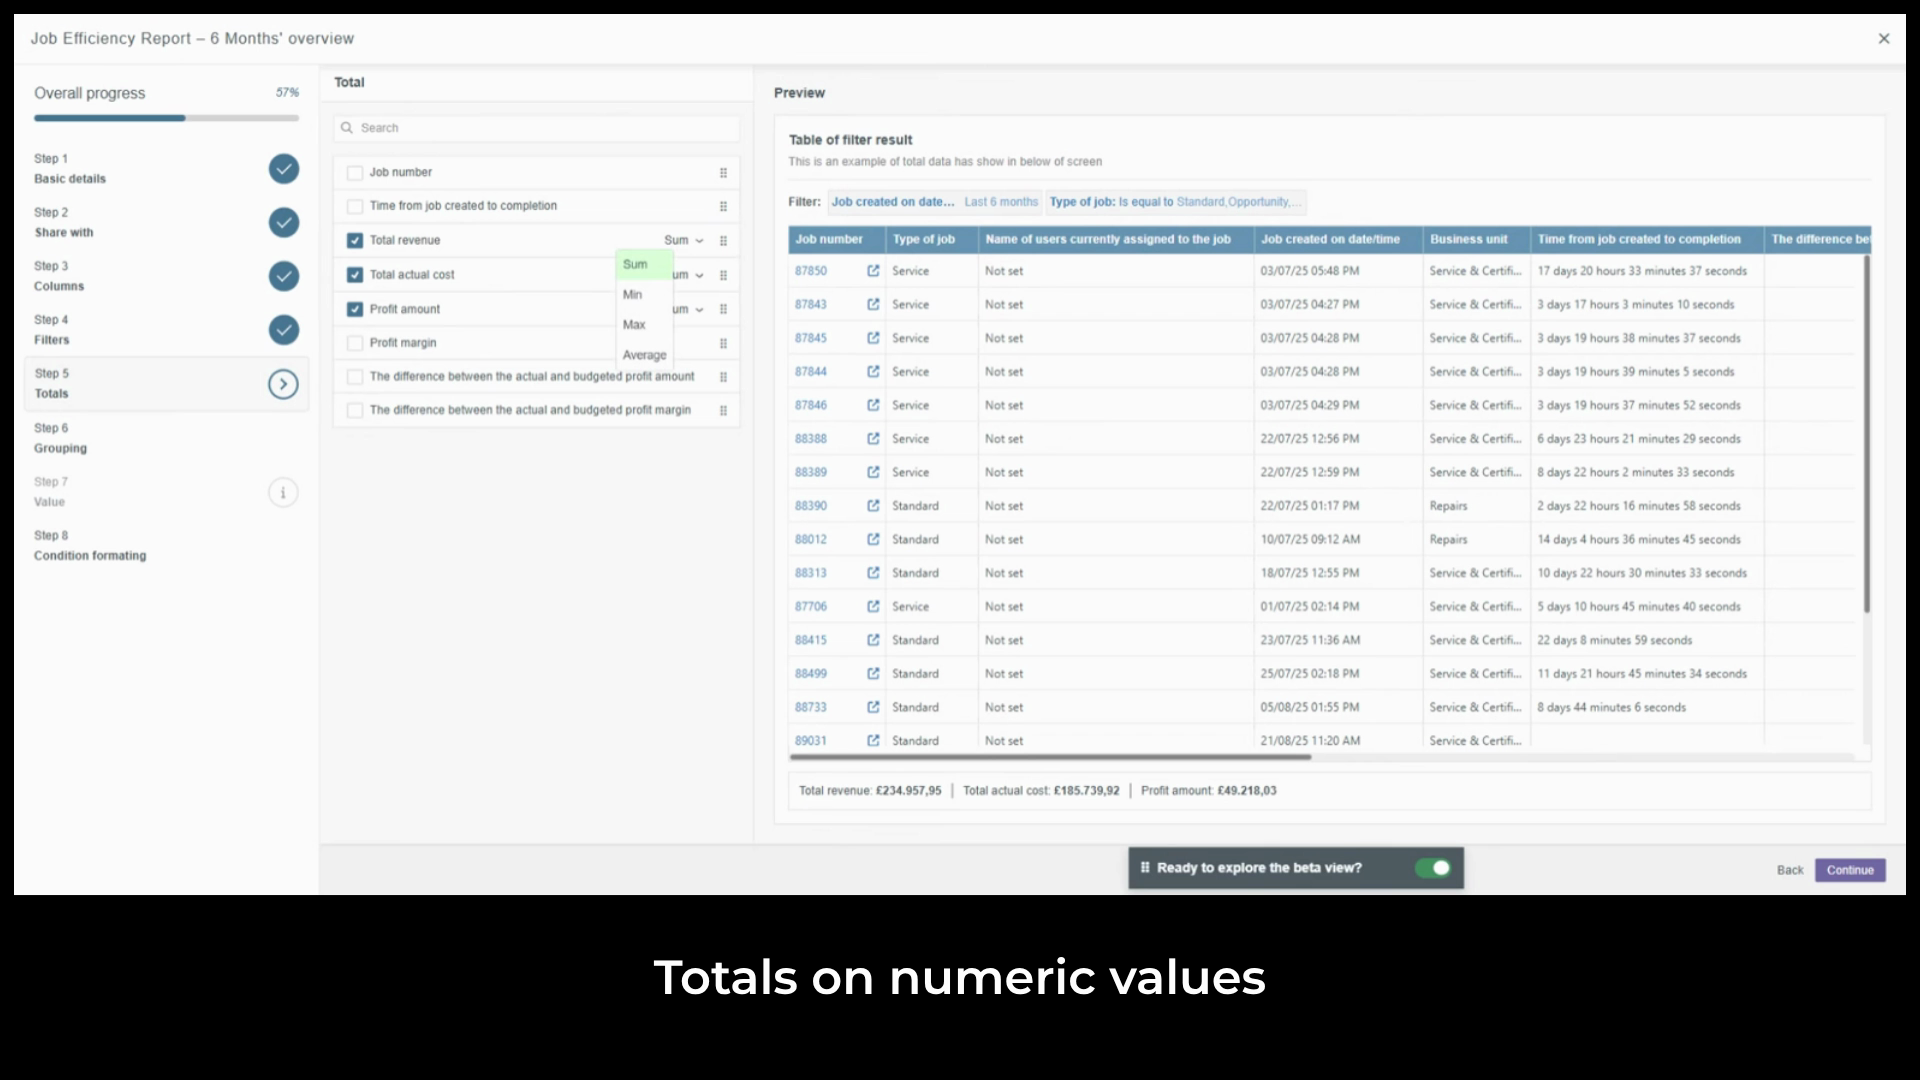
We'll add total revenue,
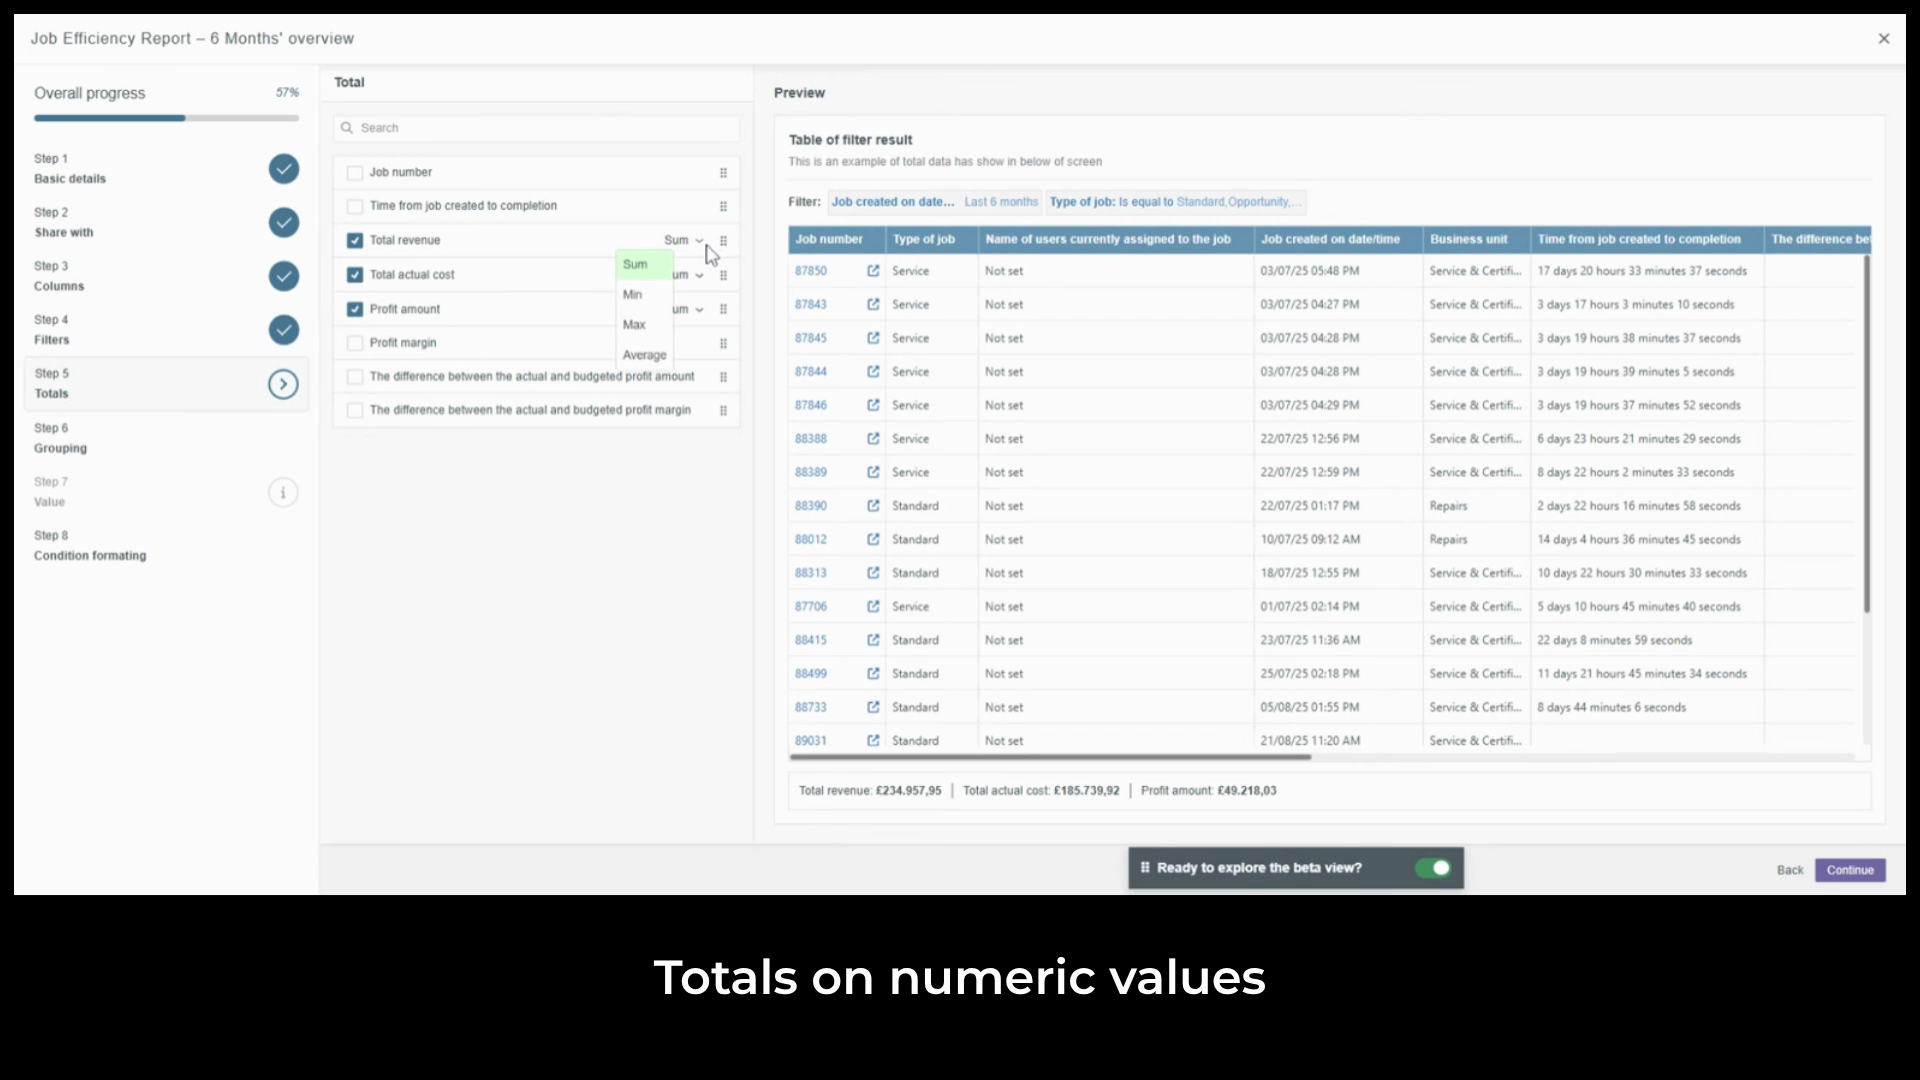
total actual cost, and profit amount.
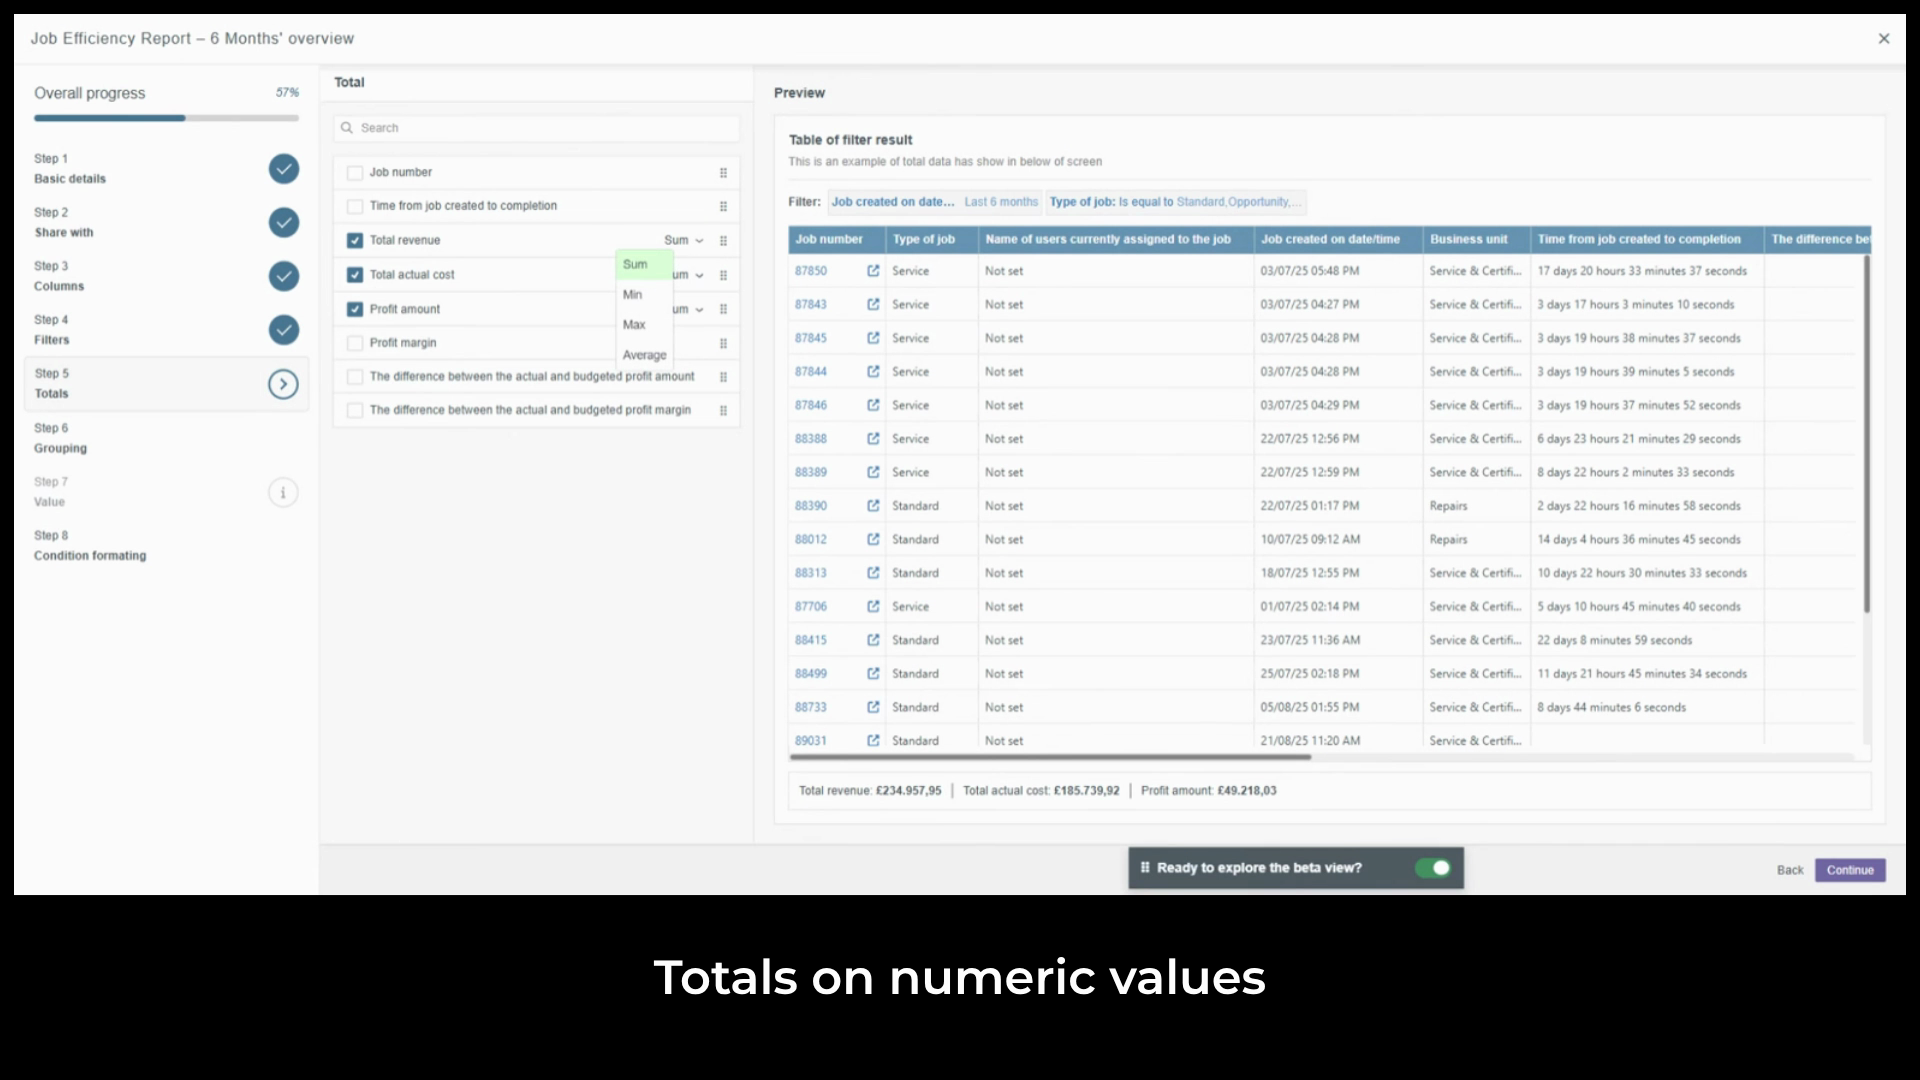
Each set to sum these three together give you a clear view of income generated, cost of delivery, and what the business actually earned across the six month period without adding anything up manually.
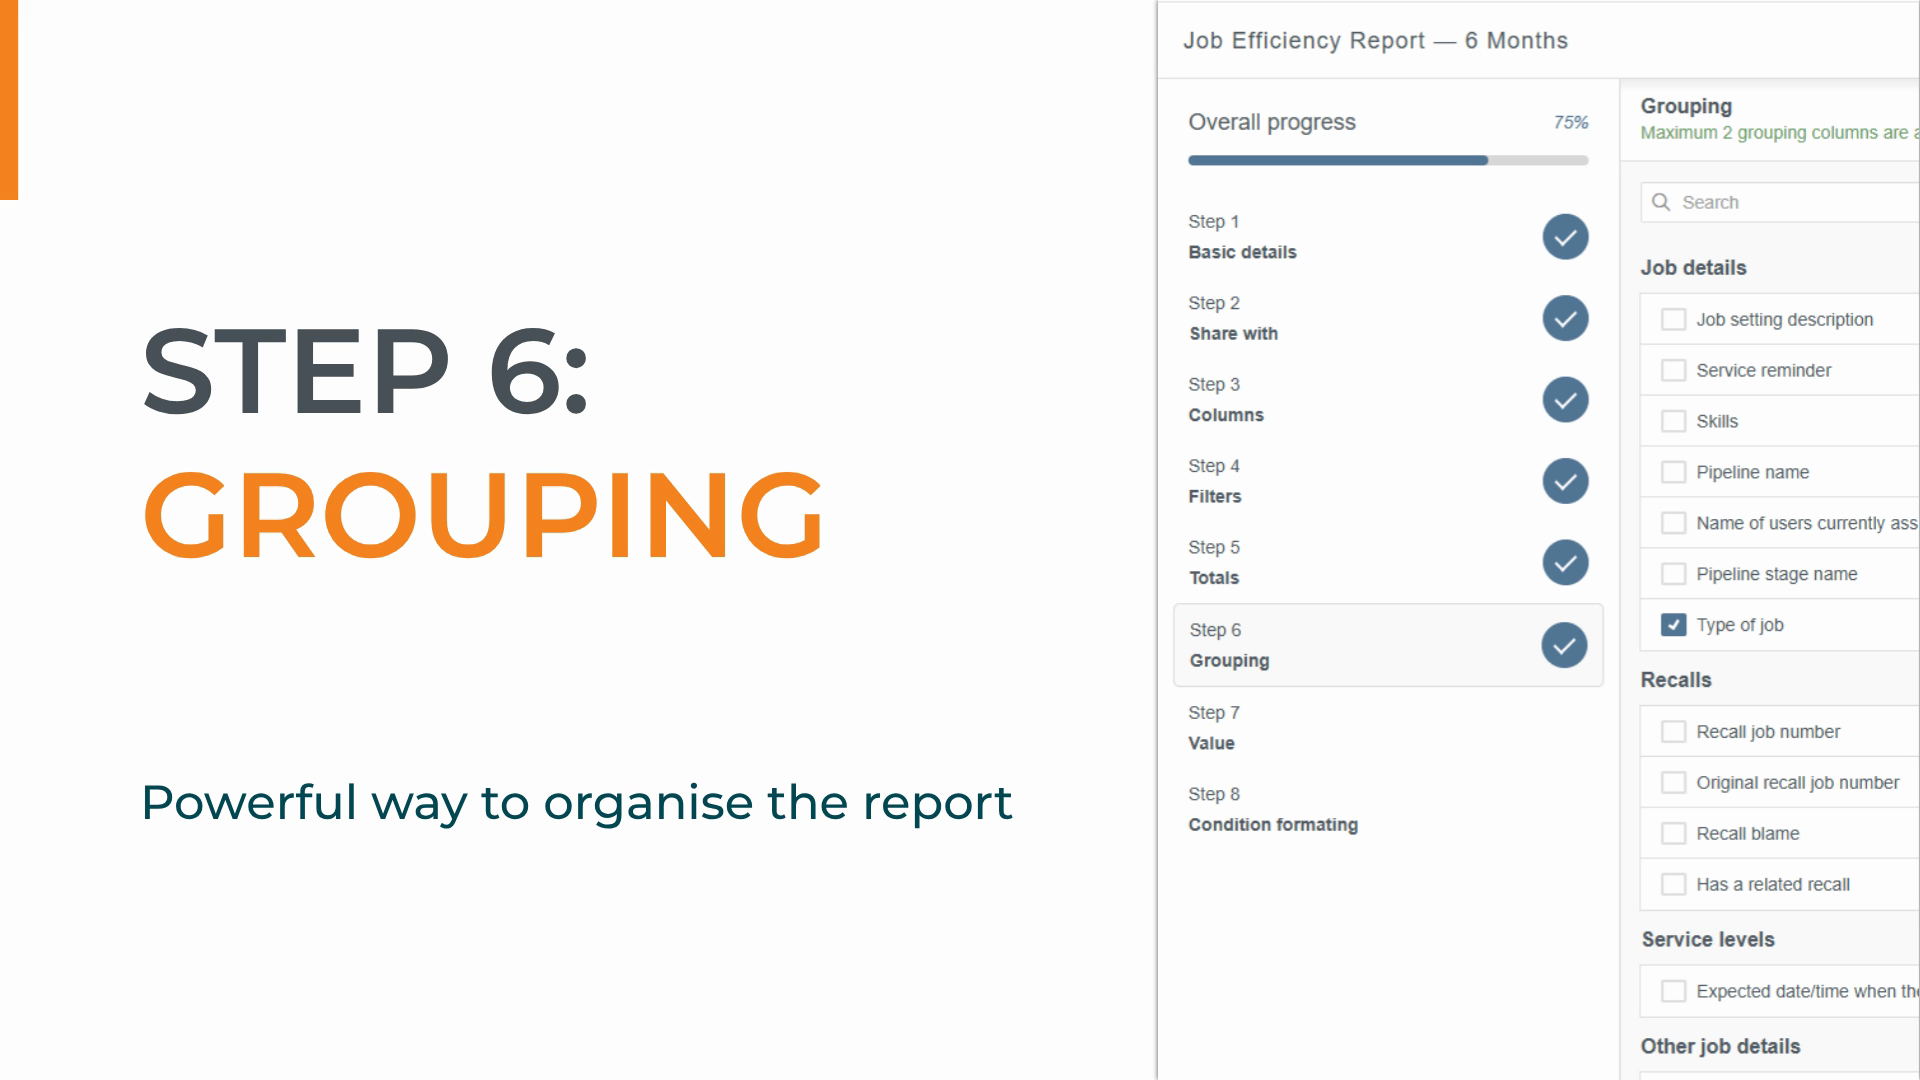
Step six is grouping a powerful way
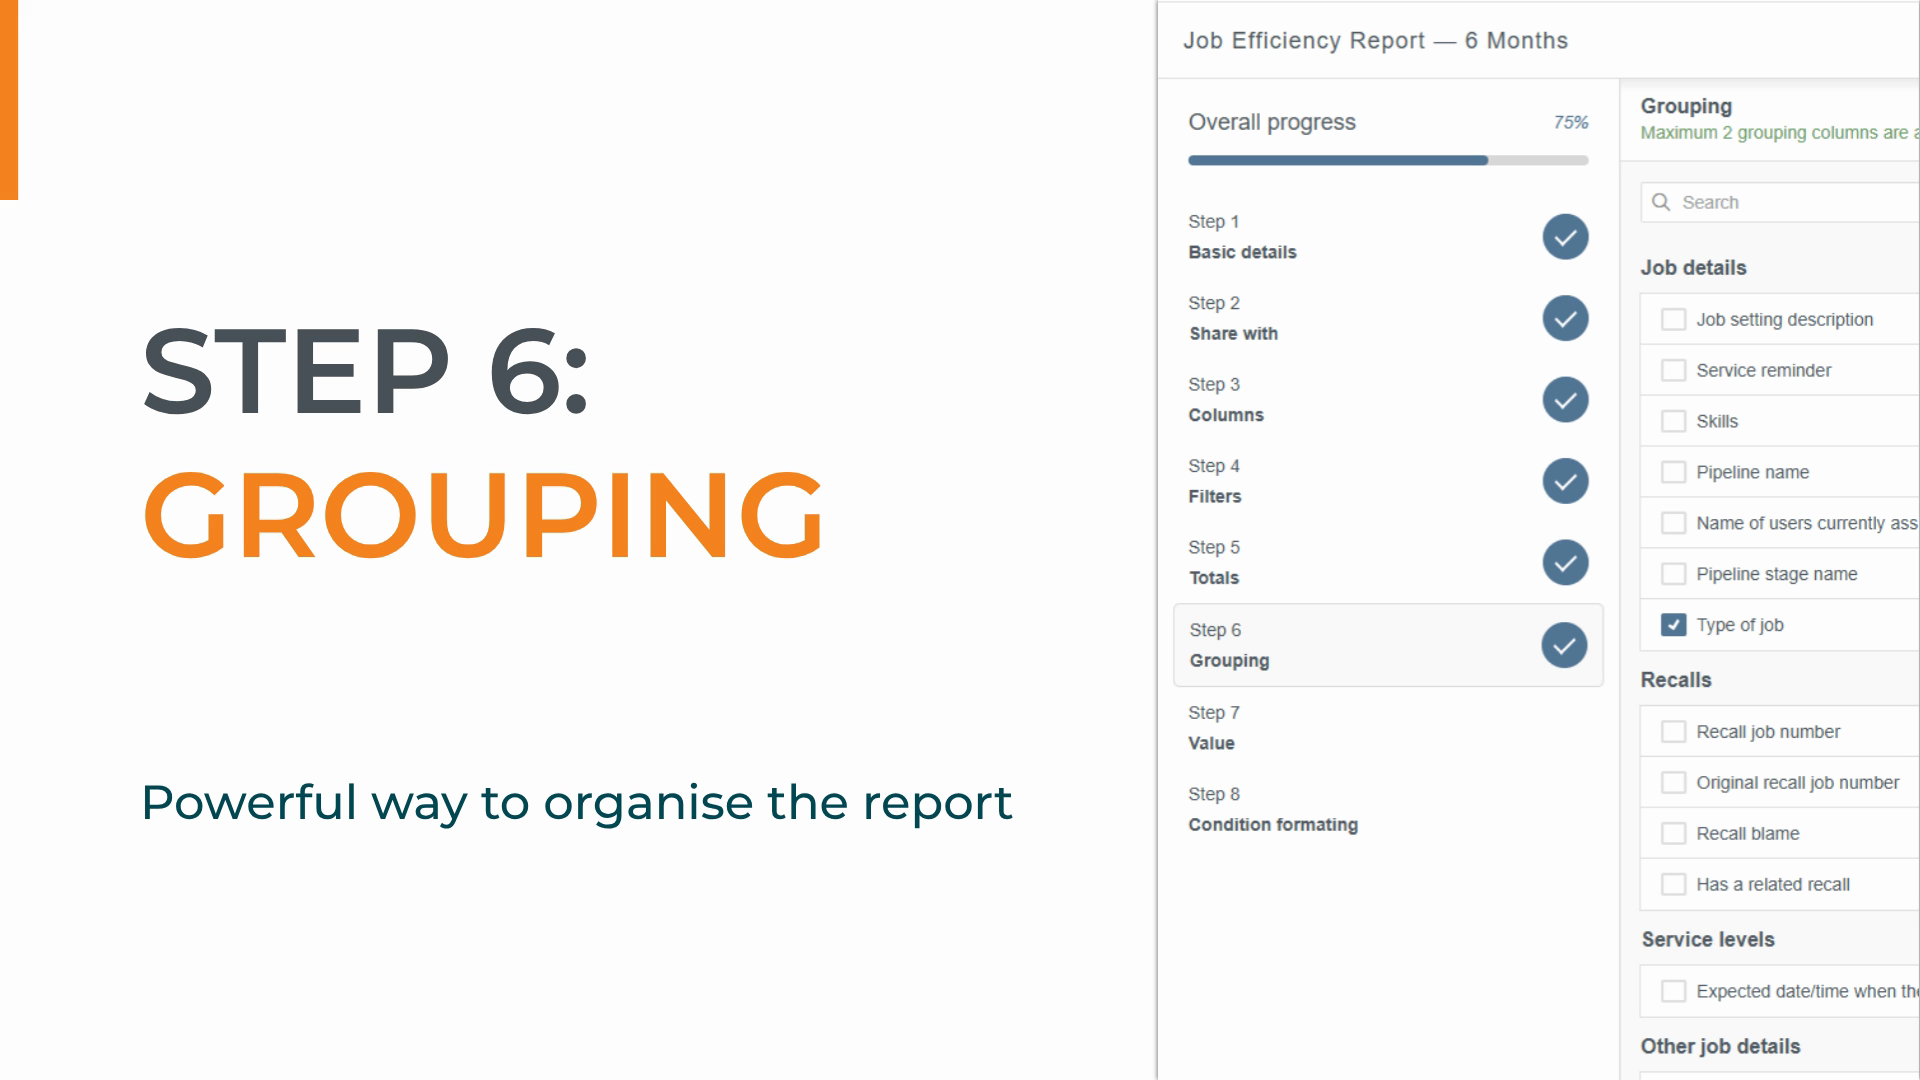
to organize the report into logical sections, making it easier to read and analyze. Think of it like adding subheadings to a document.
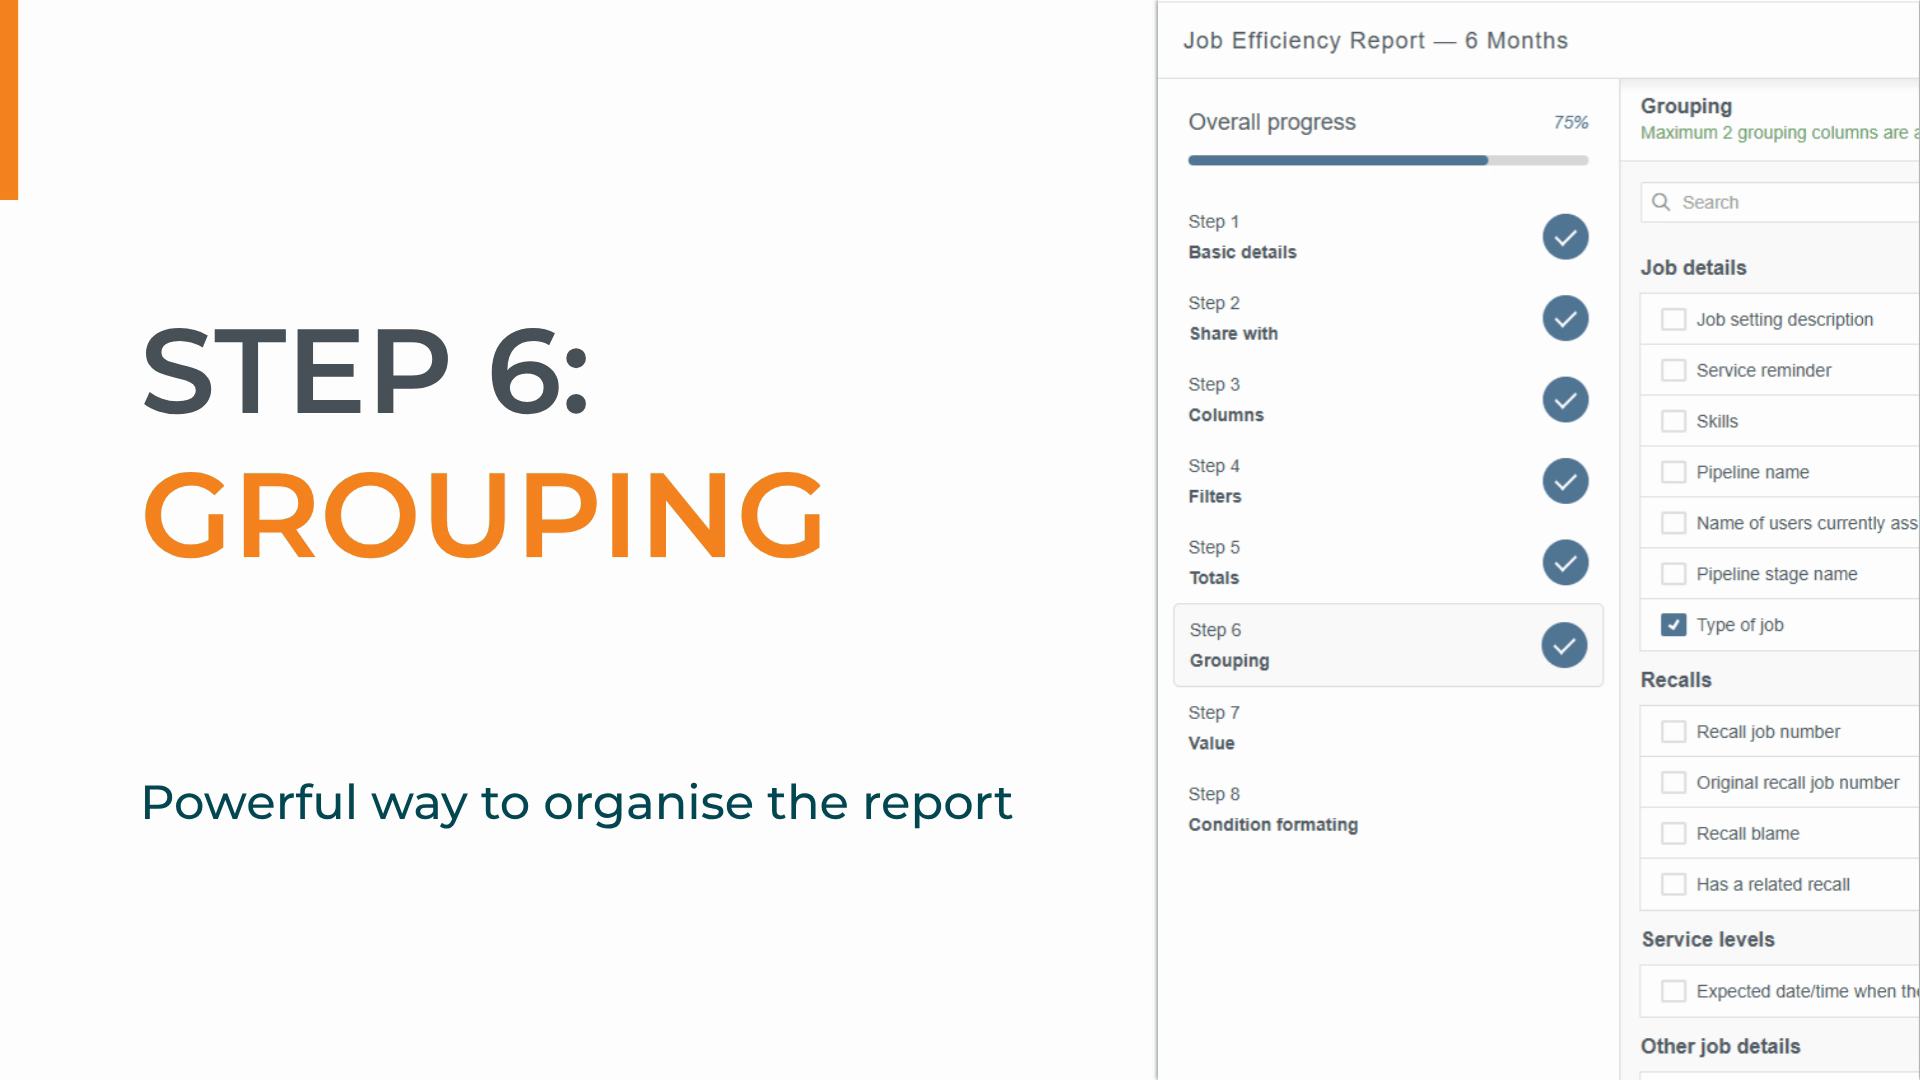
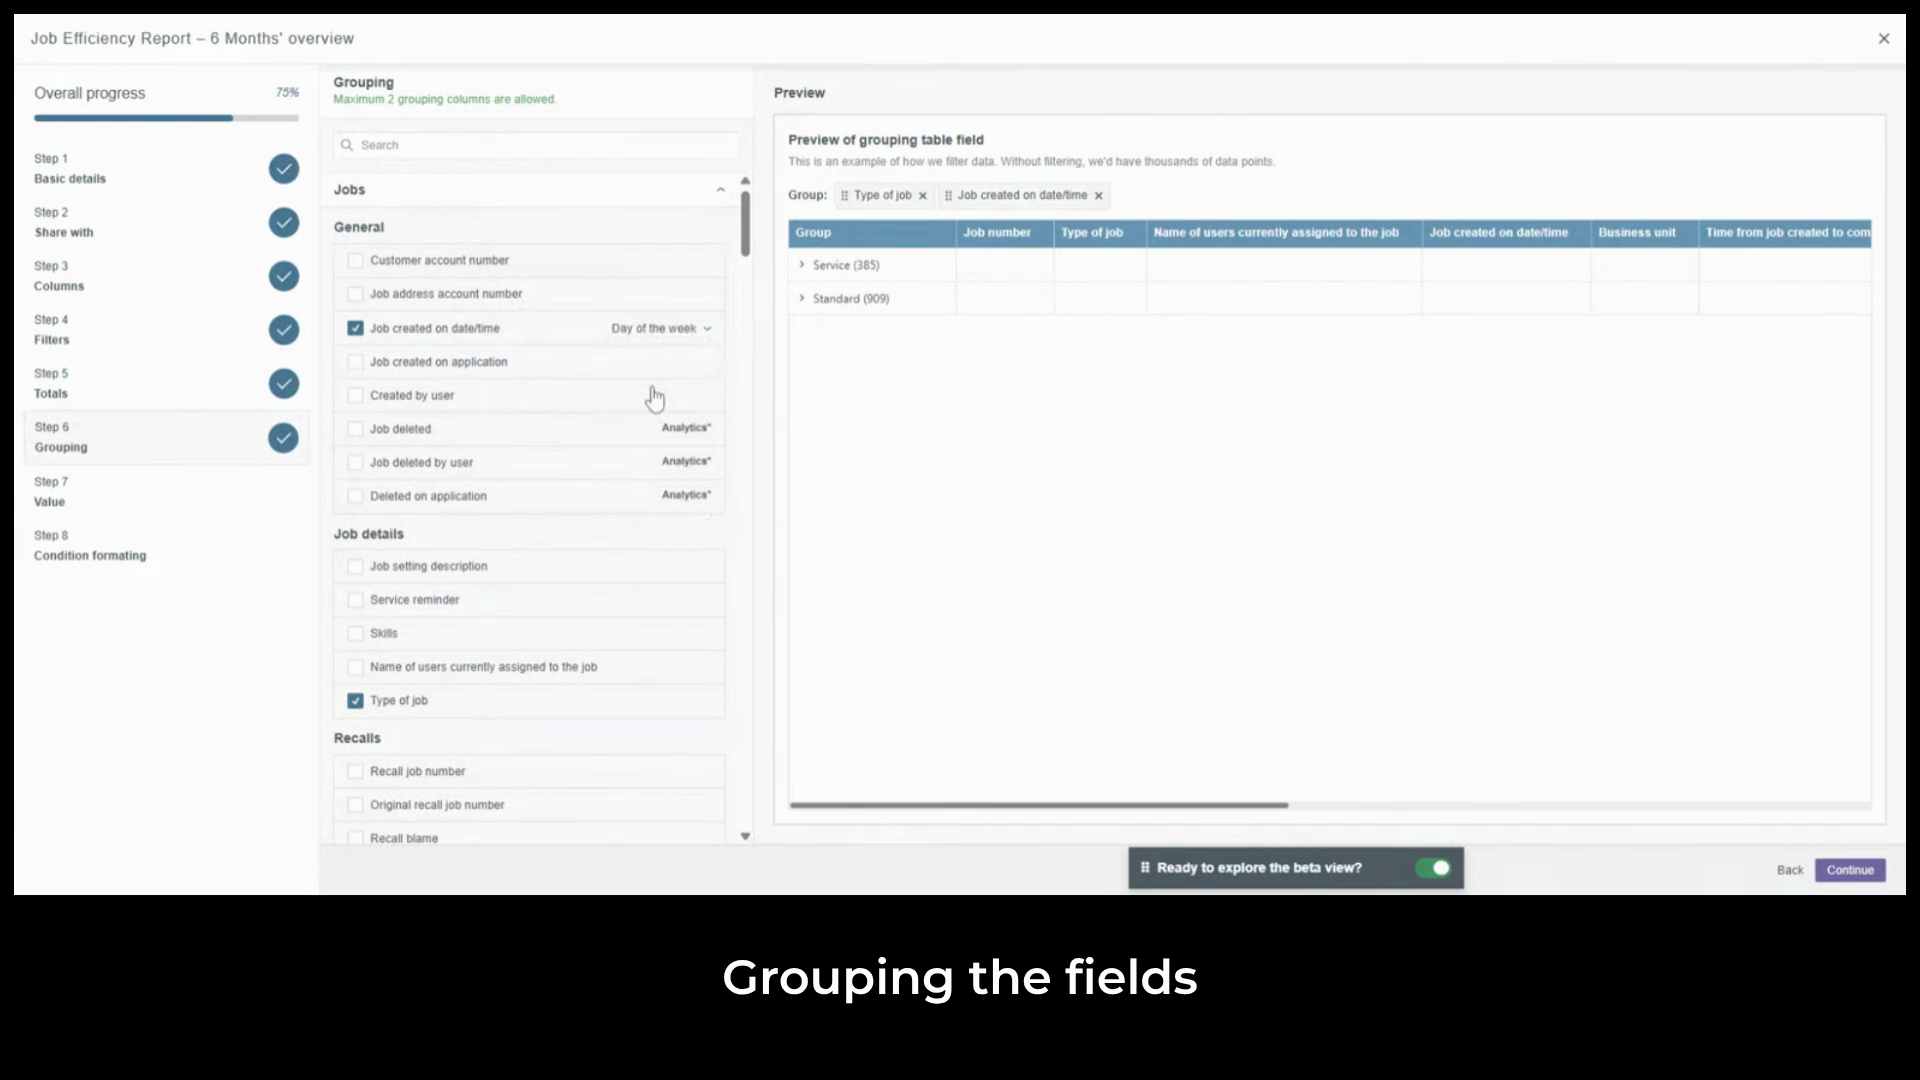
We can apply up to two levels of grouping.
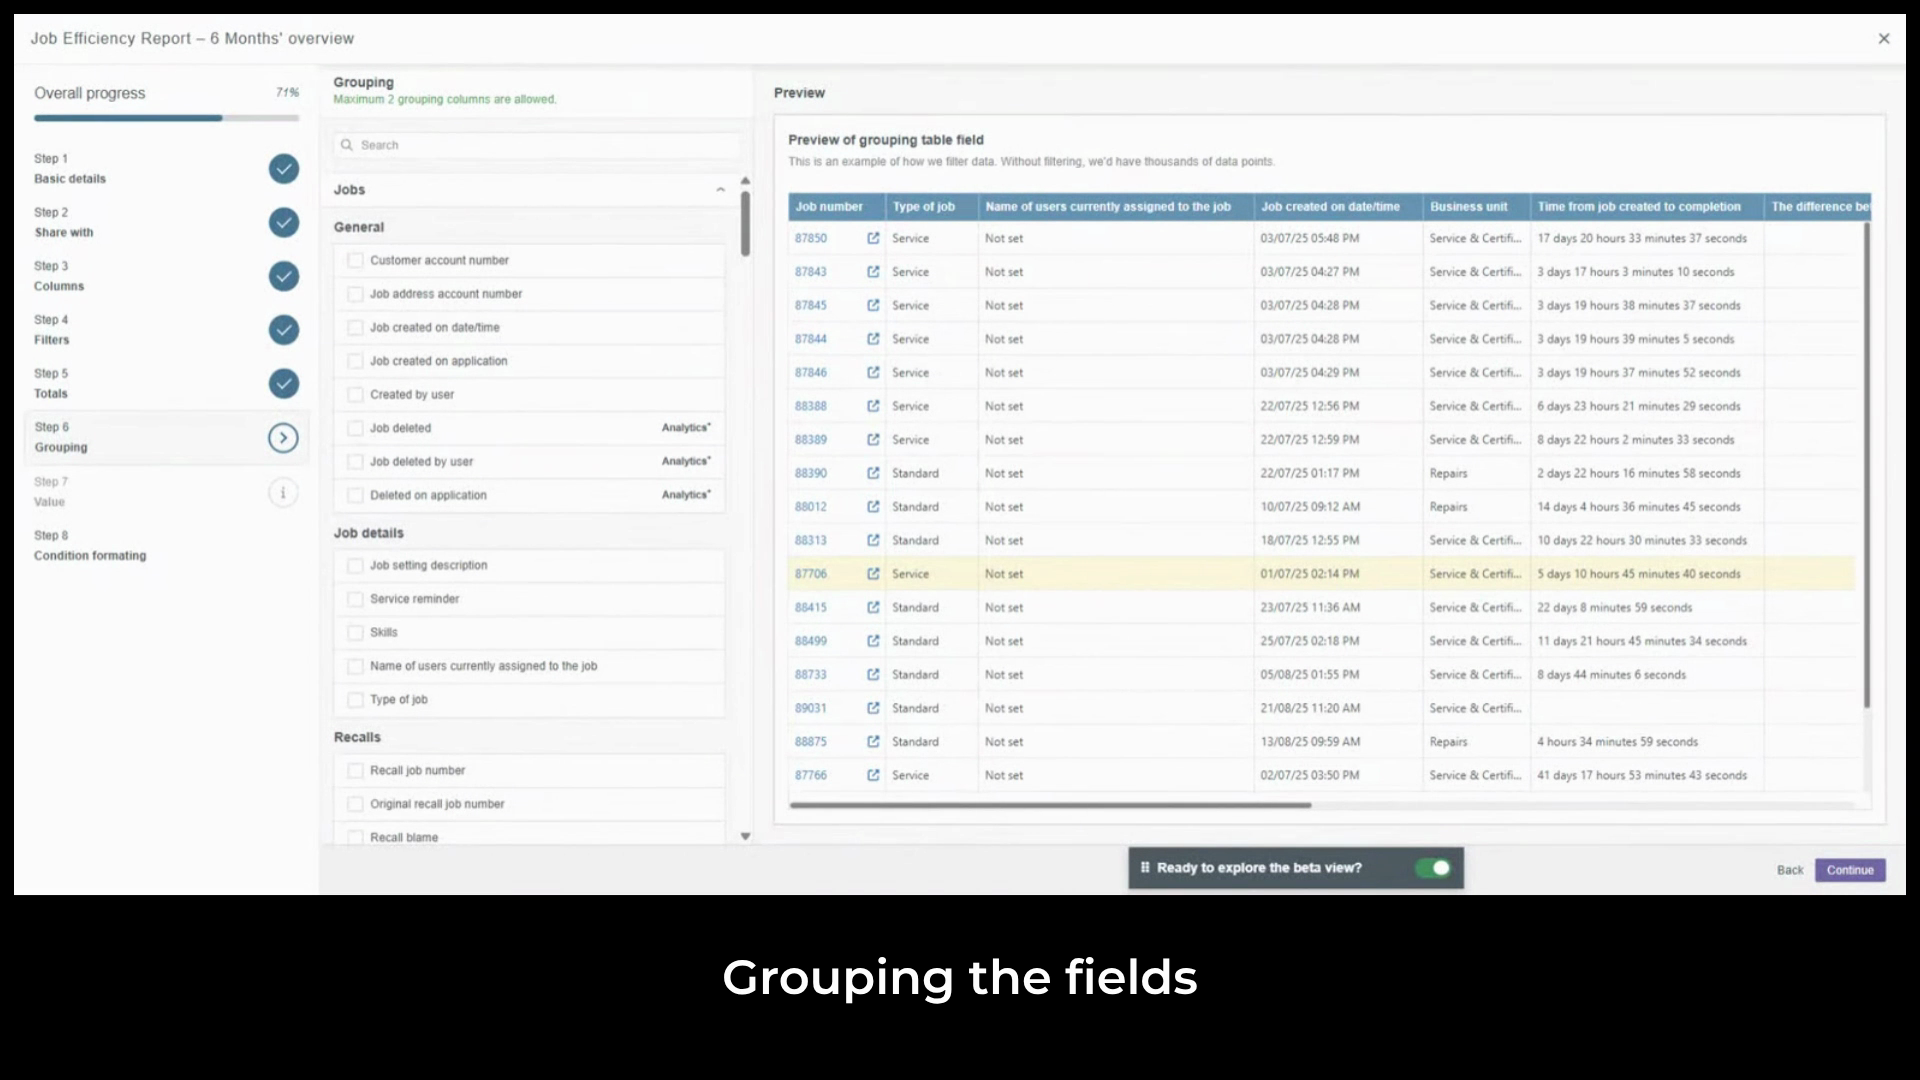
We'll start with the primary grouping.
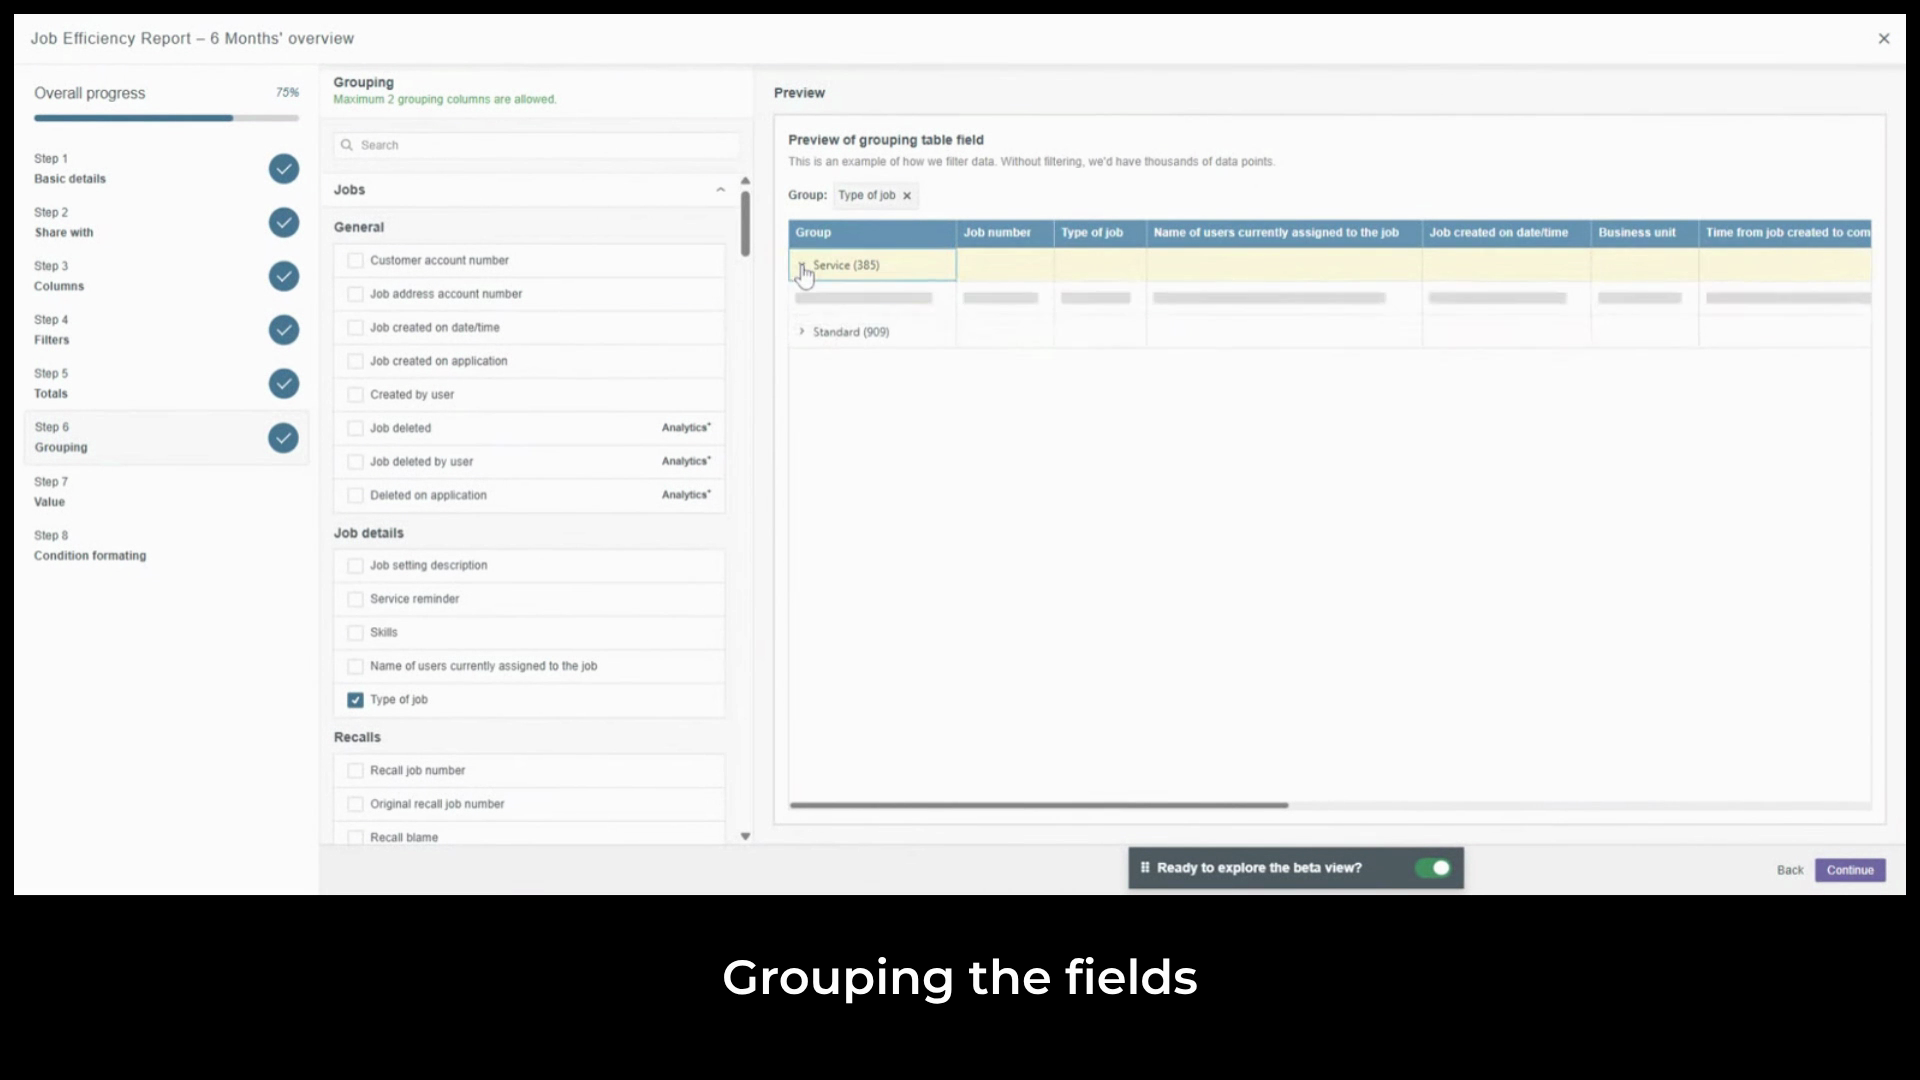
Select type of job. Now
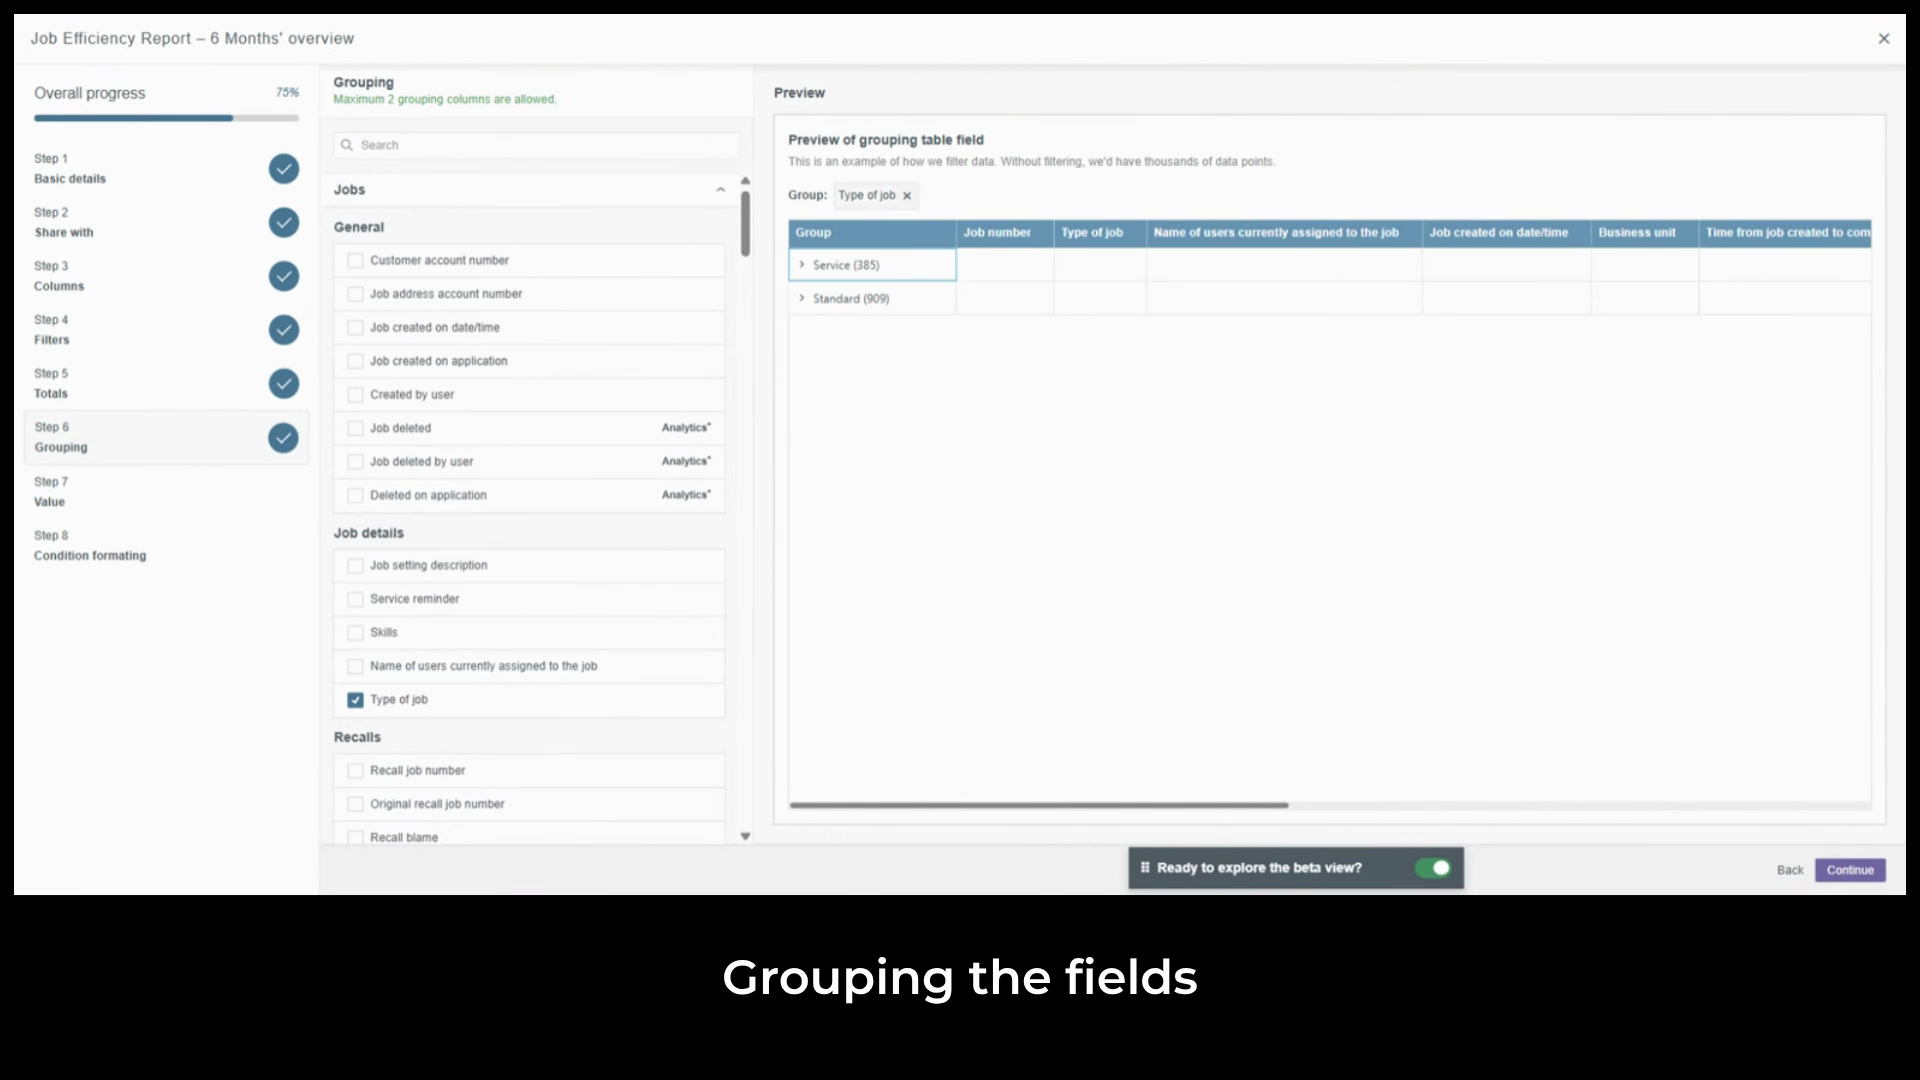
add the secondary grouping job created on date and time displayed by month.
Expand any month to see the individual job records and
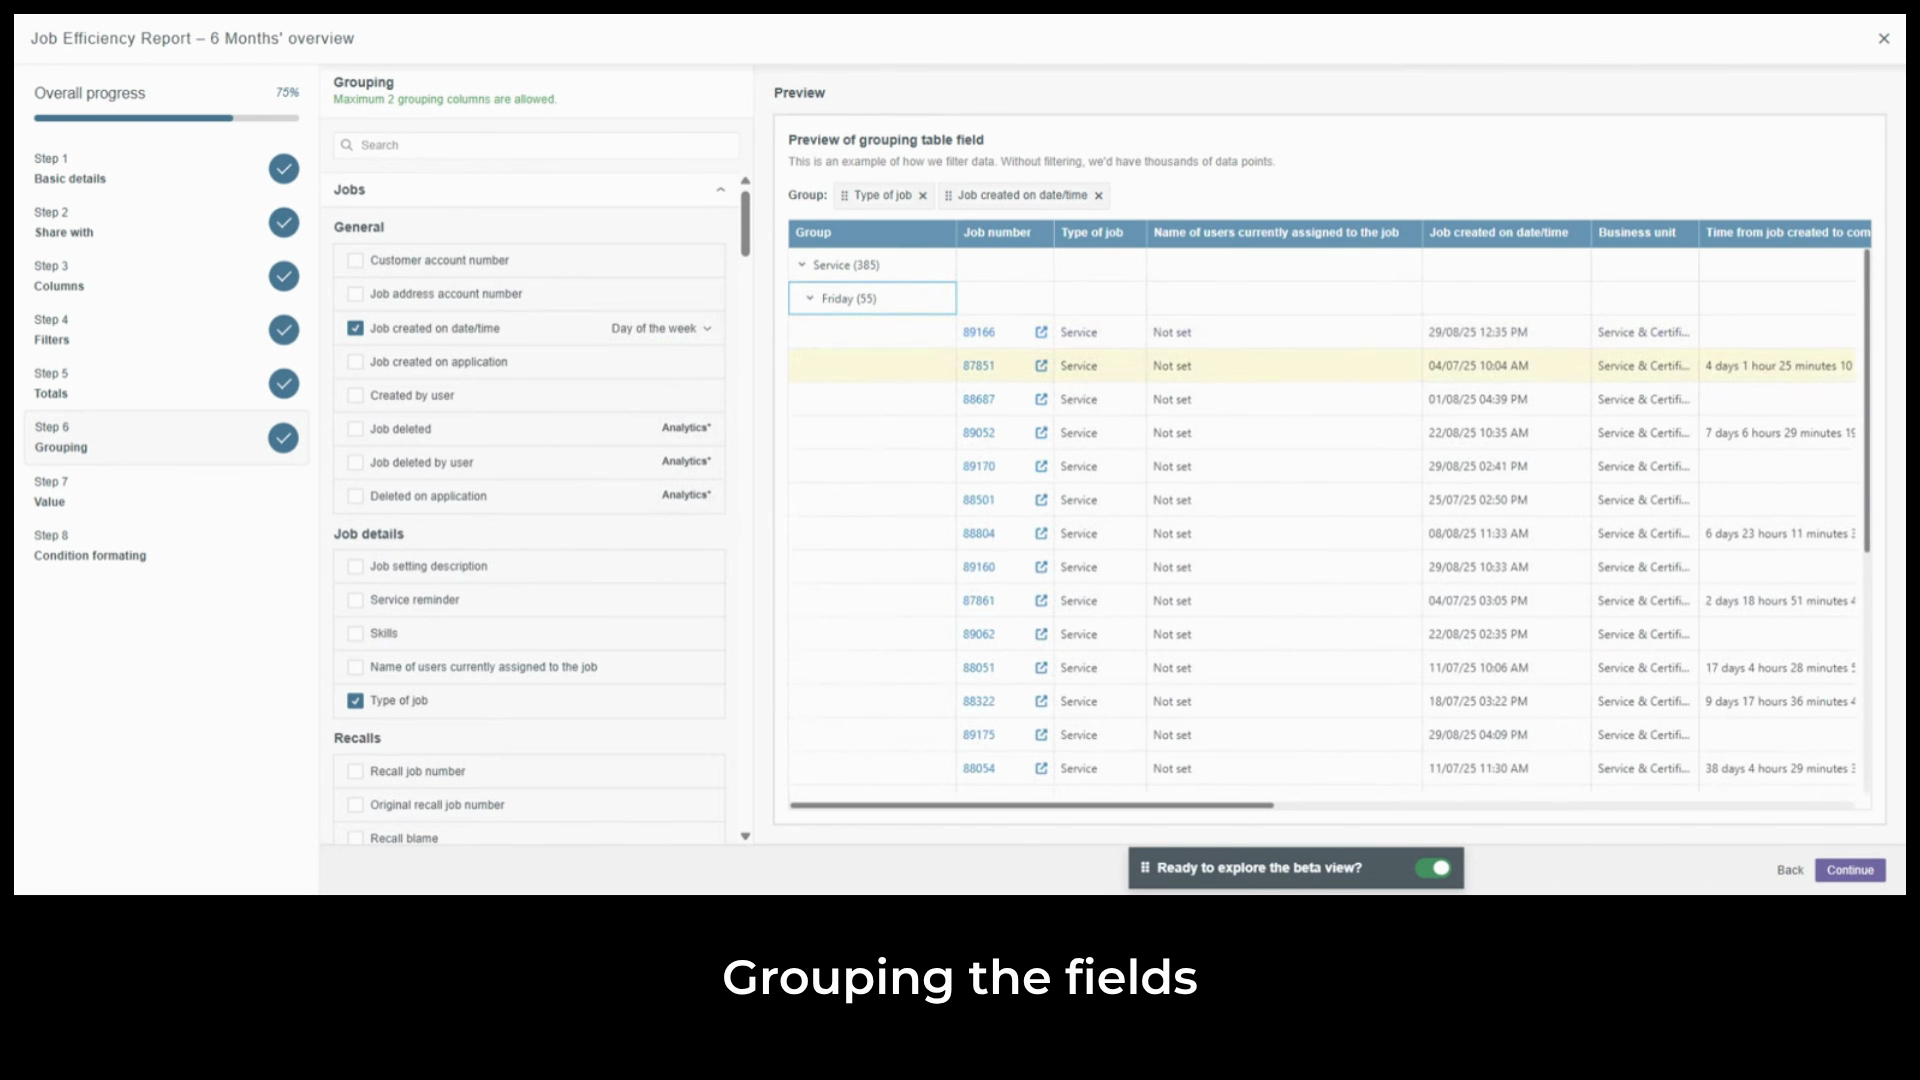
click a linked job number to go directly to that record in the system.
Created on
Did you find this article helpful?